
Bitcoin ($BTC), Ethereum (ETH), and Ripple ($XRP) have all retraced after hitting key resistance levels.
$BTC is trading at $74,000, while Ether and $XRP are now around $2,330 and $1.35.
Solana’s $SOL is also under pressure, trading just above $80 at press time on Wednesday.
It has lost 2% of its value in the last 24 hours as the lack of institutional support prolongs its consolidation.
Solana’s retail market is also showing signs of a near-term sell-side dominance.
Solana should reclaim the 100-day Exponential Moving Average (EMA) around $100 for a steady recovery.
Poor institutional and retail demand keep $SOL under pressure
Solana has been underperforming in recent days due to poor institutional and retail demand.
Institutions are rebalancing their Solana exposure through Exchange Traded Funds (ETFs), which have recorded three consecutive weekly outflows.
Data obtained from CoinGlass showed muted inflows on Solana ETFs since the start of the week, suggesting a lack of interest from institutions.
In addition to that, retail demand for Solana declines amid broader market volatility.
Solana’s futures Open Interest (OI) is down 3% in the last 24 hours and now reads $4.93 billion, suggesting reduced positional exposure.
Furthermore, the funding rate drops to -0.0055%, indicating that traders are willing to hold short positions, evidenced by the long-to-short ratio of 0.9822.
The ongoing Middle East tensions continue to affect the broader cryptocurrency market’s performance.
An agreement between the United States and Iran would effectively end the war and allow assets like Bitcoin and Solana to race higher.
However, with the negotiations set to resume later this week, traders remain cautious, and this is translating into stale price action for Solana and other leading cryptocurrencies.
Solana price forecast
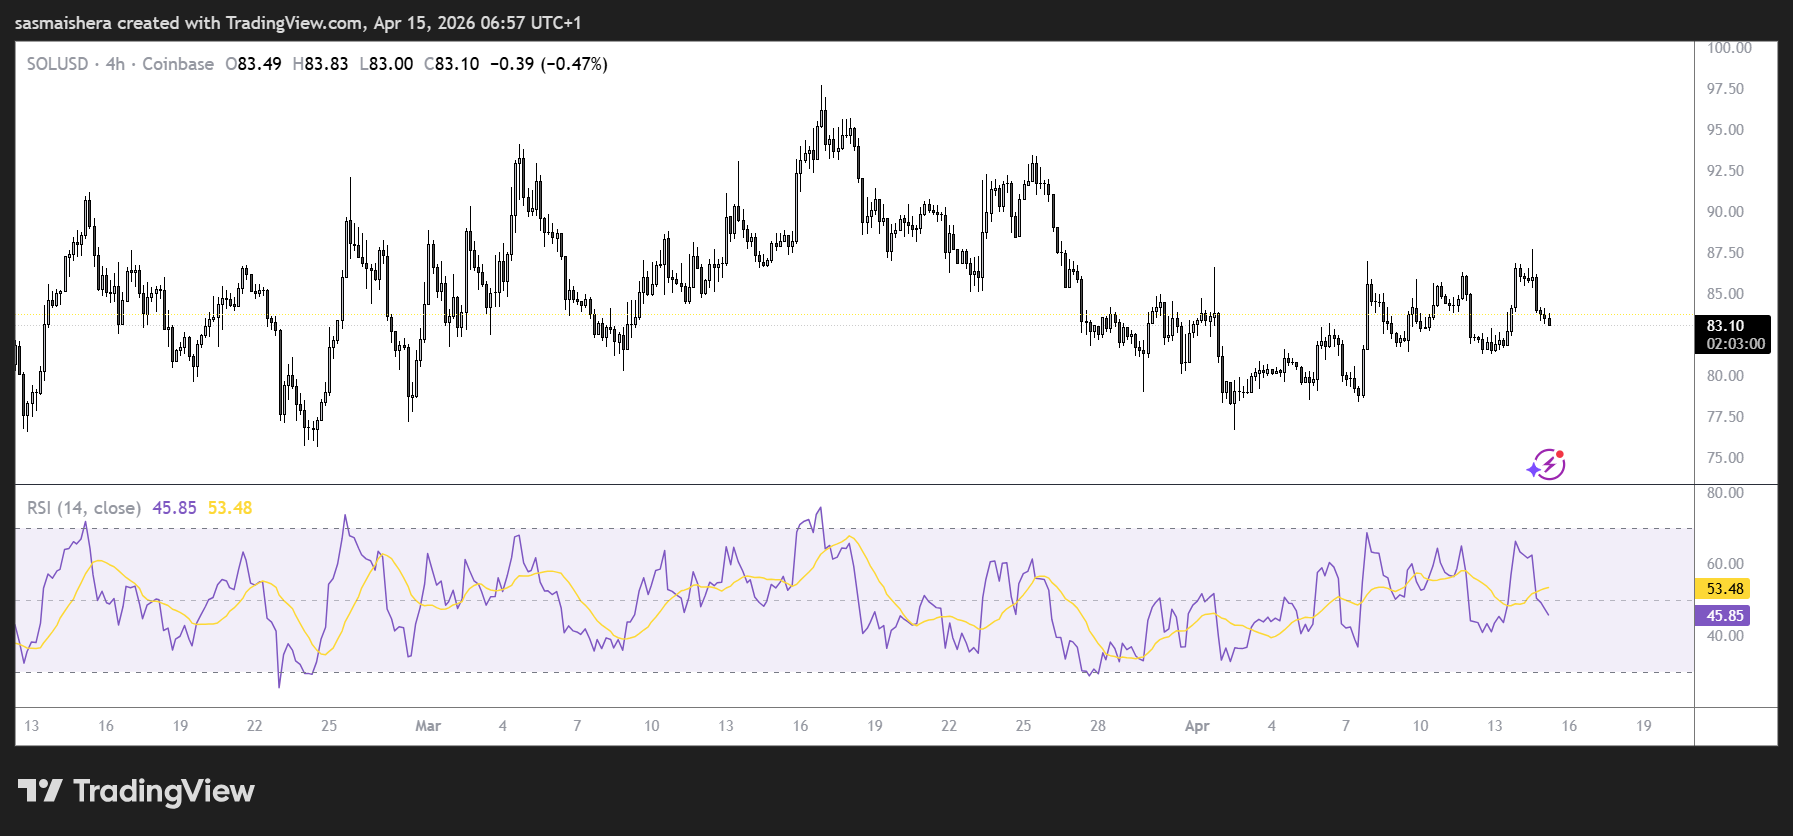
Similar to other leading cryptocurrencies, the $SOL/USD 4-hour chart remains bearish and efficient.
$SOL is currently in a broadly bearish configuration, trading beneath the 50-day, 100-day, and 200-day Exponential Moving Averages (EMAs).
These EMA levels all act as overhead supply and cap recovery attempts.
The momentum indicators also suggest that the bulls lack the conviction to push $SOL’s price higher in the near term.
The Moving Average Convergence Divergence (MACD) indicator shows its line holding in positive territory with a modest bullish tilt.
Furthermore, the Relative Strength Index (RSI) at 53 hovers just above the neutral line, suggesting upside momentum is stabilizing but has yet to overcome the dominant overhead structure.
If the bulls take control of the market and push $SOL’s price above the 50-day EMA near $87.29, it would ease immediate downside pressure.
A daily candle close above the 50-day EMA would expose further upside resistance at the Transactional Liquidity (TLQ) and 100-day EMA of $98.24.
An extended rally would allow $SOL to surge past the 200-day EMA near $116.85, which reinforces the broader bearish bias.
However, if the bears remain in control, they would encounter immediate support at the February low of $77.60.