Data Science Uncovers the Spending Habits of Millennials in Eastern Europe
Eastern Europe has about 74 mln millennials. According to conservative estimates, they will spend over $27 bln in 2019. The spending habits of millennials in the Western world are well-documented and relatively well understood by marketers, but the same cannot be said of millennials in Eastern Europe. There is simply not enough information available on the purchasing behavior of this group of high-value consumers, and as a result they remain relatively inaccessible to many marketers.
This report presents a deep-dive analysis of that population’s spending habits, based on data from a recent large-scale survey. It identifies distinct groups of consumers based on statistical links between demographic traits, interests, and purchasing choices. The findings it reports are specific, approachable, and actionable.
Marketing to millennials in Eastern Europe means understanding a complex and aggressively modern generation. Given these consumers’ standout traits and significant spending power, brands need to evaluate—and gain a better understanding of — targetable sub-demographics within the broader millennial population.
Key Findings
Eastern European millennials can be categorized into four consumer groups.
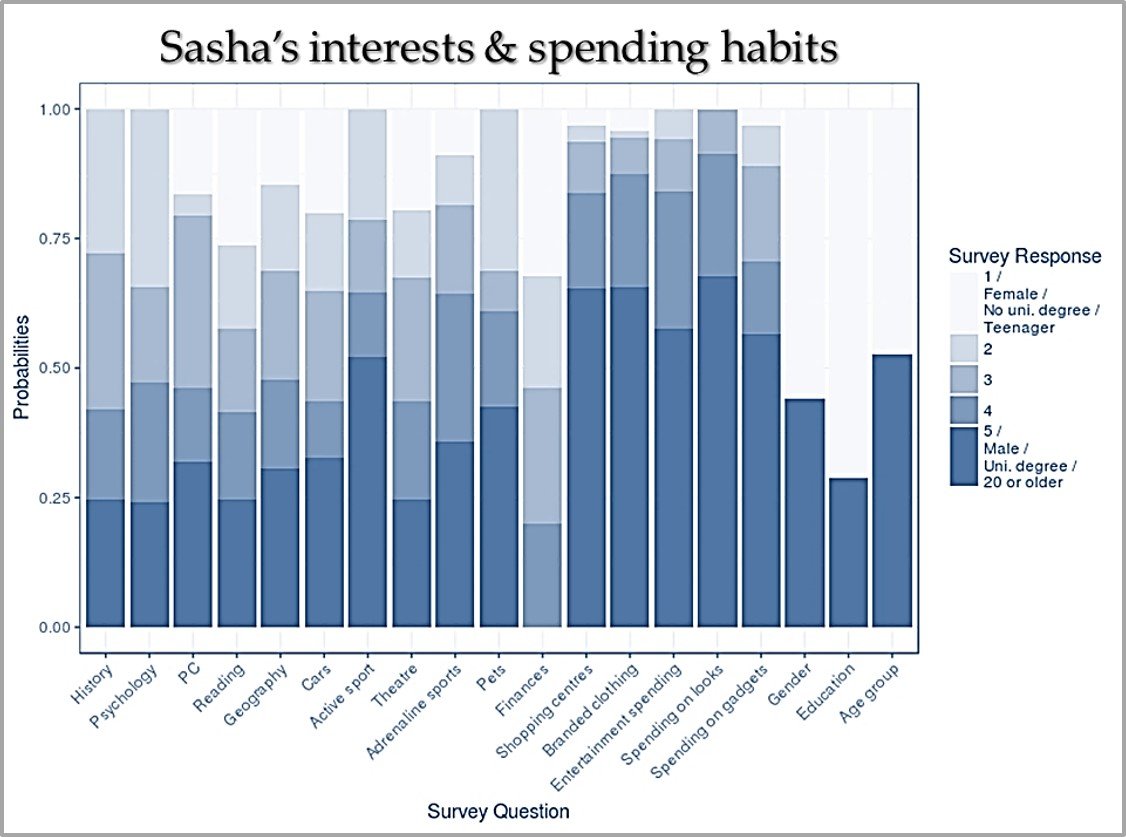
- “Sasha” is younger - the group includes more individuals in their early twenties - and spends freely based on a wide range of enthusiastic interests.
- “Katya” is female and spends selectively. She’s interested in beauty products and name-brand clothes but won’t spring for computers or gadgets.
- “Vlad” is male, typically between the ages of 25 and 35, and tends to be focused on sports and computers. He’s willing to shell out for name-brand clothes, entertainment, and gadgets.
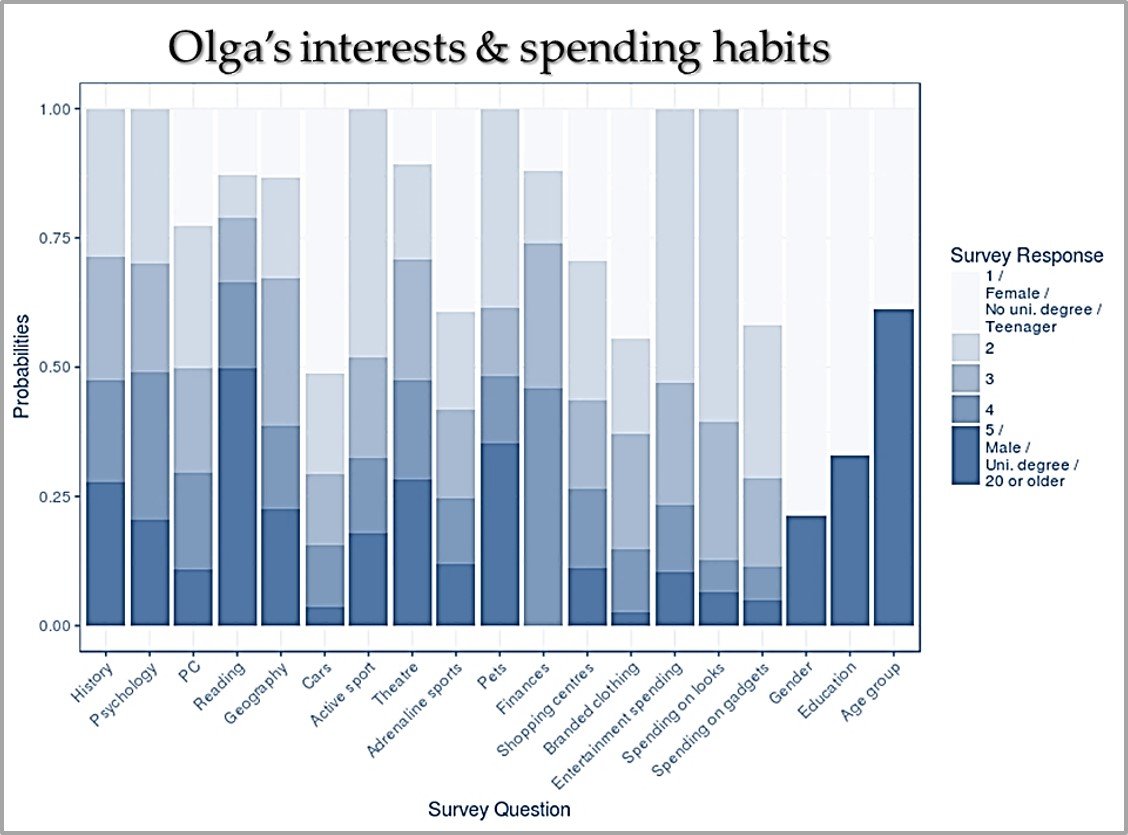
- “Olga” is a careful saver and conservative spender, more interested in prudence than she is excited by new products.

Survey Data
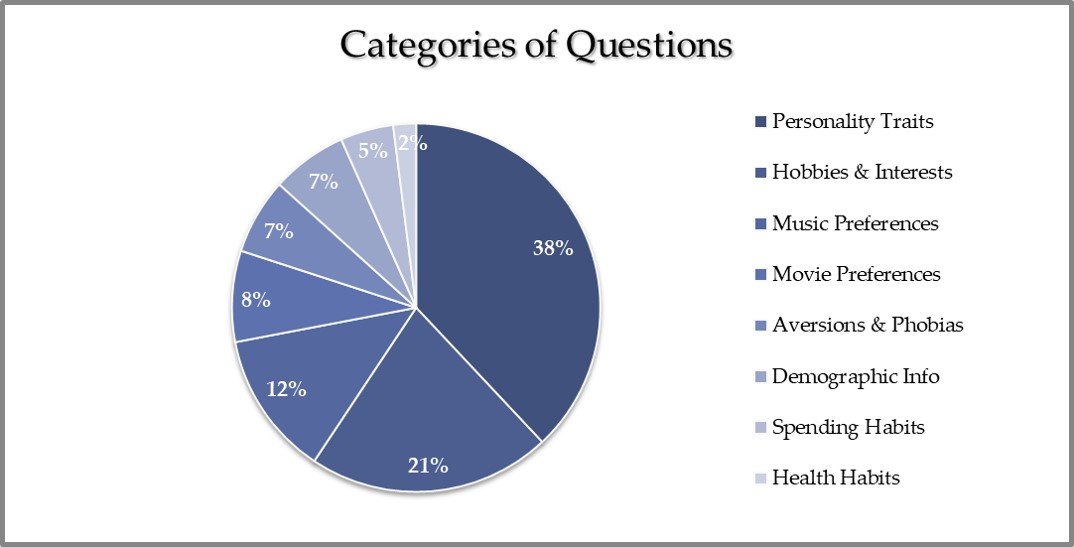
To explore attitudinal and behavioral distinctions among groups of Eastern European millennials, a purpose-appropriate dataset was obtained from the predictive modeling and analytics platform Kaggle. The dataset was generated using a 150-item survey distributed to 1,010 individuals, ranging in age from 20 to 35 (as of 2019), by Eastern European students in a university statistics class. The questions dealt with personality, interests, aversions, demographics, and habits, including spending habits, broken down in the categories shown below.
Pre-Processing
Prior to analyzing the survey data, some pre-processing of the response items was necessary in order to reduce noise and deliver the clearest possible results.The category of “Hobbies & Interests” contained an unwieldy 32 variables (i.e., questions). Of these, only some were of value, namely those that produced some polarization among the participants. We were not interested in hobbies or interests that a vast majority of participants liked or disliked. For this reason, we applied a 30% threshold for both “like” and “dislike” rates, which made the data analysis much more practical and whittled down the list of 32 variables to just 10: Adrenaline Sports, Competitive Sports, Cars, Computers, Geography, History, Pets, Psychology, Reading Poetry, and Theater.
Similarly, while the "Demographic Information" questions reported answers for 10 variables, we included only the 3 most commonly used variables in our analysis: Age Group, Education Level, and Gender.
The "Spending Habits" questions, by contrast, asked about only 6 variables, all of which were included in our study: Appearance/Looks, Branded Clothing, Entertainment, Gadgets, Saving, and Shopping Centers.
The final dataset contained responses from 997 survey participants to the 19 variables listed above. Note that we removed responses from 13 survey participants due to missing or incomplete information.
Model Evaluation
To identify non-obvious relationships among the variables in this dataset, we used R’s poLCA package — a library for Latent Class Analysis (LCA) - to isolate patterns of clustering among the survey respondents.
Here, we generated models assuming that our survey respondents fell into different numbers of latent classes with respect to their spending behavior, ranging from 2 classes to 10.
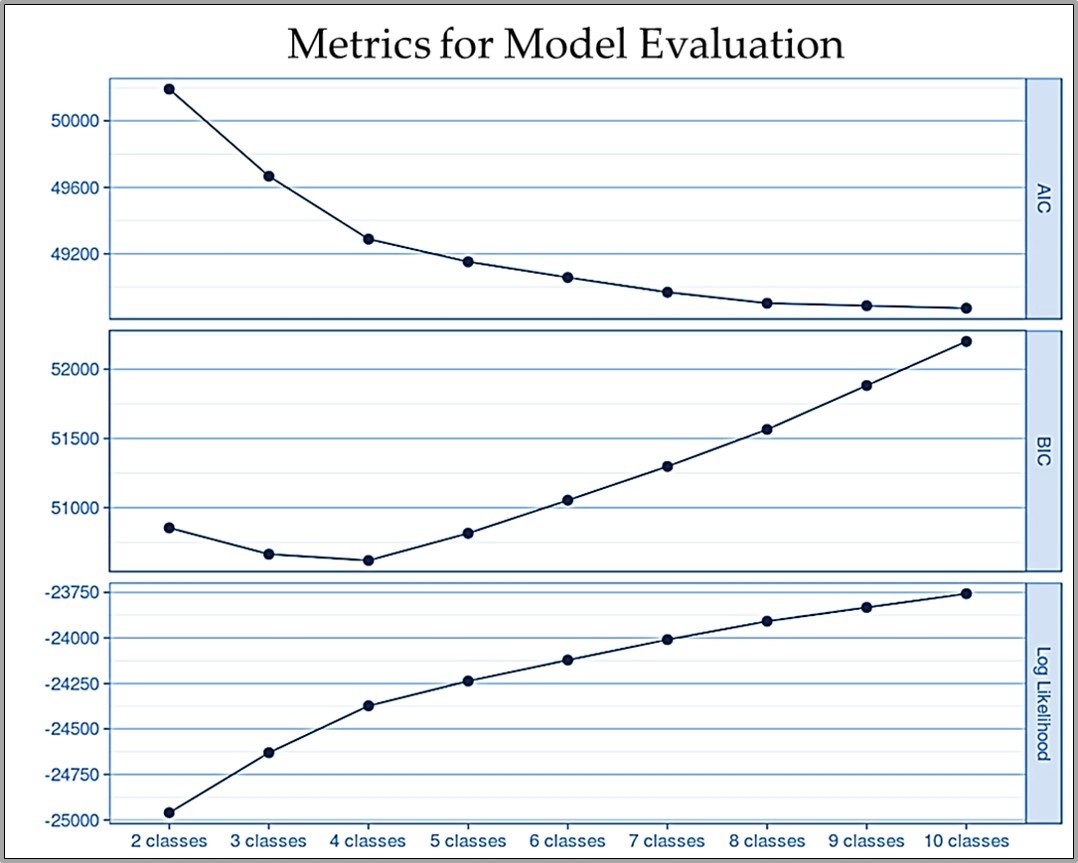
The resulting models were assessed using several measures of information loss, allowing us to gauge the likelihood that a given number of latent classes was the best fit for the available data. The first of these, the Akaike Information Criterion (AIC) decreased as the number of classes increased, appearing to reach its minimum value at 8 classes. In addition, more than 65% of the decrease occurred between 2 and 4 classes.
The second measure was the Bayesian Information Criterion (BIC), which imposes a higher penalty for model complexity than does the AIC. BIC slightly decreased between 2 and 4 classes, and shows a steep, almost linear increase between 4 and 10 classes.
Log likelihood measures the probability that the given number of classes could produce the observed survey results. Here, it increased as the number of classes goes up, although the rate of increase slows with higher numbers. Roughly half of the log likelihood increase occurs between 2 and 4 classes.
Based on these measures, we adopted a 4-class model, which has the best BIC value and beyond which increasing the number of classes does less and less to improve the model.
Latent Class Analysis Results
Each group is defined by demographic characteristics as well as by interests and spending preferences. The groups have here been labelled with names typical of the demographics they represent. The primary traits of each class are given in the main text, and further details are provided in the accompanying figures.
Latent Class 1 “Sasha”. We begin with members of the “Sasha” class of consumer, who are, on the whole, young, active, and have many interests. They are split between men and women almost evenly. About half the class’ members are below the age of 25, and half above. Today, a bit less than three-fifths of them hold a college degree. Sasha’s #1 and #2 interests are competitive sports and adrenaline sports, respectively. Pets are this class’s #3 interest. However, it is important to note here that, in contrast to the other classes, Sasha displays an unusually high investment across all 10 hobby and interest areas. It is therefore to be expected that this class does not save much money. Sasha generally spends the most on items related to looks and appearance and on name-brand clothes, followed by entertainment and gadgets. Members of this class enjoy visiting shopping malls.
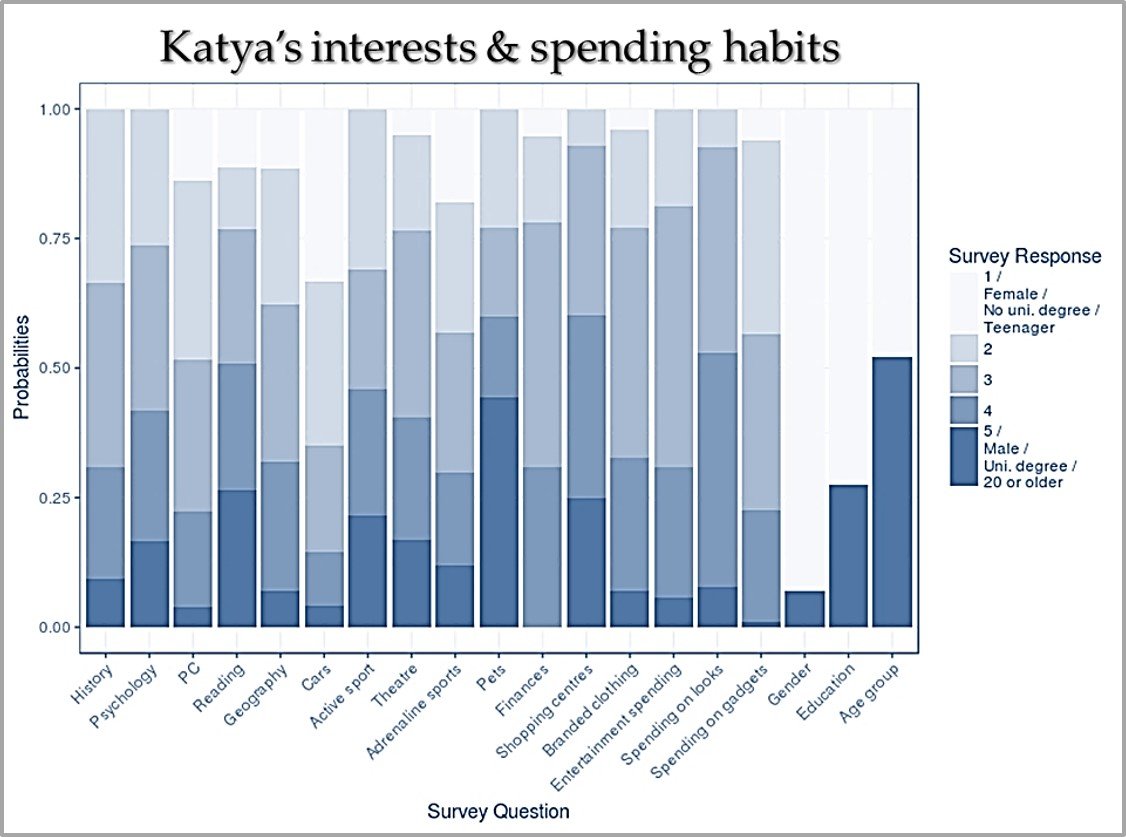
Latent Class 2 “Katya”. Members of the “Katya” class are almost exclusively women. Like Sasha, this class consists primarily of twenty-somethings, with half the members below the age of 25 and half above. Today, a bit less than three-fifths of its members holds a college degree. Pets are Katya’s #1 interest, while reading poetry is her second. Her third is competitive sports. Katya has little to no interest in cars or computers, and only slightly more in studying history and geography. Katya thus takes a relatively neutral view of saving money. She is a less enthusiastic spender than Sasha but is not as careful as Olga. In particular, she is likely to be interested in products and services related to her appearance, and to a lesser degree in name-brand clothes. Her spending on entertainment is middling, and she typically spends as little as possible on gadgets. Members of this class enjoy going to shopping malls.
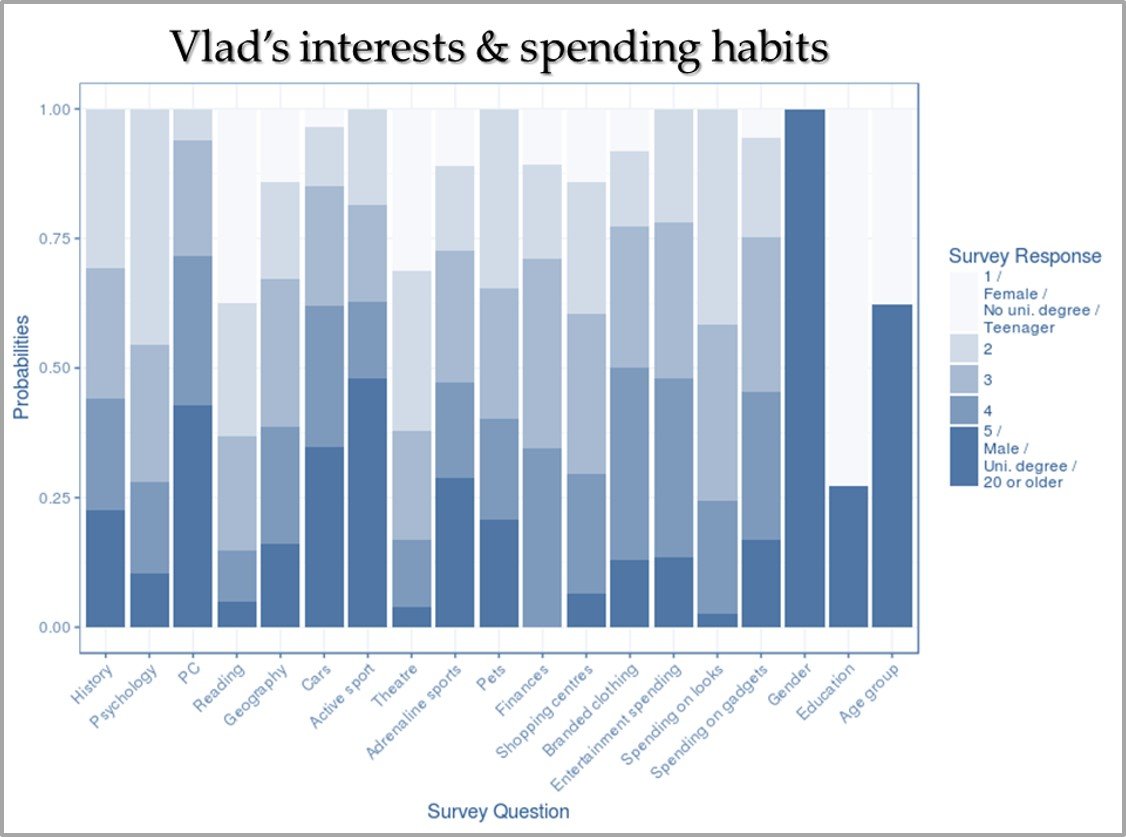
Latent Class 3 “Vlad”. Members of the “Vlad” class of millennial are composed exclusively of men, two thirds of whom are between 25 and 35 years old. Just over half of its members hold a college degree. Computers are Vlad’s #1 interest, and almost three-quarters of the group are interested in computing to some degree. Competitive sports and cars are in a close tie for his second-rated interest, followed by adrenaline sports. Perhaps it is not entirely surprising that Vlad displays almost no interest in reading poetry or going to the theater, and very little in studying psychology. Overall, Vlad - like Katya - holds a neutral view of saving. Both groups are willing to spend only in pursuit of their particular interests. In Vlad’s case, this means being willing to invest in name-brand clothes, entertainment, and gadgets, but spends very little on his appearance. He prefers not to visit shopping malls.
Latent Class 4 “Olga”. Members of the “Olga” class are slightly older and more focused on saving. The majority of members of the class are between the ages of 25 and 35. This group is predominantly composed of women. Today, almost three-fifths of these individuals hold a college degree. Olga’s #1 interest is reading poetry, while pets are her second. Her third is a close tie between going to the theater and studying history. Olga has almost no interest in cars, and very little in computers or adrenaline sports. Olga is a conservative consumer, across the board. Because she believes in saving as much money as possible, she spends only very carefully on name-brand clothes, gadgets, looks, and entertainment. She doesn’t enjoy visiting shopping malls.
Action Options
Marketing to millennials is not easy. They tend to be demanding, difficult to please, and easy to lose. This is doubly true for millennials in Eastern Europe, about whom there has thus far been very little actionable information available. That is no longer the case. While product-specific market research is unavoidable, our research provides marketers with a rough-and-ready understanding of the most dominant spending habits of Eastern European millennials.Perhaps most importantly, it establishes very firmly that this group does break down into several major sub-demographics. This points to both the likely effectiveness of marketing strategies based on these sub-groups and the potential for further analysis of actionable trends among these millennials. In other words: this work provides the jumping-off point for understanding Eastern European millennials that has been missing for so long.
About the author:
Nik Kumar is a Partner at Xaxu Consulting, a boutique strategy consulting firm based in New York serving clients across Retail, E-Commerce, Consumer Packaged Goods, Healthcare and Finance. Mr. Kumar is a Yale MBA with a BS in Computer Science who spent his early career in Management Consulting and Investment Banking.