u.today

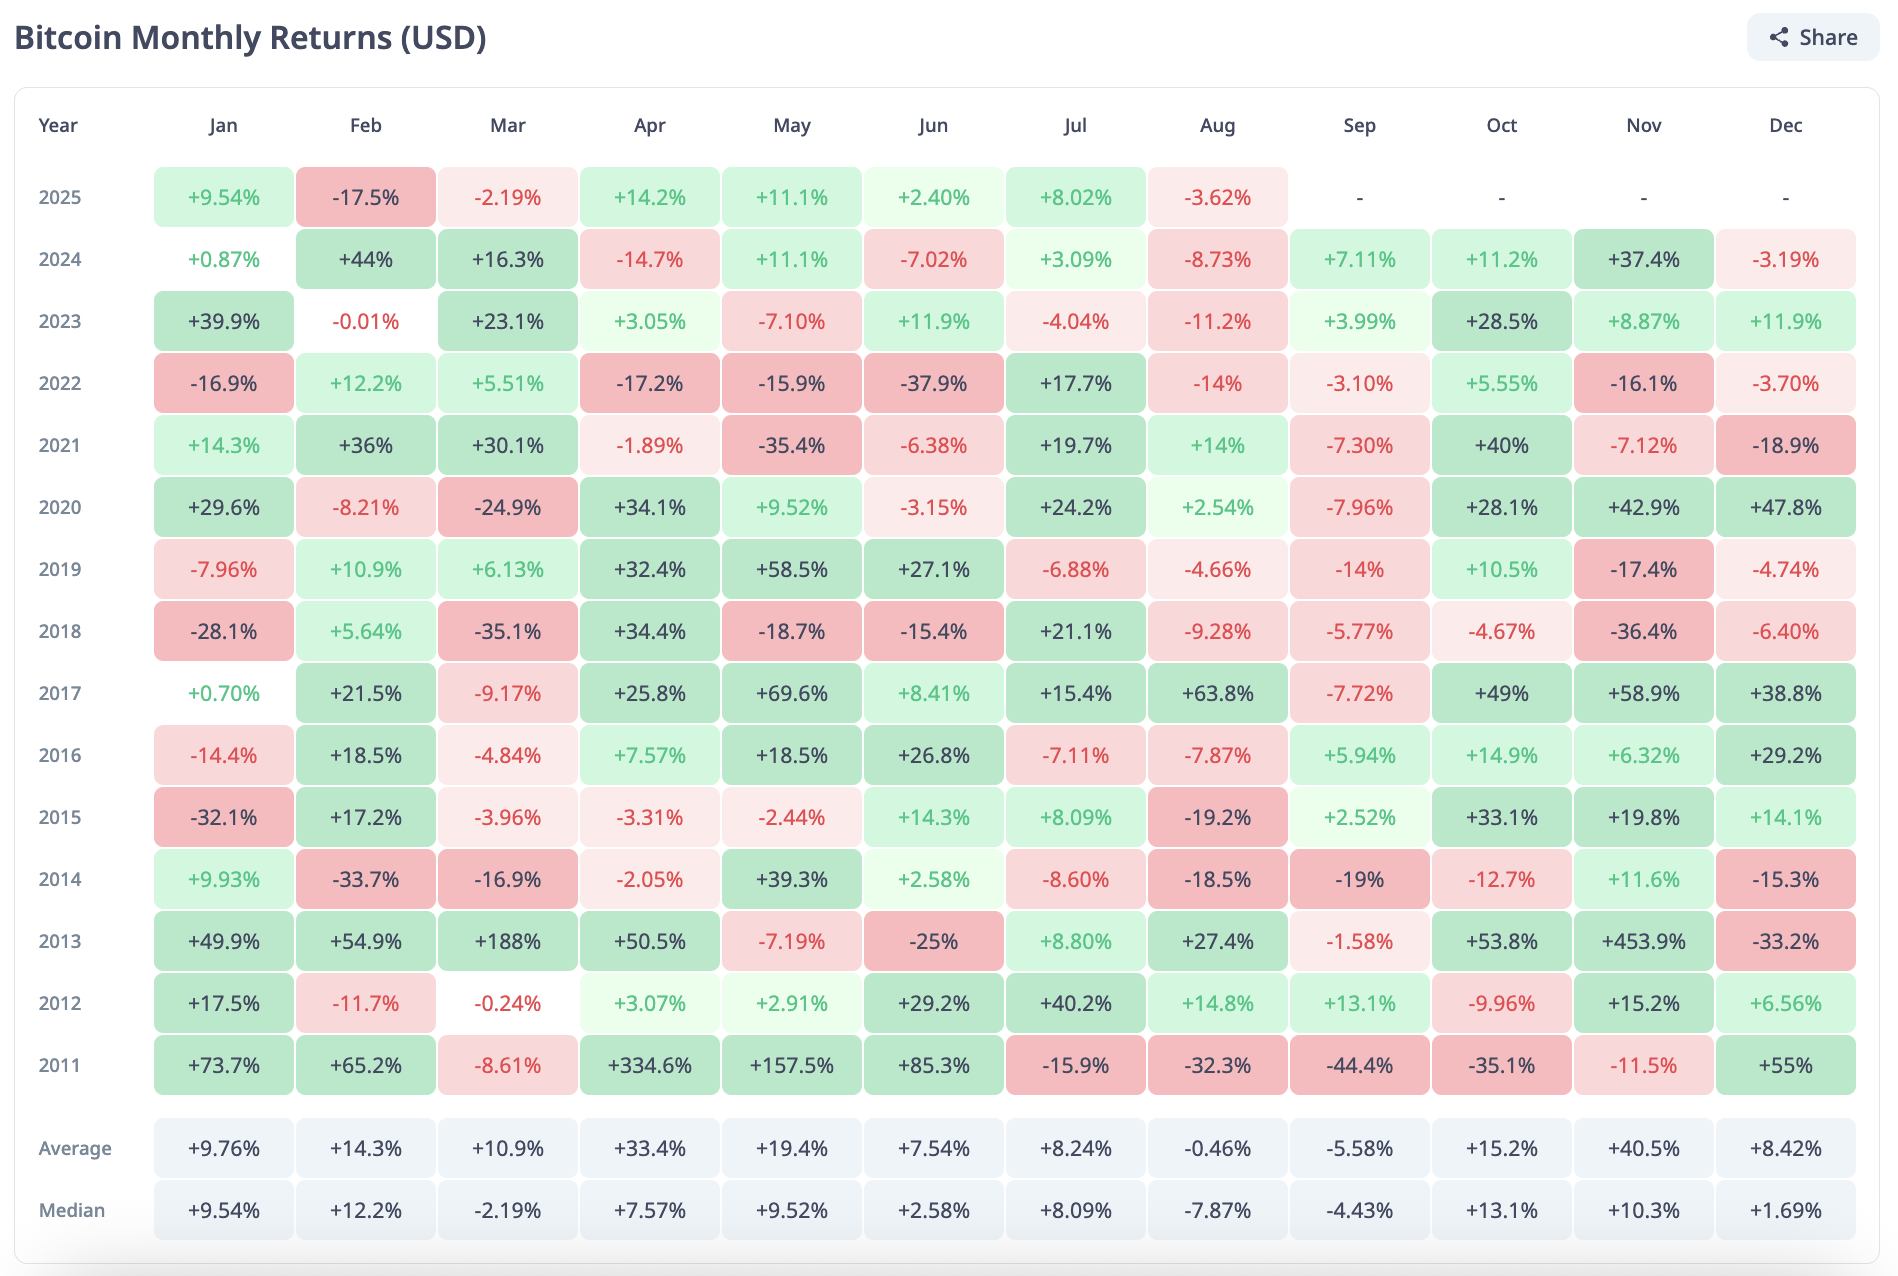
Bitcoin price history leaves little debate — September has almost never been the right month to make optimistic investment decisions with the main cryptocurrency. Across more than a decade of data, this exact month stands out as the weakest point on the calendar, carrying an average return of -5.58% and a median of -4.43%.
Red runs across cycles: bull markets, bear markets, sideways years; September has usually been the setback. Funnily enough, August has been too, so there is a bearish sequence deployed into the price history of Bitcoin.
This is what makes the current $BTC price chart setup harder to ignore. Extending a pullback that began when July’s climb above $120,000 broke down, August is already showing a loss worth 3.9%, and rolling into a month that historically delivers more pain strips another point for those who are bullish.