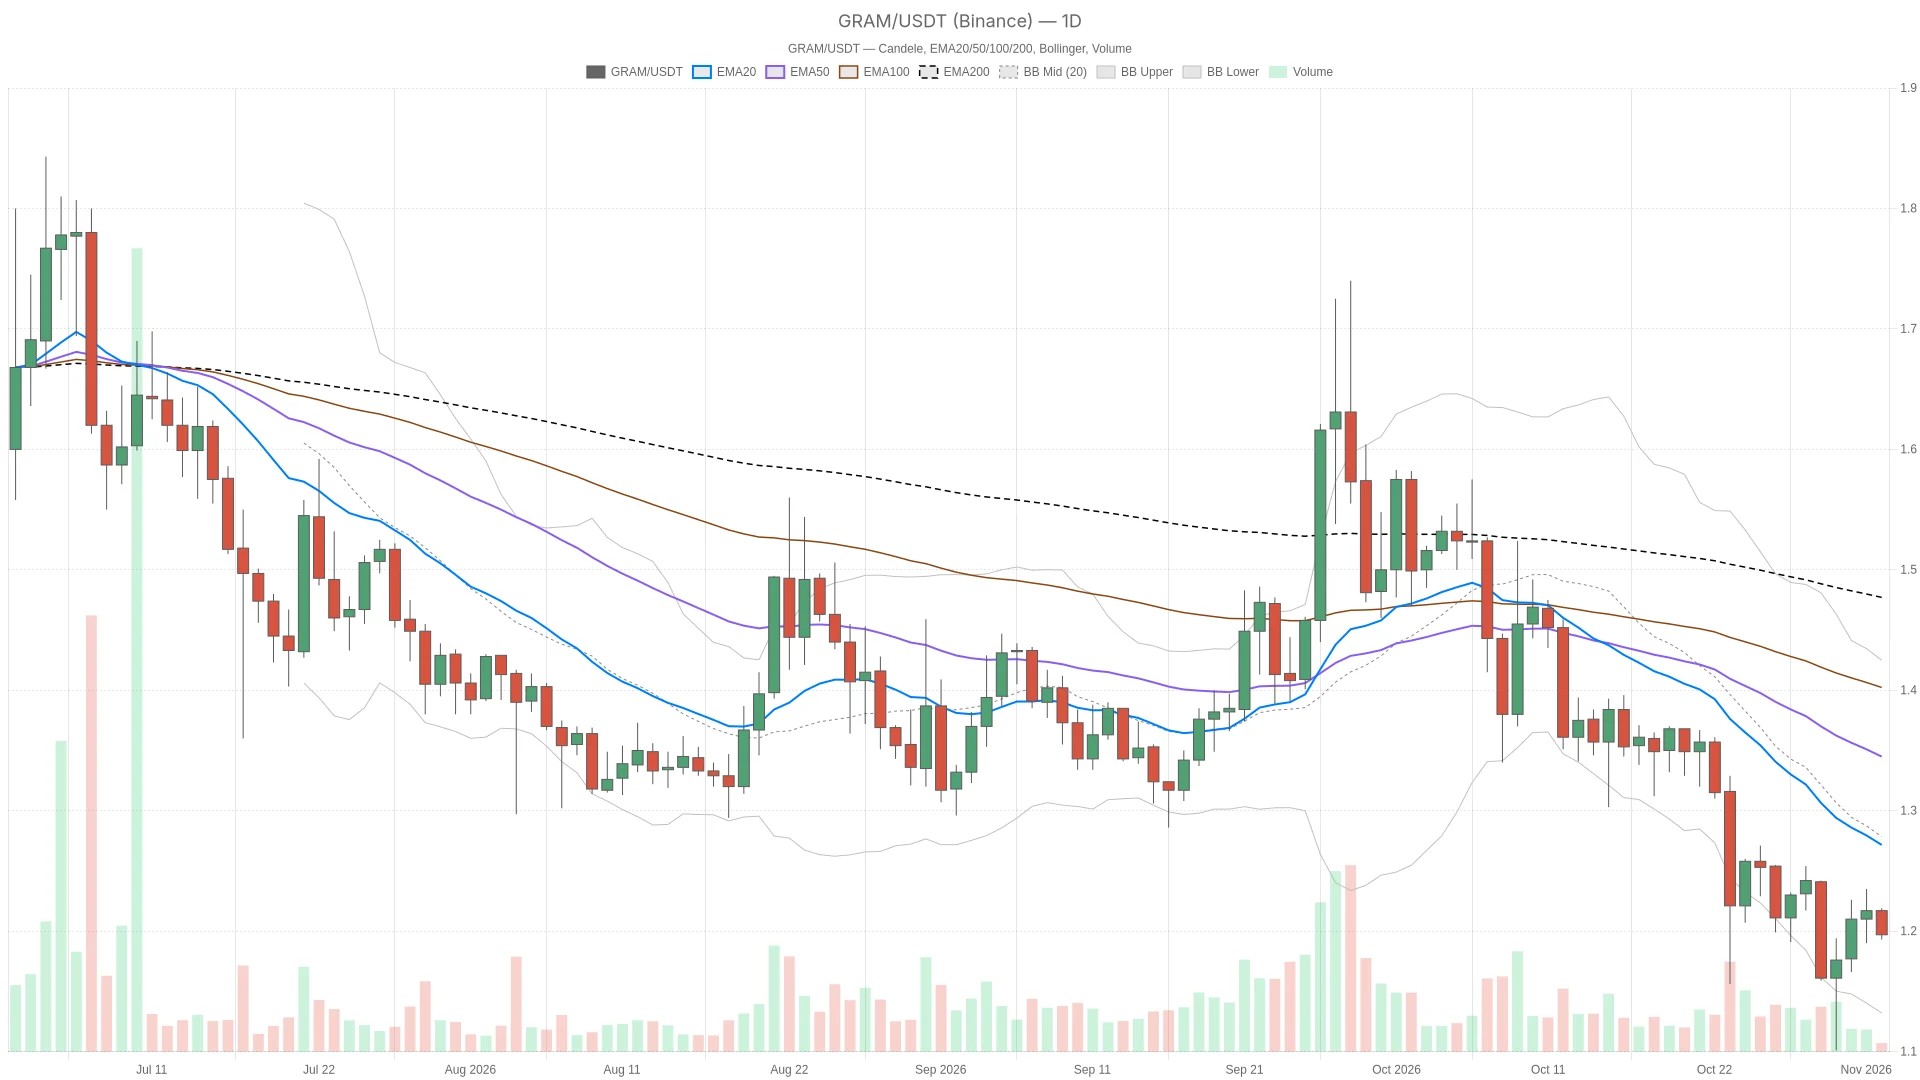
The immediate tension is that shorter-term momentum is weakening rather than supporting that daily improvement. A rebound remains possible, but the current evidence favors treating it as mean reversion within a bearish structure unless nearby resistance gives way.
Gram price recovery signals lack short-term confirmation
Improving daily momentum readings are not backed by shorter timeframes, keeping any recovery attempt unconvincing. The daily chart offers a tentative recovery signal inside an otherwise defensive setup.
Its negative MACD histogram is narrowing and RSI is rising, yet price remains below the daily pivot at $1.21. Improving momentum alone is not enough to establish an upward trend. Moreover, the hourly chart weakens the recovery argument: RSI is falling and price sits below every hourly EMA.
The 15-minute chart also has a bearish EMA alignment and a negative MACD histogram. For execution context, that makes an intraday bounce less convincing than the improving daily readings might imply.
Overhead averages keep rebounds inside a bearish structure
$GRAM trades below its daily EMA20 at $1.28 and EMA50 at $1.35, placing any rebound within a bearish framework until those levels are reclaimed. Binance candle data confirm price remains beneath both averages.
On the hourly chart, price is below the EMA20 and EMA50, both rounded to $1.21, and the EMA200 at $1.22. The averages are not aligned, so this is not a textbook bearish stack. The 15-minute averages, in contrast, are bearishly aligned, with price below the EMA20, EMA50 and EMA200: the clearest downward structure is at the execution horizon.
Additionally, the daily Bollinger Bands span $1.14 to $1.43, with their midpoint at $1.29. Price occupies the lower portion of that envelope, reinforcing the defensive reading without proving that a bounce is due. The hourly lower band at $1.19 provides a nearer reference for downside pressure.
Daily ATR rounds to $0.07, compared with $0.01 hourly. That volatility makes a brief move through a nearby level less persuasive than a completed-candle break. The daily range also leaves room for substantial movement without a broader trend reversal.
Rising daily RSI conflicts with weaker intraday momentum
The daily RSI at 39.4 reflects easing selling pressure rather than emerging buying interest, while falling shorter-term readings keep any bounce vulnerable. Daily RSI is rising, while hourly RSI is falling at 34.8 and 15-minute RSI is falling at 33.1.
None of these readings is oversold. The daily improvement therefore signals less severe weakness, not bullish momentum. Meanwhile, the daily MACD histogram remains negative but is narrowing toward zero.
The hourly histogram is negative, with no directional change established across the supplied readings. On the 15-minute chart, the histogram has crossed below zero and is falling. Together, these signals show an attempted daily stabilization that has not gained intraday backing.
Nearby pivots define the bullish and bearish tests
The hourly close relative to $1.20 and the daily close relative to $1.19 define the immediate bullish and bearish scenarios. The nearest overhead reference is the hourly pivot, followed by hourly R1; both display as $1.20 after rounding.
Below price, the hourly lower Bollinger Band, daily S1 and hourly S1 each round to $1.19. These are distinct underlying levels, not exact coincidences; two-decimal display precision compresses the immediate trading range.
Bullish scenario: An hourly close above hourly R1 at $1.20 would strengthen the rebound case, bringing the hourly EMA50 at $1.21 into view. An hourly close below hourly S1 at $1.19 would invalidate that recovery setup. The likeliest false bullish signal is a brief push through the hourly pivot that fails before establishing acceptance above hourly R1.
Bearish scenario: A daily close below daily S1 at $1.19 would confirm a support failure and expose the daily lower Bollinger Band at $1.14. A daily close above the daily pivot at $1.21 would invalidate that breakdown setup. A temporary dip beneath support followed by a recovery before the daily close would instead be a false breakdown, particularly with daily downside momentum already easing.
Fear readings provide a defensive market backdrop
The Fear & Greed Index at 37 and Bitcoin dominance of 59.95% reflect a cautious market environment that aligns with $GRAM’s defensive positioning. Alternative.me’s Fear & Greed Index stands at 37, classified as Fear.
CoinGecko reports total crypto market capitalization of $2,602,587,989,343.18 and Bitcoin dominance of 59.95%. Sentiment is defensive, but these broader readings do not establish a cause for $GRAM’s price action or override its own confirmation levels.
FAQ
Is $GRAM oversold?
No. The supplied daily, hourly and 15-minute RSI readings are all above the oversold threshold.
Why do nearby levels display the same price?
Rounding dollar levels to two decimals compresses several distinct hourly references. Their timeframe and level names distinguish them; identical displayed prices do not establish exact technical confluence.
Disclaimer: This article is for informational purposes only and does not constitute financial advice, an investment recommendation, or a solicitation to buy or sell any financial instrument or cryptocurrency. The analysis provided is not indicative of future results. Investing in crypto assets and financial markets carries a high risk of capital loss. Always do your own research (DYOR) and consult a qualified financial advisor before making any decision.
Article produced with the assistance of artificial intelligence and reviewed by the editorial team.

 en.cryptonomist.ch