Beam Price Prediction: BEAM Faces Selling Pressure as Open Interest Surges
coinedition.com
21 h
Beam ($BEAM) faces renewed selling pressure after a strong weekly rally pushed its price toward $0.0063. The token traded around $0.005035 on November 2, recording a 13.19% decline over 24 hours. However, $BEAM still maintains a 58.90% gain over the past seven days. Its daily trading volume reached $131.63 million, while its market capitalization stood at approximately $252 million.
$BEAM Rally Loses Momentum as Sellers Target Key Support
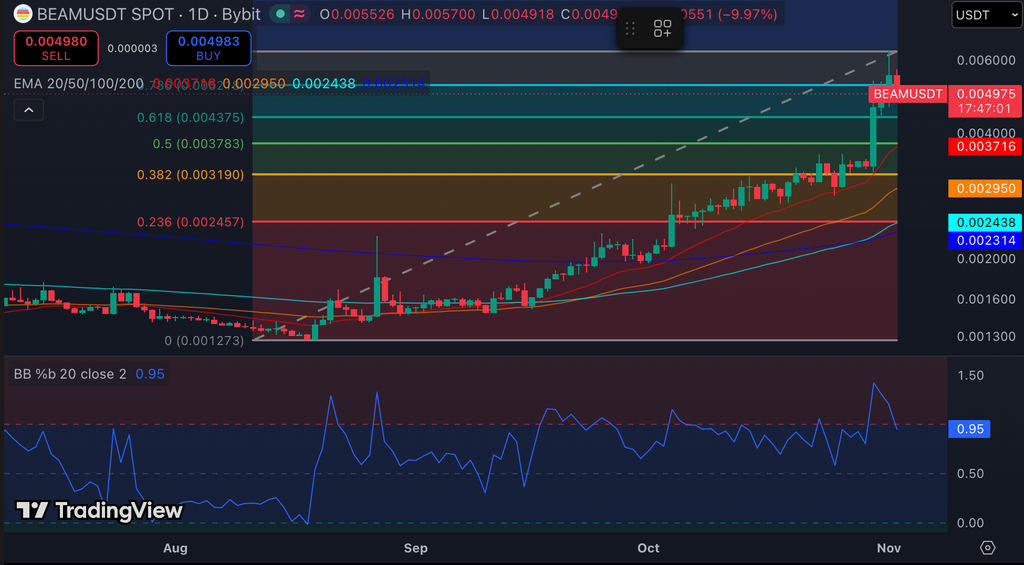
$BEAM’s latest decline follows an impressive recovery from its August low of $0.001273. The token established successive higher highs and higher lows before approaching $0.0063. However, sellers recently challenged that upward momentum, pushing the price below $0.0052.
The $0.0052 region now represents an important resistance level. This area aligns with the 0.786 Fibonacci retracement, making it a significant recovery barrier. Consequently, buyers need to reclaim this level before attempting another move higher.
Know when your coins move
Alerts, real-time prices, and market news — all in one app
Point your phone camera to install
4.8 based on 40K reviews in the App Store and Google Play
A successful breakout could expose $0.0057 as the next upside target. Beyond that level, $BEAM could revisit its recent peak around $0.0063. Such a move would suggest that buyers have regained control following the correction.
$BEAM Price Dynamics (Source: TradingView)
However, continued selling could bring $0.004375 into focus. This level represents the 0.618 Fibonacci retracement and offers the first major support. A breakdown could expose the $0.00378-0.00372 region.
That area combines the 0.5 Fibonacci level with the 20-day EMA. Besides, the daily chart shows $BEAM trading above its 20-, 50-, 100-, and 200-day EMAs. Their bullish arrangement suggests that the broader recovery remains intact.
Related: Bitcoin Price Prediction November 2026: Can BTC Reclaim $80,225 as ETF Flows Turn Negative?
The Bollinger %B indicator has also retreated to 0.95 after previously exceeding 1. This movement indicates that $BEAM has returned inside its upper Bollinger Band. Nevertheless, it does not independently confirm a bearish reversal.
Open Interest Surge Signals Growing Market Exposure
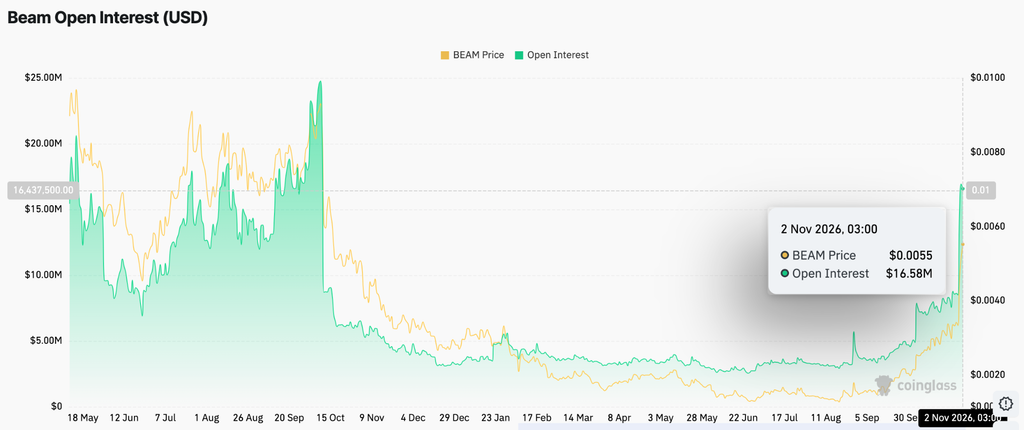
$BEAM’s derivatives market has experienced a significant increase in trading activity. Open interest climbed to $16.58 million as the token approached $0.0055. This represents a substantial increase from its previous $3 million–$4 million range.
Moreover, the latest reading brings open interest closer to its October 2025 peak. That previous high stood near $25 million.
Source: Coinglass
The increase suggests traders have opened additional derivatives positions during $BEAM’s recent rally. However, rising open interest does not reveal whether traders favor bullish or bearish positions.
Consequently, the growing exposure could amplify volatility during the next significant price movement. A sharp reversal could trigger liquidations if heavily leveraged traders face unfavorable conditions.
Exchange Outflows Offer a Potentially Positive Signal
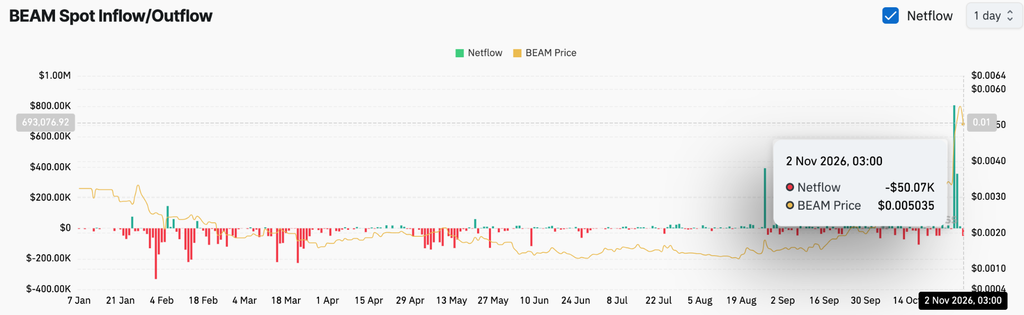
Exchange flow data presents another development worth monitoring. $BEAM recorded approximately $50,070 in net exchange outflows on November 2.
Source: Coinglass
This development followed a substantial inflow surge during the recent rally. Net inflows previously approached $800,000, potentially increasing the tokens available for exchange trading.
Significantly, the latest reversal suggests more $BEAM tokens left exchanges than entered them. Sustained withdrawals could reduce immediately available selling supply.
Technical Outlook For Beam ($BEAM) Price
Key levels remain well-defined as $BEAM navigates its latest correction:
Upside levels: $0.0052 represents the immediate resistance. A breakout could open the way toward $0.0057 and the recent high of $0.0063.
Downside levels: $0.004375 (0.618 Fibonacci) is the first major support, followed by the $0.00378-0.00372 zone, where Fibonacci support aligns with the 20-day EMA.
Trend support: The 20-day EMA at $0.003716 remains an important level for preserving the broader bullish structure. $BEAM continues trading above its 20-, 50-, 100-, and 200-day EMAs.
Market signals: Open interest has climbed to $16.58 million, approaching its previous $25 million peak. Meanwhile, exchange netflows recorded an outflow of $50,070, suggesting reduced exchange supply.
Will Beam Price Go Up?
$BEAM’s price prediction hinges on whether buyers can defend $0.004375 and regain momentum above $0.0052. Rising open interest indicates increased derivatives participation, while recent exchange outflows could provide additional support. If bullish momentum returns, $BEAM could revisit $0.0057 and potentially challenge $0.0063.
Related: MEET48 Price Prediction: Can a 208% Weekly Rally Push IDOL Toward $0.030?
However, failure to maintain the $0.004375 support could expose the $0.00378-0.00372 region. A sustained breakdown below this area would weaken the bullish structure and increase downside risks. For now, $BEAM remains at a critical turning point. Derivatives positioning, exchange flows, and confirmation from the daily chart will likely determine its next major move.

 coinedition.com