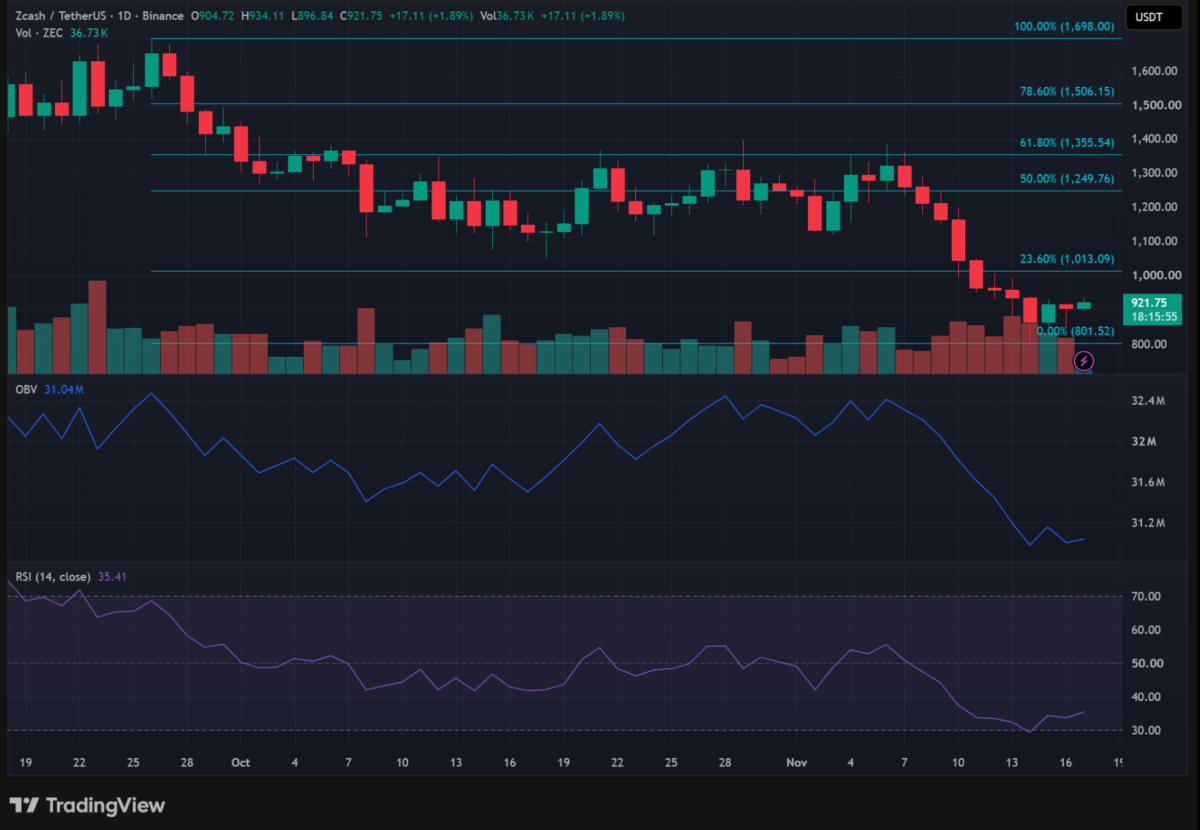
On the daily chart, bulls have started fighting back as short-term momentum picks up. At the time of writing, $ZEC traded at $921.75, remaining within the lowest Fibonacci retracement band. This indicated that the recovery was still weak and left the broader bearish structure intact.
OBV showed a modest uptick after its sharp decline, while the RSI climbed to 35.41, suggesting selling pressure had eased but not enough for buyers to gain the upper hand in the market.
Zcash approaches a key H4 resistance level
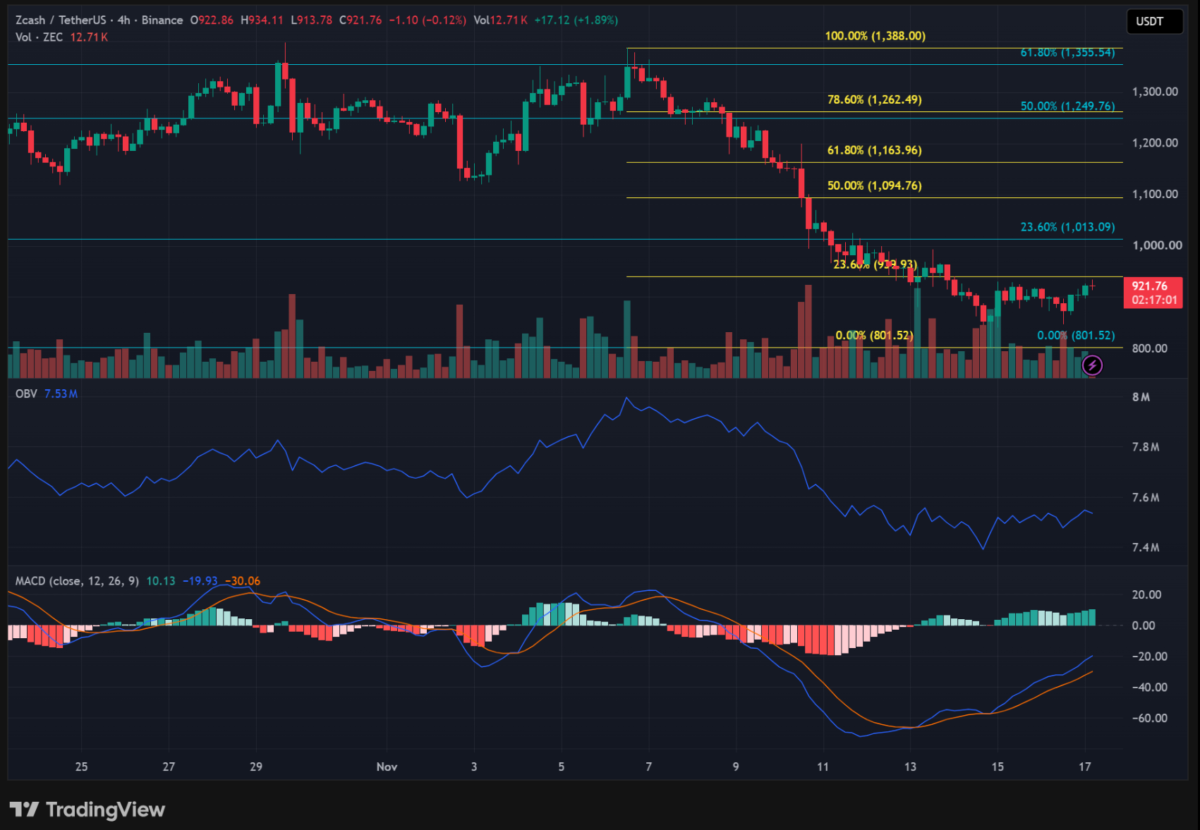
The H4 chart offered a closer look at the token’s recent recovery, with $ZEC trending towards the 23.6% Fibonacci level at $939.93. If the bulls can successfully break above this resistance, it would strengthen the bullish case and bring the daily $1,013 level into focus.
The MACD turned positive, while OBV began to stabilize after its steep decline. However, the lack of a stronger OBV recovery suggests buying volume has yet to fully support the improving momentum.
Final Summary
- Zcash’s short-term recovery is gaining traction, but the daily chart shows that the broader bearish structure remains intact.
- Holding above $906 and breaking the $939-$940 resistance could open the way towards $945-$971.

 ambcrypto.com