XRP Price Sinks to $0.86 With Leveraged Bulls Gone
crypto-news-flash.com
27 m
The $XRP price fell to its lowest level since at least July before buyers recovered part of the drop.
Futures traders have pulled more than half of their capital from $XRP contracts since late September.
Leveraged buyers paid to keep their positions through most of the decline.
The daily chart is oversold, but price still trades below both main moving averages.
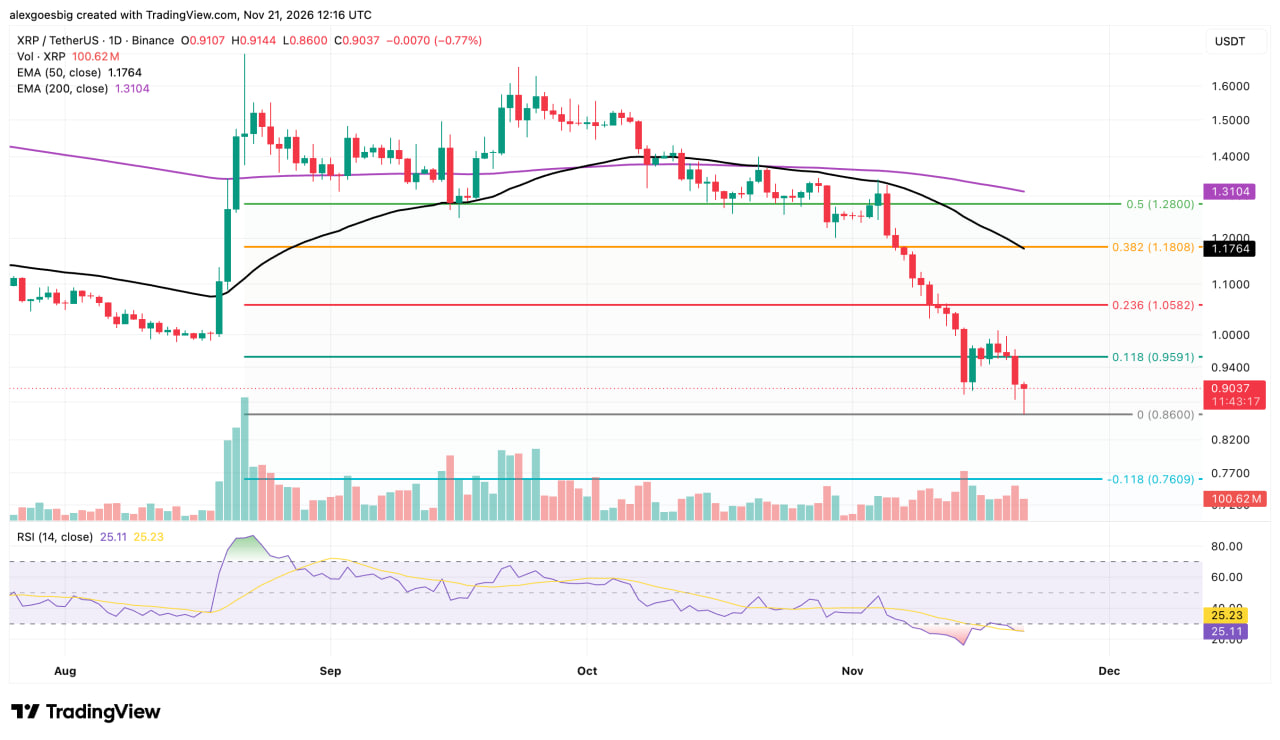
Futures traders have taken about $2.1B out of $XRP contracts since late September, and on Saturday, November 21, the $XRP price followed them down to $0.86 on Binance before it recovered to roughly $0.904. That intraday low is $XRP’s weakest level since at least July and leaves the token about 47% below its late-August peak near $1.70. Derivatives data from CoinGlass shows that most of the leverage behind the autumn trading range has now been cleared, so the next move is likely to depend more on spot buyers and sellers than on forced liquidations.
$XRP/USDT daily technical analysis. Chart: TradingView / Alexander Stefanov.
Know when your coins move
Alerts, real-time prices, and market news — all in one app
Point your phone camera to install
4.8 based on 40K reviews in the App Store and Google Play
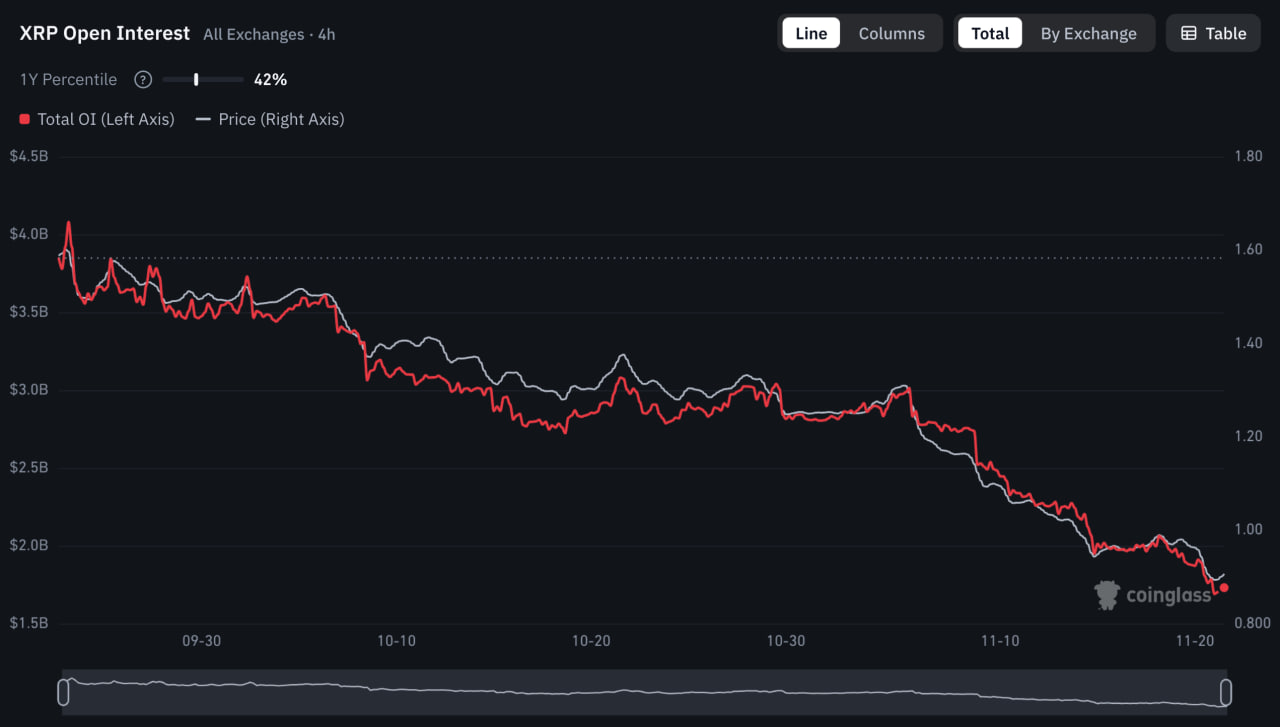
Open Interest Lost $2.1 Billion
Total $XRP open interest across all exchanges stood at $1.73B on Saturday afternoon, 7.9% lower than a day earlier and about 55% below the $3.84B recorded at the end of September. Open interest is the combined value of futures and perpetual contracts that are still open, so a decline this deep means positions closed far faster than new ones appeared.
$XRP open interest, all exchanges. Source: CoinGlass
Some of that drop simply reflects the falling price, because each open contract is worth less in dollars when the $XRP price declines. Measured in tokens, open interest fell from about 2.4 billion $XRP to around 1.9 billion, a reduction of roughly a fifth that still shows traders leaving the market in meaningful numbers.
Longs Kept Paying Through the Slide
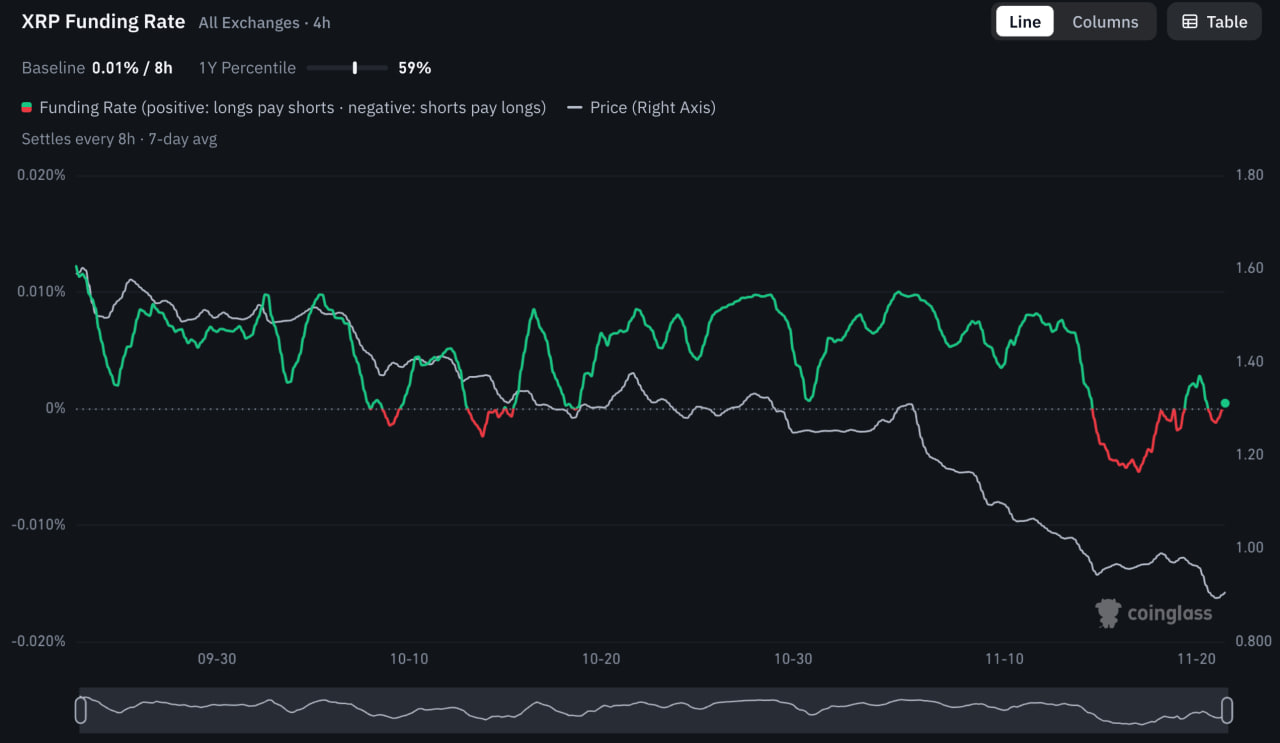
Funding rates show which side of the market is under pressure. In a decline led by short sellers, open interest normally climbs as new bearish bets open, and funding turns negative because shorts pay longs to keep their positions. $XRP moved the other way, as CoinGlass shows funding stayed positive 81% of the time since late September at an average of 0.0048% per eight hours, or about 5.2% a year. Buyers using borrowed money kept paying that fee while the $XRP price kept falling, and most of them have now gone.
The seven-day average funding rate has dropped to 0.0005%, which works out to just 0.54% a year and a twentieth of the 0.01% baseline exchanges charge when demand from longs and shorts is balanced. Open interest fell 7.9% on the same day $XRP touched $0.86, which fits a final wave of long liquidations, though CoinGlass data cannot show how many of those exits were forced.
Saturday’s Wick Drew Real Buyers
The taker buy/sell ratio compares market orders that hit the ask with those that hit the bid, so it shows which side is acting with urgency. Since late September, sellers led 77% of the time, with an average reading of 0.96. On Saturday, buyers accounted for 56.5% of taker volume and pushed the daily ratio to 1.30, the kind of demand that turned the drop to $0.86 into a long lower wick on the daily candle. The latest four-hour reading slipped back to 0.95 once the $XRP price climbed back above $0.90.
$XRP futures
Late Sept → Nov 21
Change
Open interest ($)
$3.84B → $1.73B
▼ 55%
Open interest ($XRP)
~2.4B → ~1.9B
▼ ~20%
Funding, annualized
5.2% avg → 0.54%
▼ ~90%
Taker buy/sell (7-day)
0.96 avg → 1.003
▲ back to balance
Source: CoinGlass, all exchanges, Nov 21, 2026.
$0.96 Has Turned Into a Ceiling
The Fibonacci grid on the daily chart runs from the late-August high near $1.70 to Saturday’s low, so $0.86 marks both the bottom of the grid and the nearest support, about 4.8% below the current price. A daily close under it would bring the -0.118 extension at $0.7609 into play, a level that projects the August-November swing below its low and sits roughly 15.8% beneath current trading.
Overhead, the 0.118 retracement at $0.9591 changed roles on Friday. $XRP had traded around it since November 14, but the daily candle closed below it, and traders who bought near that level often sell into the first retest to get out at breakeven. Further up, the $1.00 area capped the mid-November rebound, and the 0.236 level waits at $1.0582.
The Last Oversold Bounce Died at $1
The 14-day RSI stands at 25.11, under the 30 line that marks oversold conditions. That reading means the losses of the past two weeks have heavily outweighed the gains, and in the past this has often been followed by at least a pause in selling. The indicator is still slightly below its own average of 25.23, though, so momentum has not turned up yet.
$XRP was in the same position barely a week ago. Around November 13 the RSI sank close to 17, and the $XRP price bounced from about $0.88 to just over $1.00 before giving back the whole move within days. Both main trend lines remain far away, with the 50-day exponential moving average at $1.1764, about 23% above the price, and the 200-day EMA at $1.3104, roughly 31% higher.
Negative Funding Would Set Up a Squeeze
With leverage already flushed, a break below $0.86 would rely mostly on spot holders choosing to sell. Declines like that usually unfold more slowly than liquidation cascades, but they also leave fewer short positions to buy back and power a sharp recovery.
The next change in positioning should show up in the derivatives data before it reaches the chart. If open interest starts rising while funding turns negative, traders are shorting an oversold market, and a push in the $XRP price toward $0.9591 could force them to cover in a hurry. If open interest rises while funding climbs back toward 0.01%, leveraged buyers are returning before $XRP has set a higher low, which is the same positioning that preceded the November decline.
The moving averages add a timing problem for any recovery. The 50-day EMA fell below the 200-day EMA in October, a crossover traders call a death cross, and the gap has since widened to about $0.13. While the $XRP price stays under $1.18, the 50-day average will keep falling simply because each new daily close is lower than the average, so the first real test of that line may come well below its current level.

 crypto-news-flash.com