Zcash Price Analysis: ZEC Risks Bearish Breaker Block Rejection and Drop Toward $854
coinedition.com
21 m
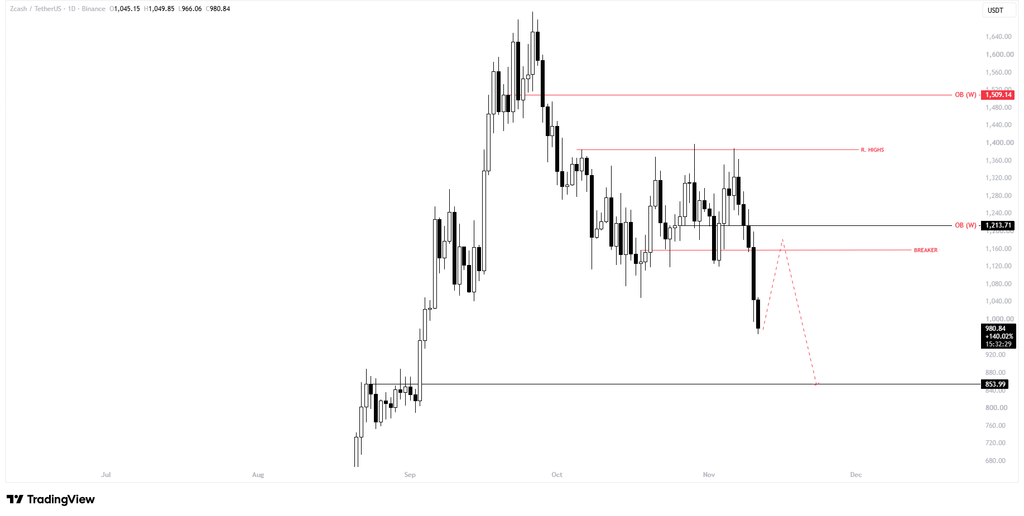
Zcash fell sharply after losing a key trading zone, putting the $1,158 resistance area at the center of its next technical test. For $ZEC, the price analysis identifies $853.99 as a conditional downside objective, not a confirmed destination.
Indicator
Reported Value
November 11 Price
$980
November 10 Decline
10.2%
Daily RSI
37
Four-Hour RSI
23.3
Bearish Breaker
$1,158
Downside Target
$853.99
Zcash Price Breakdown Puts $1,158 Breaker and $854 in Focus
Zcash retreated from above $1,380 on November 6 and closed November 10 near $1,046, a reported daily loss of 10.2%. On November 11, CoinGlass showed $ZEC near $980, with an intraday low around $961.
Know when your coins move
Alerts, real-time prices, and market news — all in one app
Point your phone camera to install
4.8 based on 40K reviews in the App Store and Google Play
The slide placed prices below $1,158, now treated as a bearish breaker. In this price analysis, that level represents resistance where a recovery faces renewed selling pressure. Before reaching $1,158, $ZEC would encounter resistance around $1,073 and $1,130.
Source: TradingView
$ZEC Faces $1,213 Resistance as Sellers Target $853.99
Zcash price analysis further identifies $1,213.71 as a higher resistance beyond the breaker. Historical data showed a November 8 close near $1,213, but the weekly order-block designation needs chart confirmation.
A sustained close above $1,158, followed by a move through $1,213.71, would weaken the bearish setup. By contrast, a brief move above resistance without follow-through would leave the risk of a bull trap. The bearish price analysis instead tracks support at $948.58 and $868.22 before $853.99.
Measured from $1,158, that final level represents approximately 26.3% downside. These are, however, conditional chart levels, not confirmed zones. For $ZEC, the distinction matters as oversold readings alone do not demonstrate that buyers have regained control.
Follow us onXfor real-time crypto updates.
Bitcoin Weakness and $40M Liquidations Pressure Zcash
Zcash price analysis comes amid broader cryptocurrency market weakness, as Bitcoin slipped below $74,000 following a hotter-than-expected U.S. inflation report. According to the Bureau of Labor Statistics, headline inflation rose 0.4% in October, exceeding the 0.3% forecast.
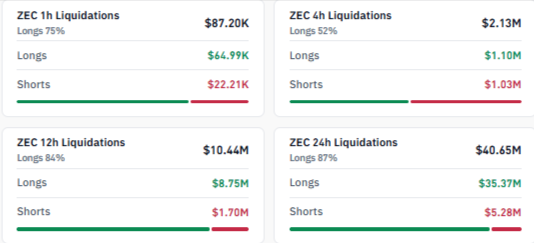
Meanwhile, core inflation increased 0.3%, above expectations of 0.2%, as Treasury yields and the U.S. dollar strengthened. Against this backdrop, selling pressure extended into the cryptocurrency derivatives market. CoinGlass reported approximately $40 million in $ZEC liquidations over 24 hours, with long positions accounting for most of the losses.
Source: CoinGlass
That imbalance reflected heavy pressure on leveraged bullish trades. The price analysis therefore centers on whether Zcash can reclaim $1,158 and hold above it. Until that confirmation appears, $853.99 remains the stated downside target for the rejection scenario.
Key $ZEC Support and Resistance Levels
Price Level
Technical Significance
$1,213.71
Higher resistance
$1,158
Bearish breaker
$1,130
Intermediate resistance
$1,073
Initial recovery resistance
$948.58
Immediate support
$868.22
Secondary support
$853.99
Bearish downside target
Bearish Case
Rejection at $1,158 would preserve bearish pressure, exposing $948.58 and $868.22 before the $853.99 downside target.
Bullish Case
Sustained recovery above $1,158 and $1,213.71 would weaken the bearish structure and signal improving buying momentum.
FAQs
1. Why Is $1,158 Important?
It represents a bearish breaker where renewed selling could emerge.
2. What Is $ZEC’s Downside Target?
The identified bearish objective stands at $853.99.
3. Is Zcash Oversold?
The four-hour RSI near 23.3 indicates oversold conditions.
4. What Would Invalidate the Bearish Setup?
A sustained reclaim above $1,158 and $1,213.71 would weaken it.
Related: Ethereum Price Analysis: $2K Weekly Liquidity Sweep Could Spark a $3.7K Rally

 coinedition.com