
 crypto.news

Hyperliquid price traded near $81 on Sept. 2 after retreating from its $86.71 all-time high, with technical indicators showing that $HYPE’s wider uptrend remains intact despite fading short-term momentum.
Hyperliquid price consolidates below record high
According to data from crypto.news, Hyperliquid ($HYPE) price was trading around $81.14 at the time of writing, down 2% on the daily candle. The token has fallen roughly 6.4% from the record high of $86.71 reached on Aug. 27 but remains well above its mid-August breakout area.
The daily chart shows $HYPE consolidating between approximately $80 and $85 after a steep rally from the $55–$60 region. Buyers have repeatedly defended the lower end of that range, while attempts to hold above $84 have met fresh selling.
$HYPE has outperformed several large-cap crypto assets during the wider market pullback. Its relative strength follows a rally that accelerated after the token cleared its June and July resistance zones around $75.
The latest retreat has not yet broken the wider bullish market structure. $HYPE continues to form higher highs and higher lows on the daily chart, although the narrow trading range near its peak points to hesitation among buyers.
Treasury expansion supports the $HYPE narrative
The consolidation follows Hyperliquid Strategies’ decision to increase the limit of its equity purchase facility with Chardan Capital Markets from $1 billion to $2.5 billion.
According to the company’s financing terms, proceeds may be used for general corporate purposes and additional $HYPE purchases. The larger facility gives the Nasdaq-listed company more capacity to expand its token treasury, but it does not mean the entire $2.5 billion will immediately enter the $HYPE spot market.
Hyperliquid Strategies previously reported holding 29.3 million $HYPE at the end of its 2026 fiscal year, up from an initial treasury position of 12.5 million tokens. Its balance sheet contained about $1.9 billion in $HYPE holdings as of June 30.
Supply remains the main counterweight to the treasury demand narrative. A scheduled Aug. 29 release involved approximately 14.18 million $HYPE, or 1.4% of maximum supply, according to token-unlock data. The batch was valued near $1.2 billion when $HYPE traded close to its record high.
$HYPE remained above $80 after the release, suggesting that the added supply did not produce an immediate breakdown. Unlocks do not necessarily translate into direct selling, however, and future distributions could continue to create volatility around vesting dates.
$HYPE technical setup remains bullish above $79
On the 4-hour chart, $HYPE remains above the Supertrend indicator at $78.98. Holding that level would preserve the short-term bullish signal and keep the $84–$86.71 resistance region within reach.
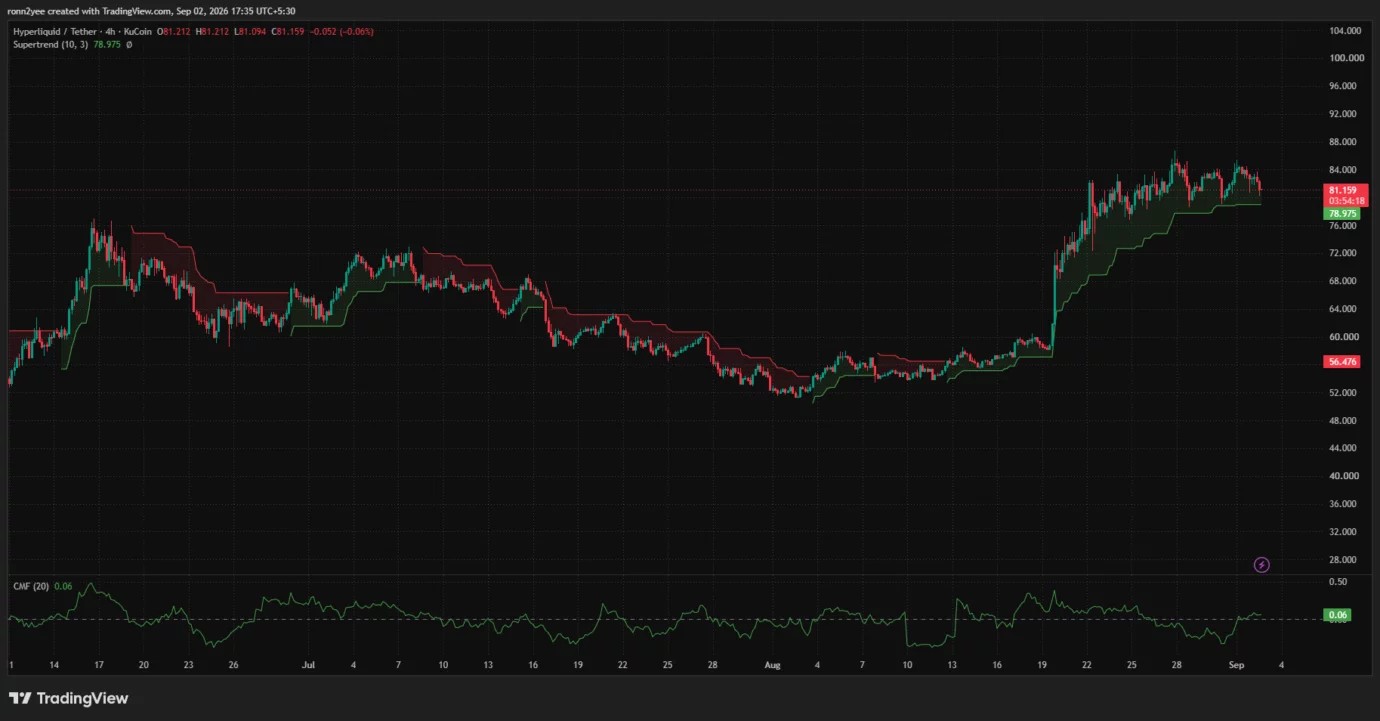
Chaikin Money Flow stands at 0.06, placing it slightly above zero. The reading indicates that buying pressure still exceeds selling pressure, but the modest value does not point to strong capital inflows. A move below zero would add evidence that distribution is increasing during the consolidation.
The daily chart provides a wider support range. $HYPE trades above the Bollinger Band midpoint at $74.36, while the lower band sits near $53.91. The sharp expansion in the bands reflects the volatility that accompanied the August breakout.
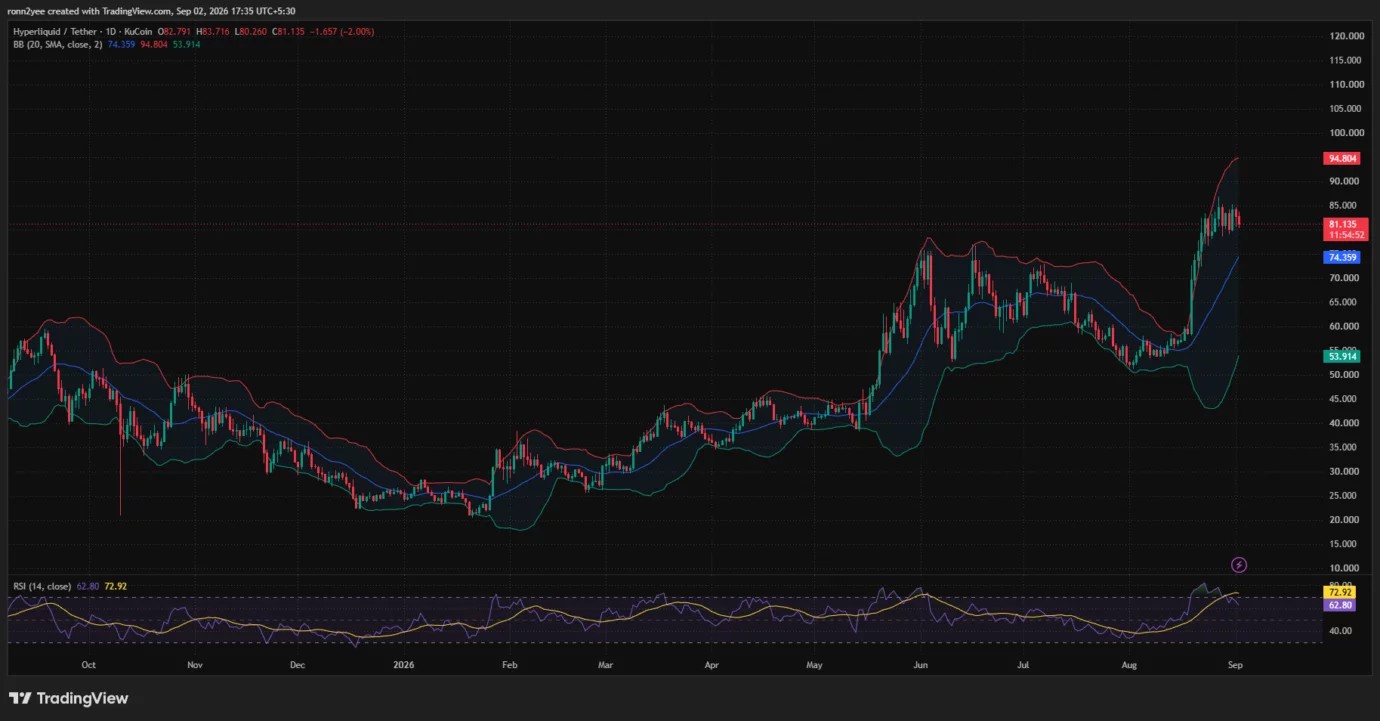
Daily relative strength has cooled to 62.80 after moving into overbought territory during the rally. The RSI now sits below its moving average of 72.92, showing that momentum has weakened as $HYPE pulled back from its high.
A lower RSI alongside a price still above the Bollinger midpoint is consistent with consolidation rather than a confirmed trend reversal. Buyers would need to reclaim $84.50 and then break $86.71 to restart price discovery.
A daily close above the record high could expose the psychological $90 level, followed by the upper Bollinger Band near $94.80. The latter is dynamic and will change as volatility develops.
Liquidation heatmap places $HYPE between $80 and $85
CoinGlass’ 24-hour liquidation heatmap shows dense leverage concentrations on both sides of the current price.
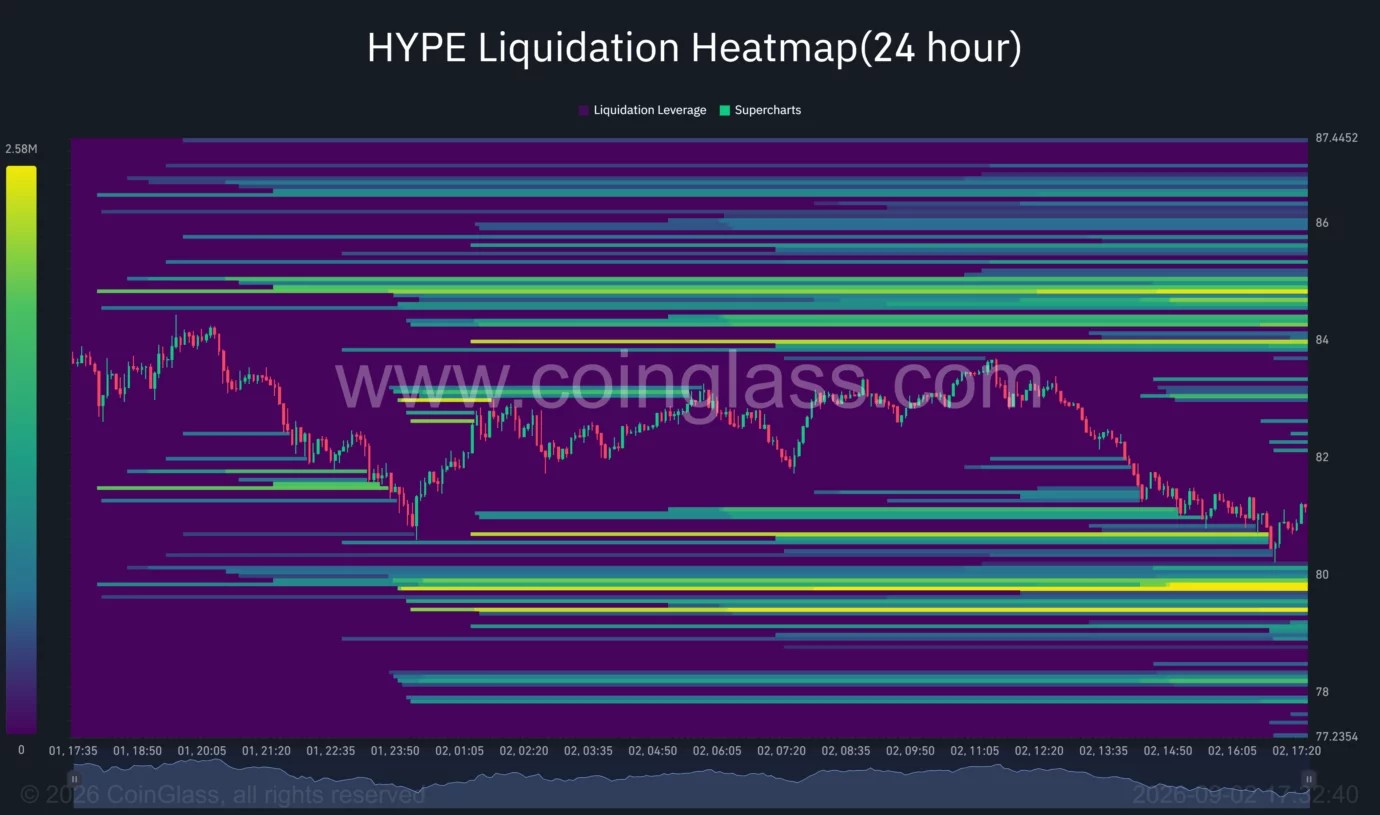
The strongest nearby downside cluster is concentrated around $79.70–$80. That area sits just below the 4-hour Supertrend and could attract price if the $81 support fails. A decisive break below it may increase the risk of long liquidations and open a move toward $78.
Additional downside liquidity appears near $79.30 and $78.20, making the broader $78–$80 region the most important short-term support zone.
On the upside, the largest nearby liquidity concentration appears around $84.70–$85. Smaller clusters are visible from $83.80 to $84.30 and above $85.50.
Price often gravitates toward areas containing concentrated leveraged positions, but a heatmap does not establish direction by itself. $HYPE currently sits between the two strongest pools, leaving either a sweep below $80 or a rebound toward $85 possible.
US policy efforts add a longer-term catalyst
Hyperliquid Policy Center and tradeXYZ have asked US regulators to establish a route for perpetual contracts tied to pre-IPO companies. Their Aug. 18 submission to the Securities and Exchange Commission presented data from five completed pre-IPO markets and identified regulatory questions that would need to be addressed before comparable products could serve US users.
The proposal does not represent SEC approval, and the agency has no stated deadline to respond. Hyperliquid’s platform also does not currently permit US users, limiting the immediate effect of its expanding product range on American traders.
For the price setup, $78–$80 remains the main line separating high-level consolidation from a deeper correction. A recovery above $85 would shift attention back to $86.71 and potential price discovery, while a daily close below $74.36 would weaken the wider bullish structure and expose lower support.