
 invezz.com
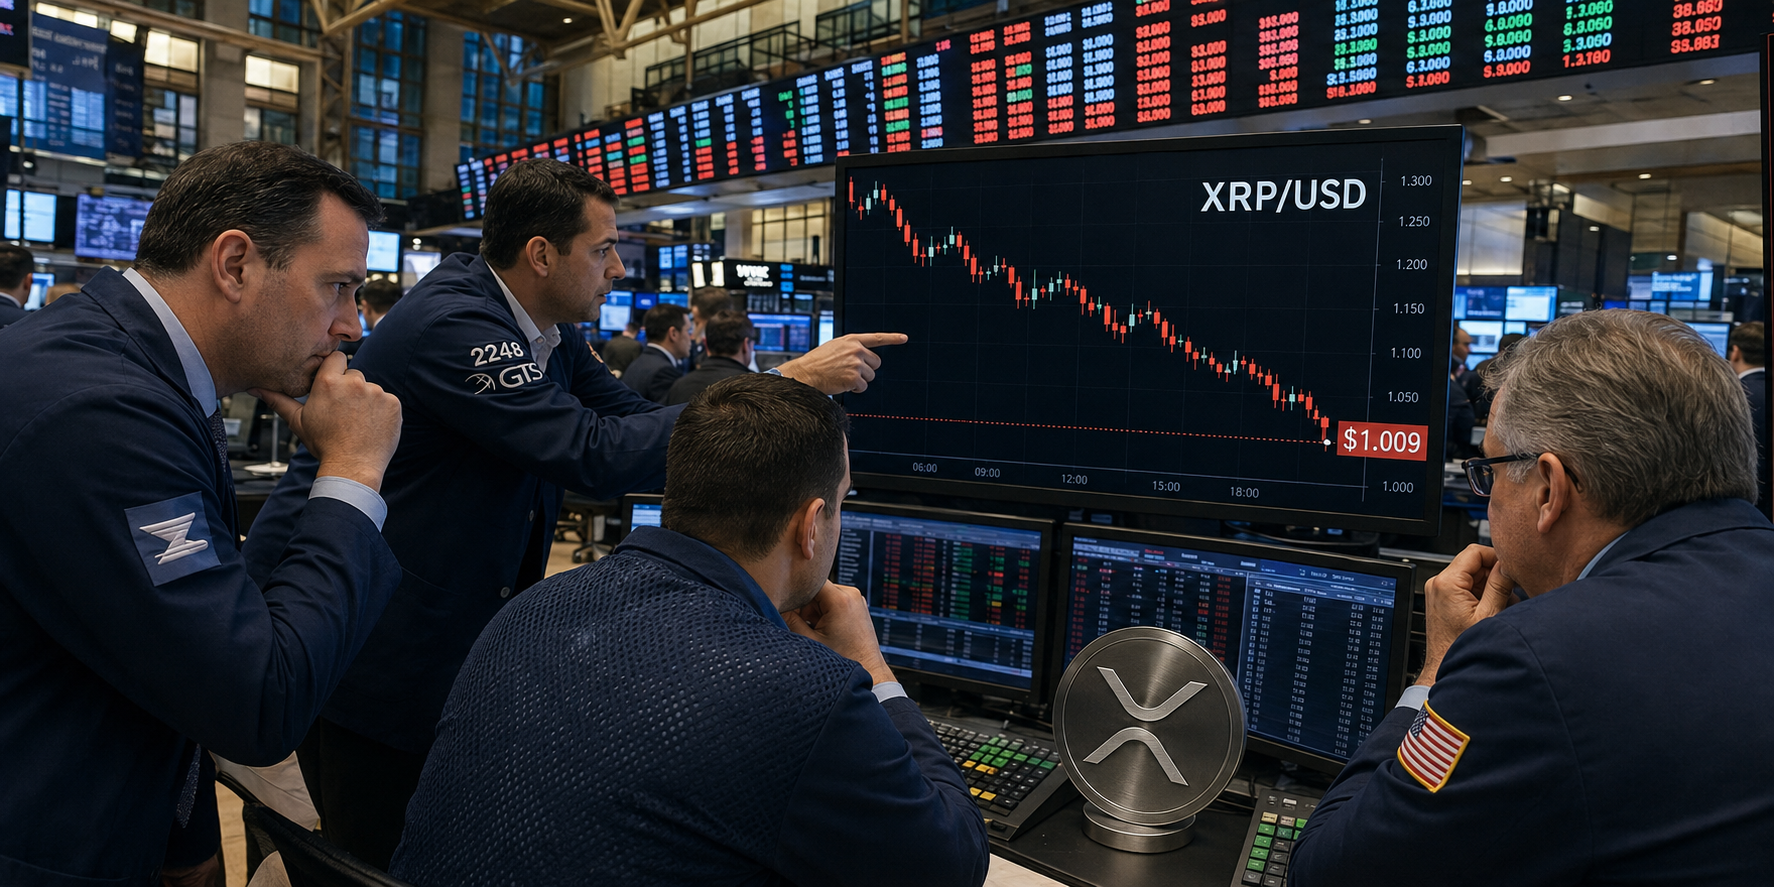
Ripple ($XRP) remains under selling pressure on Thursday after recording modest declines this week.
$XRP is hovering near the psychologically important $1.00 support level, down by more than 1% in the last 24 hours.
Derivatives and on-chain indicators offer conflicting signals, reflecting uncertainty among traders about whether the token can recover or extend its declines.
$XRP traders remain bearish
CoinGlass data indicates that traders are still bearish. The token’s long-to-short ratio stood at 0.918 on Thursday.
A reading below one means short positions marginally outnumber longs, suggesting traders are leaning toward an $XRP price dip.
However, the ratio remains close to neutral and does not indicate strong bearish conviction.
With $XRP trading just above $1, a sudden decline could force leveraged long traders to close their positions and accelerate selling pressure.
Despite the bearish long-to-short ratios, the funding rate for $XRP has turned positive. $XRP’s funding rate stood at 0.0079% on Thursday.
Positive rates mean traders holding long positions are paying those with short exposure, generally reflecting a bullish bias in perpetual futures markets.
The figures suggest that some traders are prepared to pay a premium to maintain bullish positions despite recent price weakness.
Still, positive funding alone does not confirm that a recovery is underway. If prices continue falling while funding remains positive, crowded long positions could become vulnerable to liquidations.
CryptoQuant’s summary indicators show cautious optimism for $XRP. $XRP’s futures market has recorded large whale orders, while most other tracked indicators remain neutral.
Significant orders from large traders could support a recovery if they represent accumulation, although their presence does not guarantee an immediate rebound.
$XRP holds just above the psychological $1 level
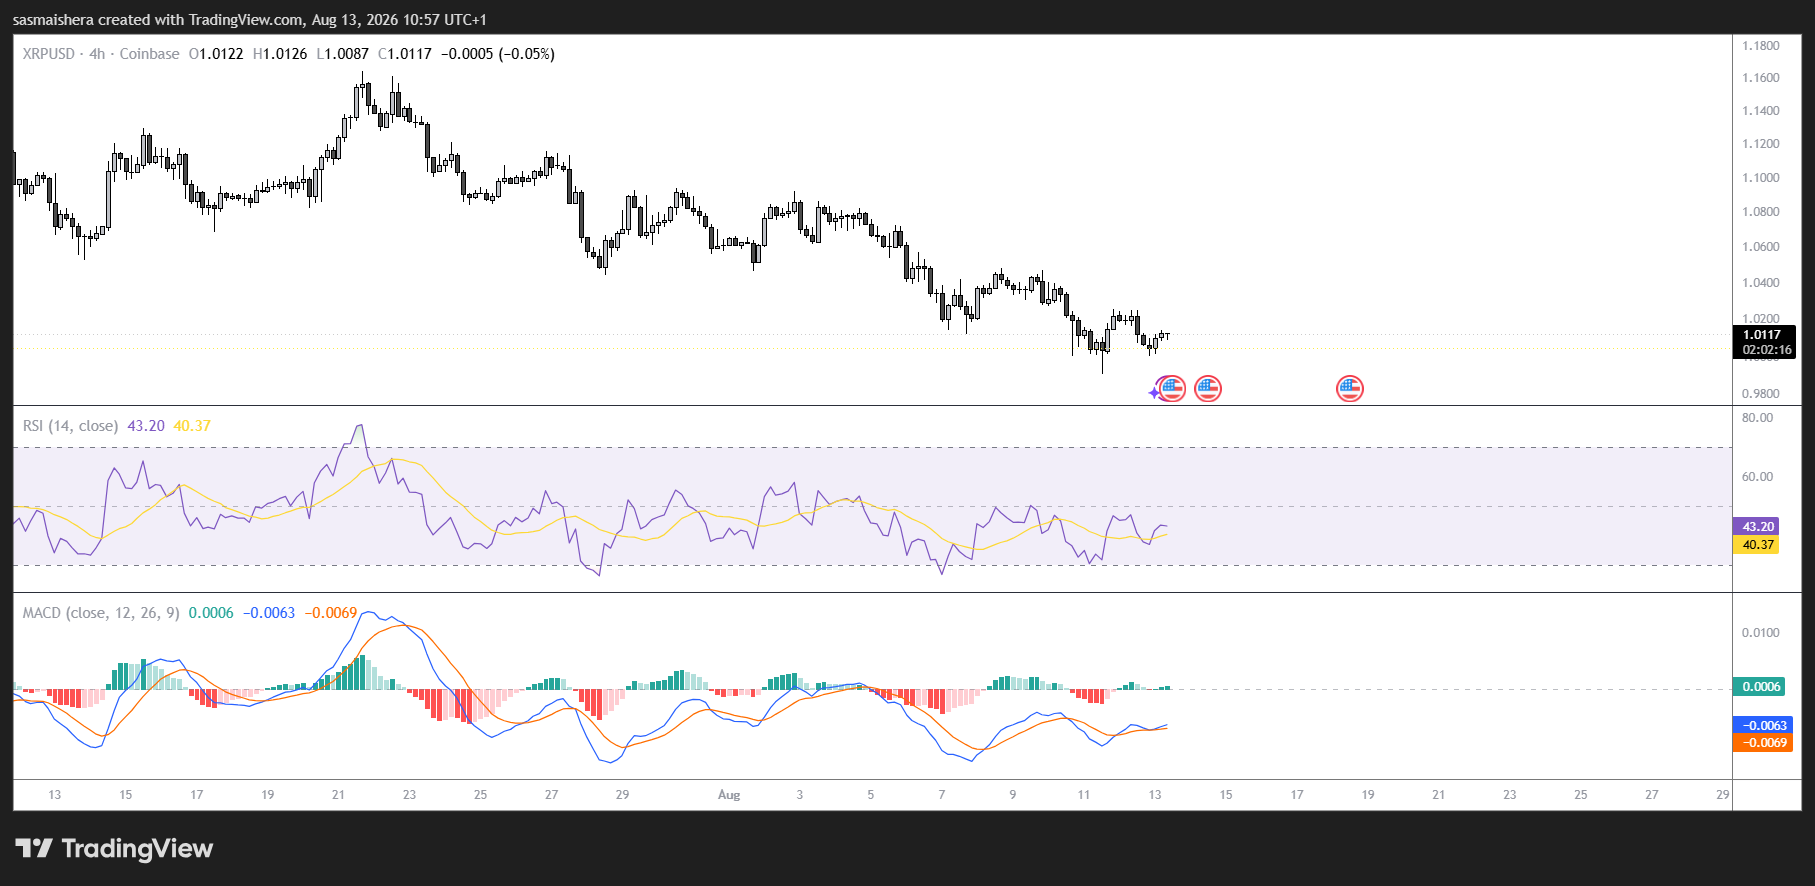
$XRP traded around $1.009 on Thursday, leaving the token only slightly above its crucial $1.00 support.
The near-term technical structure remains bearish because $XRP continues to trade below all three major Exponential Moving Averages (EMAs).
Its 50-day EMA stands at $1.09, the 100-day EMA at $1.171, and the 200-day EMA at $1.362.
These moving averages create multiple layers of overhead resistance and could restrict any recovery attempt.
The Relative Strength Index is at 40, indicating persistent selling pressure while approaching oversold territory.
Meanwhile, the Moving Average Convergence Divergence indicator remains below zero, reinforcing the bearish momentum.
The $1.00 psychological level represents $XRP’s most immediate support. Buyers may attempt to defend this area, particularly as the RSI approaches oversold conditions.
A convincing rebound would bring the 50-day EMA at $1.09 into focus. Clearing that level could allow $XRP to test the 100-day EMA at $1.171, followed by horizontal resistance around $1.30.
More substantial resistance sits at the 200-day EMA near $1.362, with the higher $1.90 level remaining a distant bullish target.
However, a decisive daily close below $1 would confirm weakening buyer demand and increase the likelihood of further losses.