Analysts expect one final $XRP price retest before it will mirror the massive expansion recorded by the Amazon stock in its early days.
$XRP has once again entered a critical zone, and some market observers now believe its long-term chart structure closely resembles Amazon’s (AMZN) setup before the stock entered a major repricing phase.
The comparison focuses on the close similarities between the current $XRP price trend and Amazon in 2009, and how this would impact $XRP if it fully followed the trajectory of the tech company’s stock.
Key Points
- $XRP’s long-term chart structure closely resembles AMZN’s setup before it entered a major repricing phase.
- $XRP has spent years respecting a rising support trendline while repeatedly struggling to break through a major resistance ceiling.
- Amazon showed a nearly identical structure between 1998 and 2009 before eventually breaking above the decade-long resistance level.
- $XRP could experience one final retest of support before a larger breakout attempt develops in 2026.
- If $XRP mirrors the exact scale of growth and rallies 5,660% from the 8-year resistance near $3.50, the asset will reach $202 per coin.
$XRP vs. Amazon Chart Highlights Similarities
According to market analyst Chart Nerd, $XRP has spent years respecting a rising support trendline while repeatedly struggling to break through a major resistance ceiling. This structure began forming from the 2018 peak near $3.50, with the asset consistently making higher lows, but it has not sustainably broken above an 8-year horizontal supply trendline.
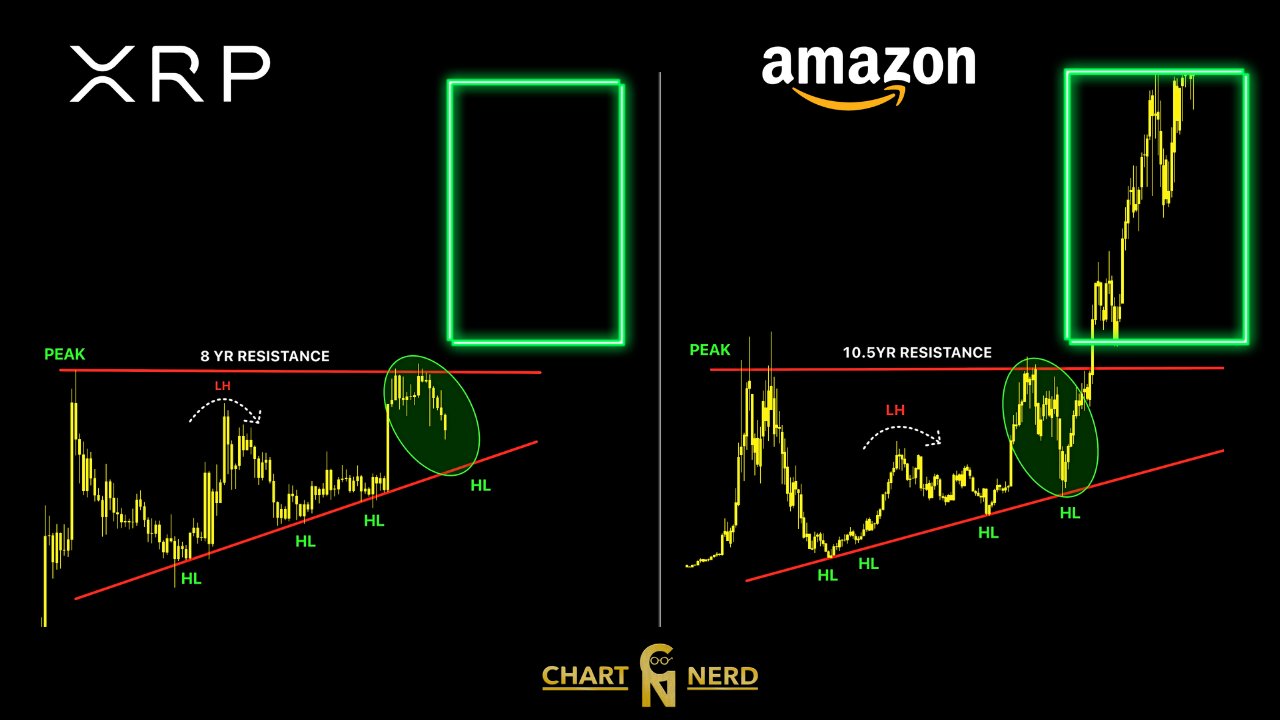
Amazon showed a nearly identical structure between 1998 and 2009 before eventually breaking above the decade-long resistance level. AMZN made similar higher lows but failed to breach the resistance near $4.70 before eventually doing so in October 2009. What followed was a powerful move higher.
$XRP Holds Long-Term Higher-Low Support
The analysis points to the ascending trendline as the most important part of the setup. Every major correction on $XRP’s higher timeframe has respected this support line, creating a pattern of higher lows over several market cycles.
Amazon displayed the same behavior before its breakout, and $XRP now appears to be following a similar path. The chart shows the asset consolidating near resistance while still holding above the rising support trendline. Chart Nerd believes $XRP could experience one final retest of support before a larger breakout attempt develops in 2026.
Meanwhile, the analysis builds on a prediction from Austin that $XRP will move like Amazon over the next 10 years. The outlook also highlighted the similarity between $XRP’s 2018 to 2026 price action and the development in AMZN’s 1998 to 2009 price.
What This Means for $XRP Price
Interestingly, AMZN opened at $4.67 in October 2009 and finally broke above the 10.5-year resistance near $4.70, reaching $6.28 before closing at $5.94. In subsequent months and years, the stock has continued to expand parabolically, reaching its current price of $269.
From the October 2009 opening price of $4.67 to today’s price of $269, Amazon has grown a staggering 5,660% over 17 years. It currently has a market cap of $2.893 trillion, making it the seventh-largest asset by market cap.
If $XRP mirrors the exact scale of growth and rallies 5,660% from the 8-year resistance near $3.50, the asset will reach $202 per coin. The magnitude of such an uptick is still very appealing at its current price of $1.45, as it culminates in a price of $84.
Notably, the comparison does not suggest $XRP will mirror Amazon’s exact price action. Instead, analysts focus on the structural similarities between the two charts. Historically, these formations tend to appear before major repricing events
For $XRP, the long-term structure still remains bullish as long as the ascending support trendline holds. Currently, this level stands just below the $1 mark.