XRP traded at $2.45 on March 26, 2025, within a tight intraday range of $2.43 to $2.48, amid a total market capitalization of $142 billion and a 24-hour trade volume of $2.40 billion.
XRP
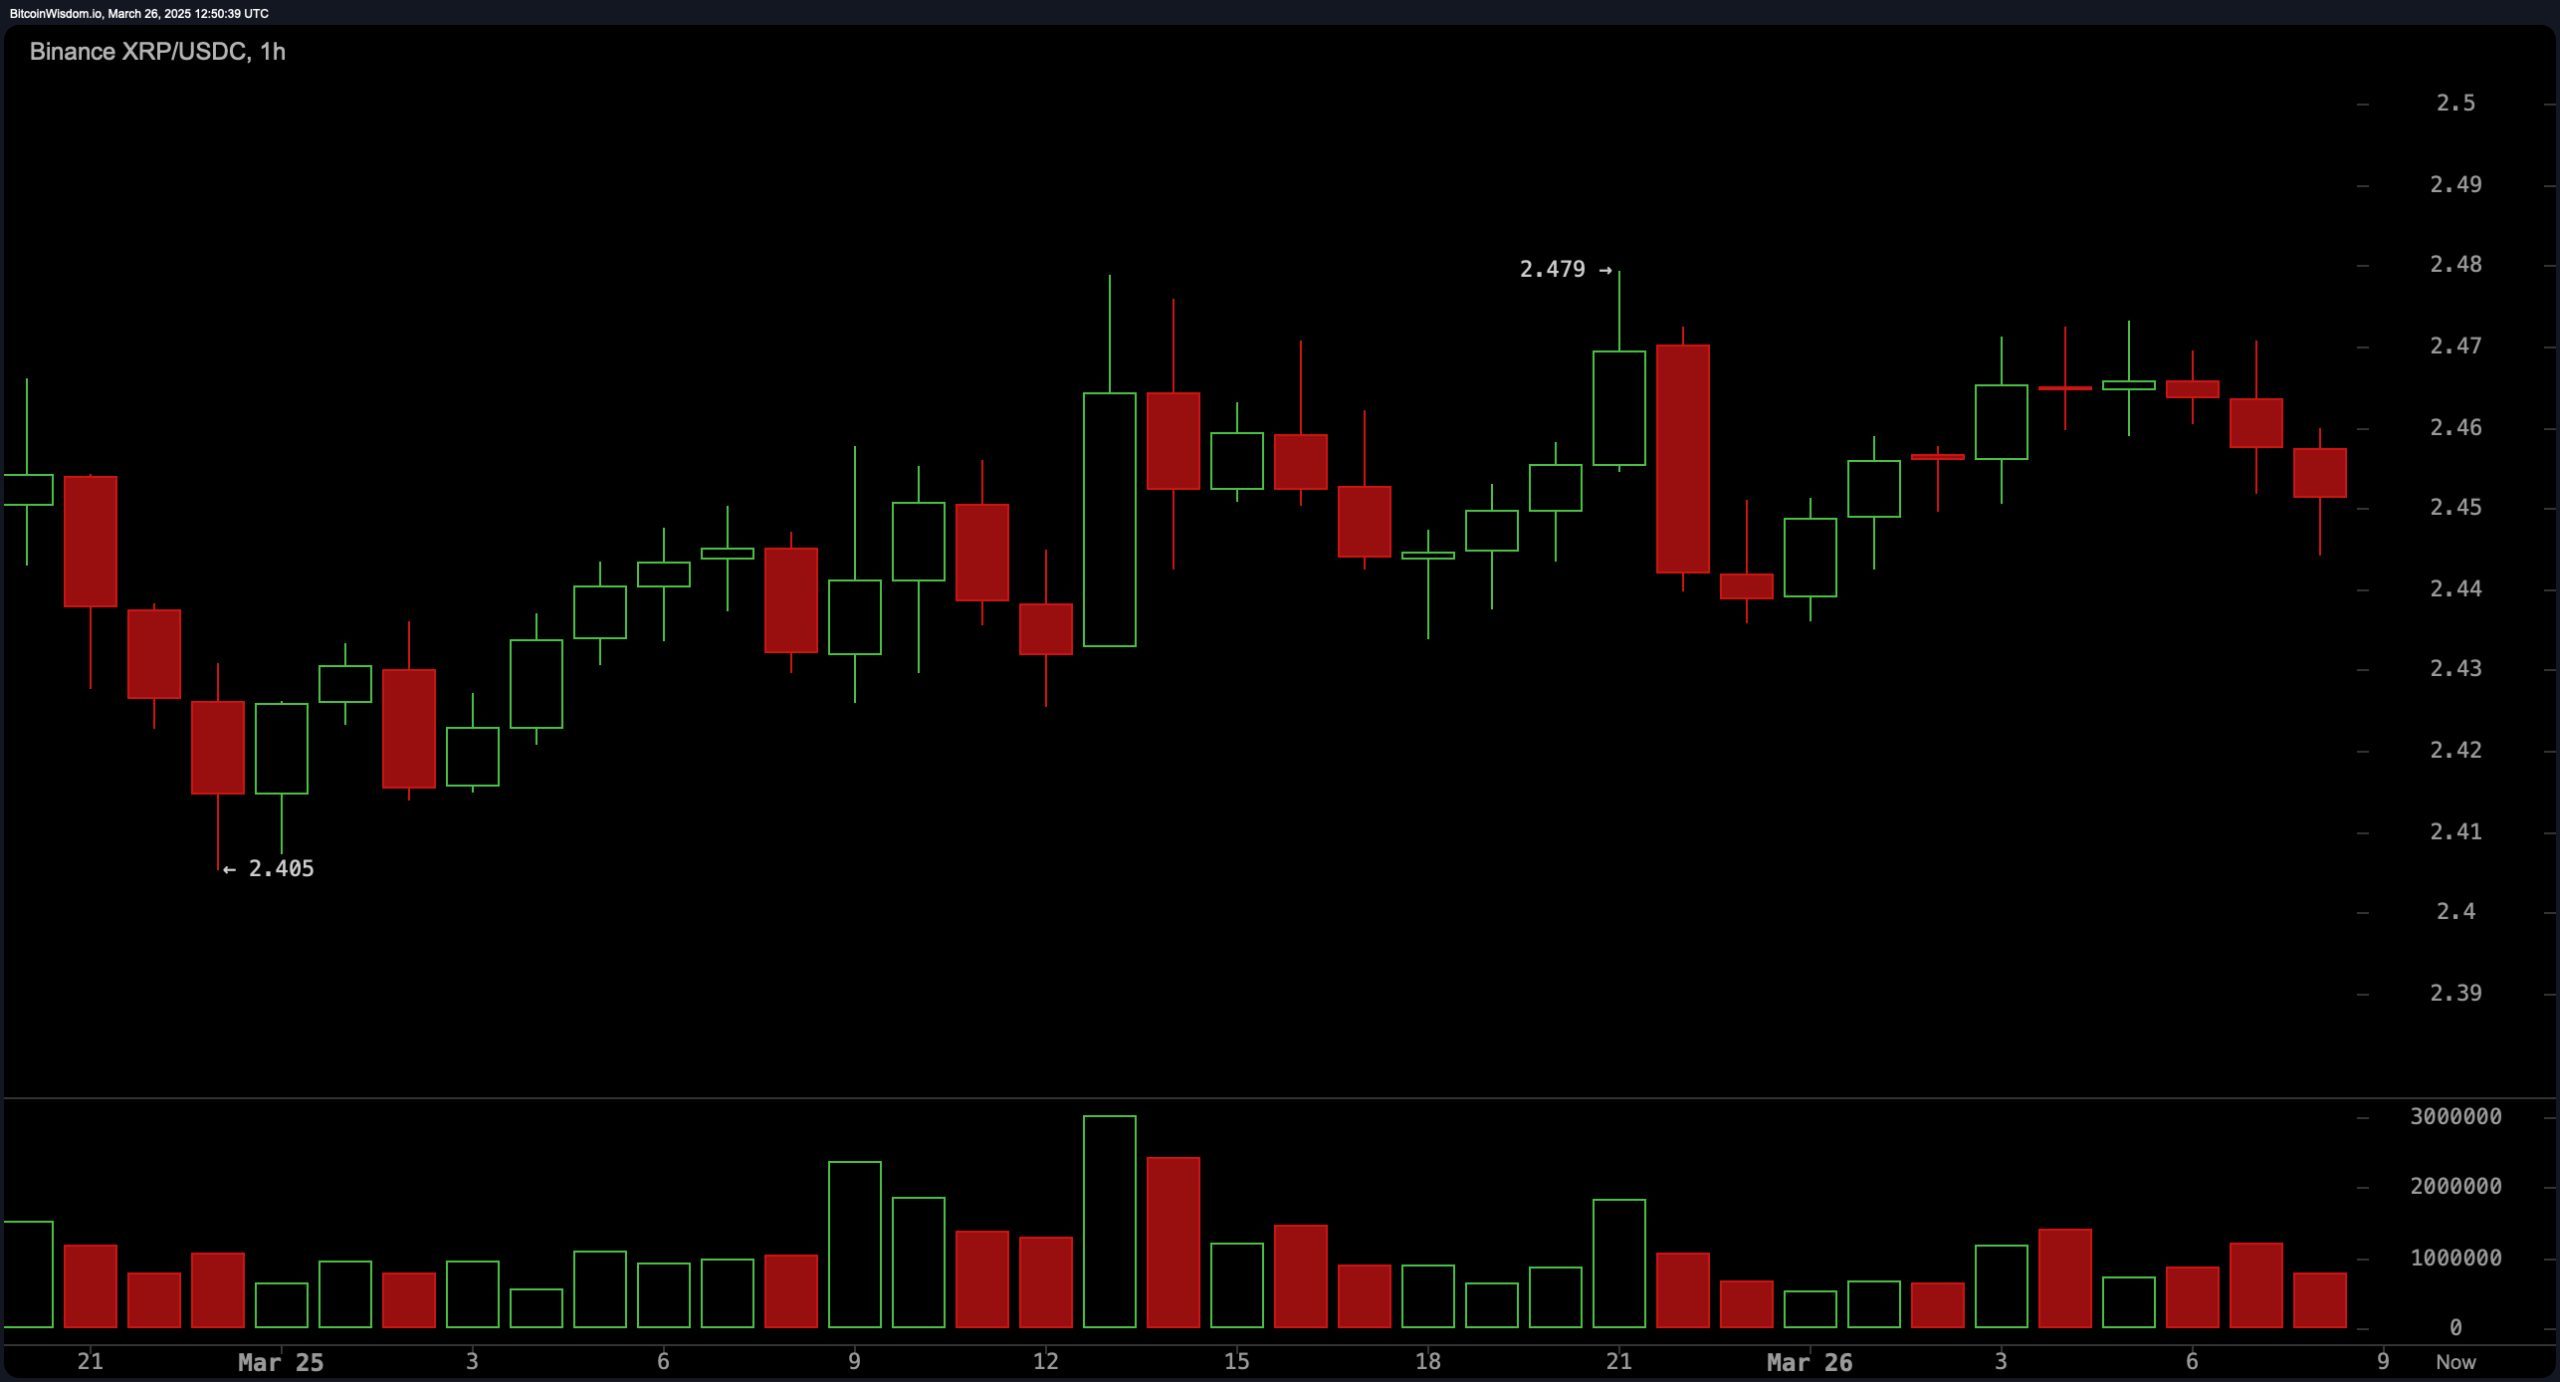
On the 1-hour chart, XRP exhibited a micro uptrend characterized by tight price action within an ascending channel between $2.44 and $2.47. The latest high was recorded at $2.479, but recent green candles have shown declining volume, suggesting that bullish momentum may be losing strength or entering a consolidation phase. A potential scalp entry exists near $2.45, with a tight stop-loss at $2.43 and targets set at $2.475 to $2.48, although caution is advised as low-volume breakouts may indicate false moves.

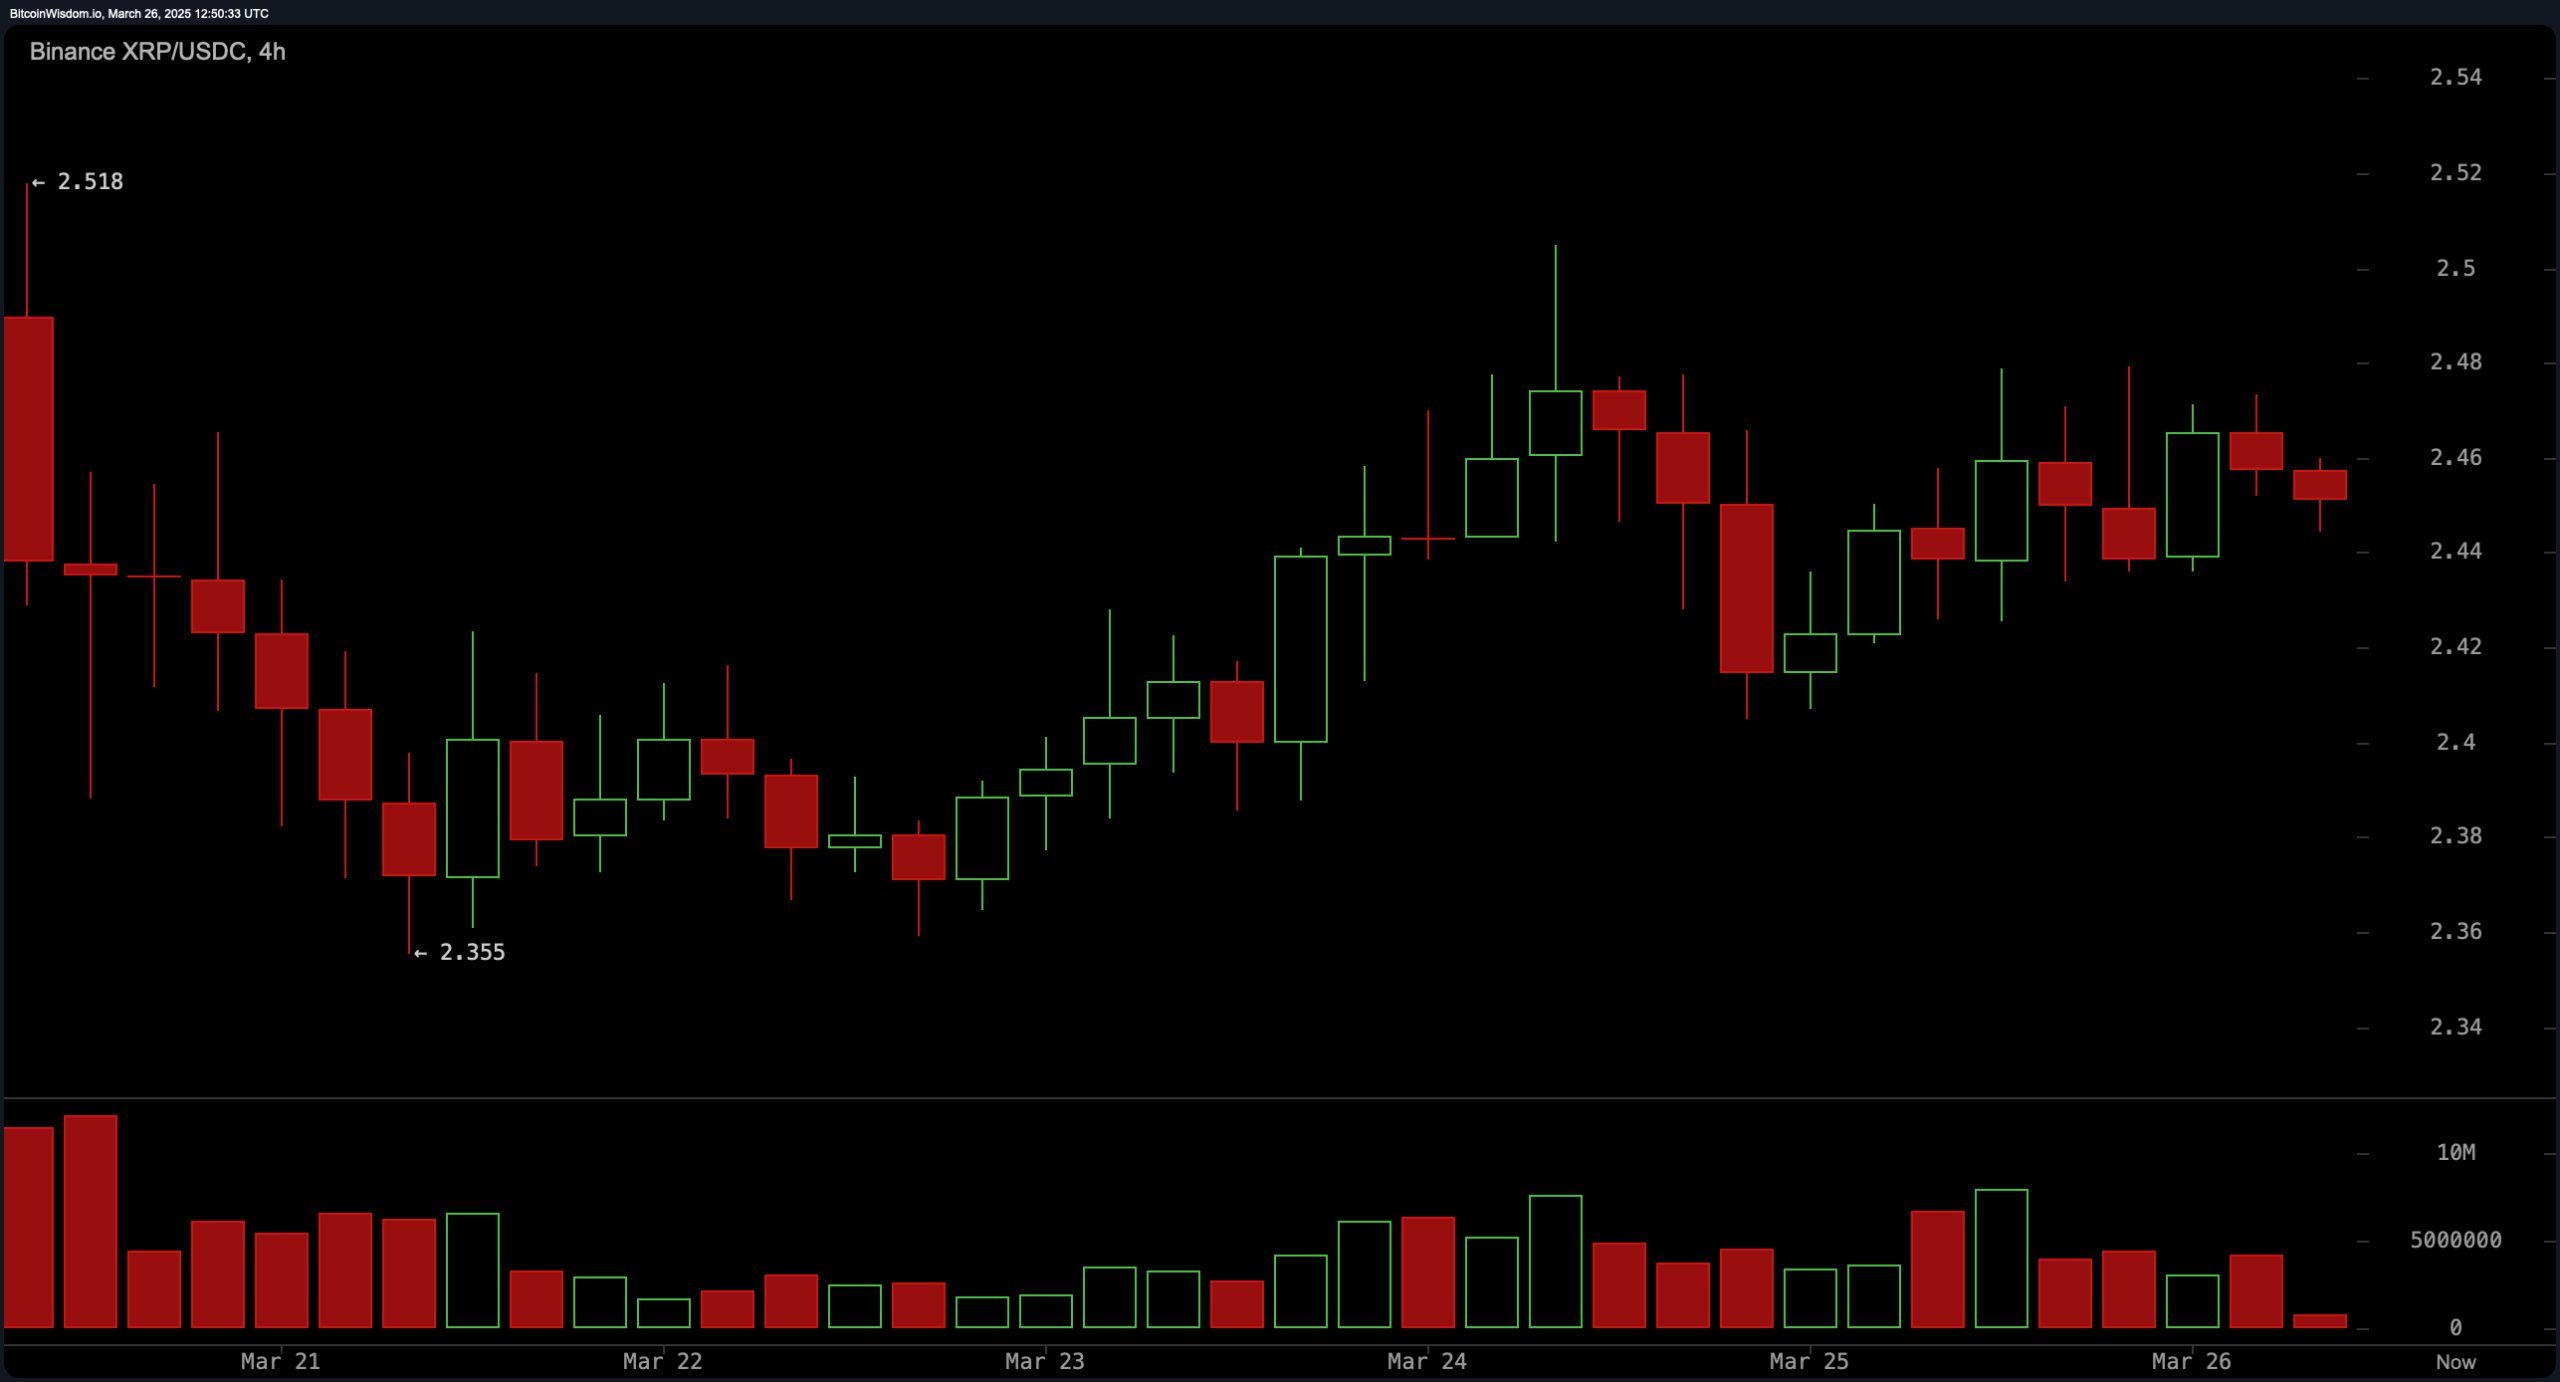
In the 4-hour timeframe, XRP showed a recovery from a local bottom of $2.355 to a recent peak of $2.518. The pattern emerging is a rounded bottom, a typical accumulation signal in technical analysis. Volume trends have been steady rather than surging, pointing to organic buying interest rather than speculative spikes. Traders may consider entering on a pullback to the $2.42–$2.44 support zone, with a short-term upside target of $2.52–$2.55. However, a close below $2.38 accompanied by increasing sell volume would signal a potential exit.

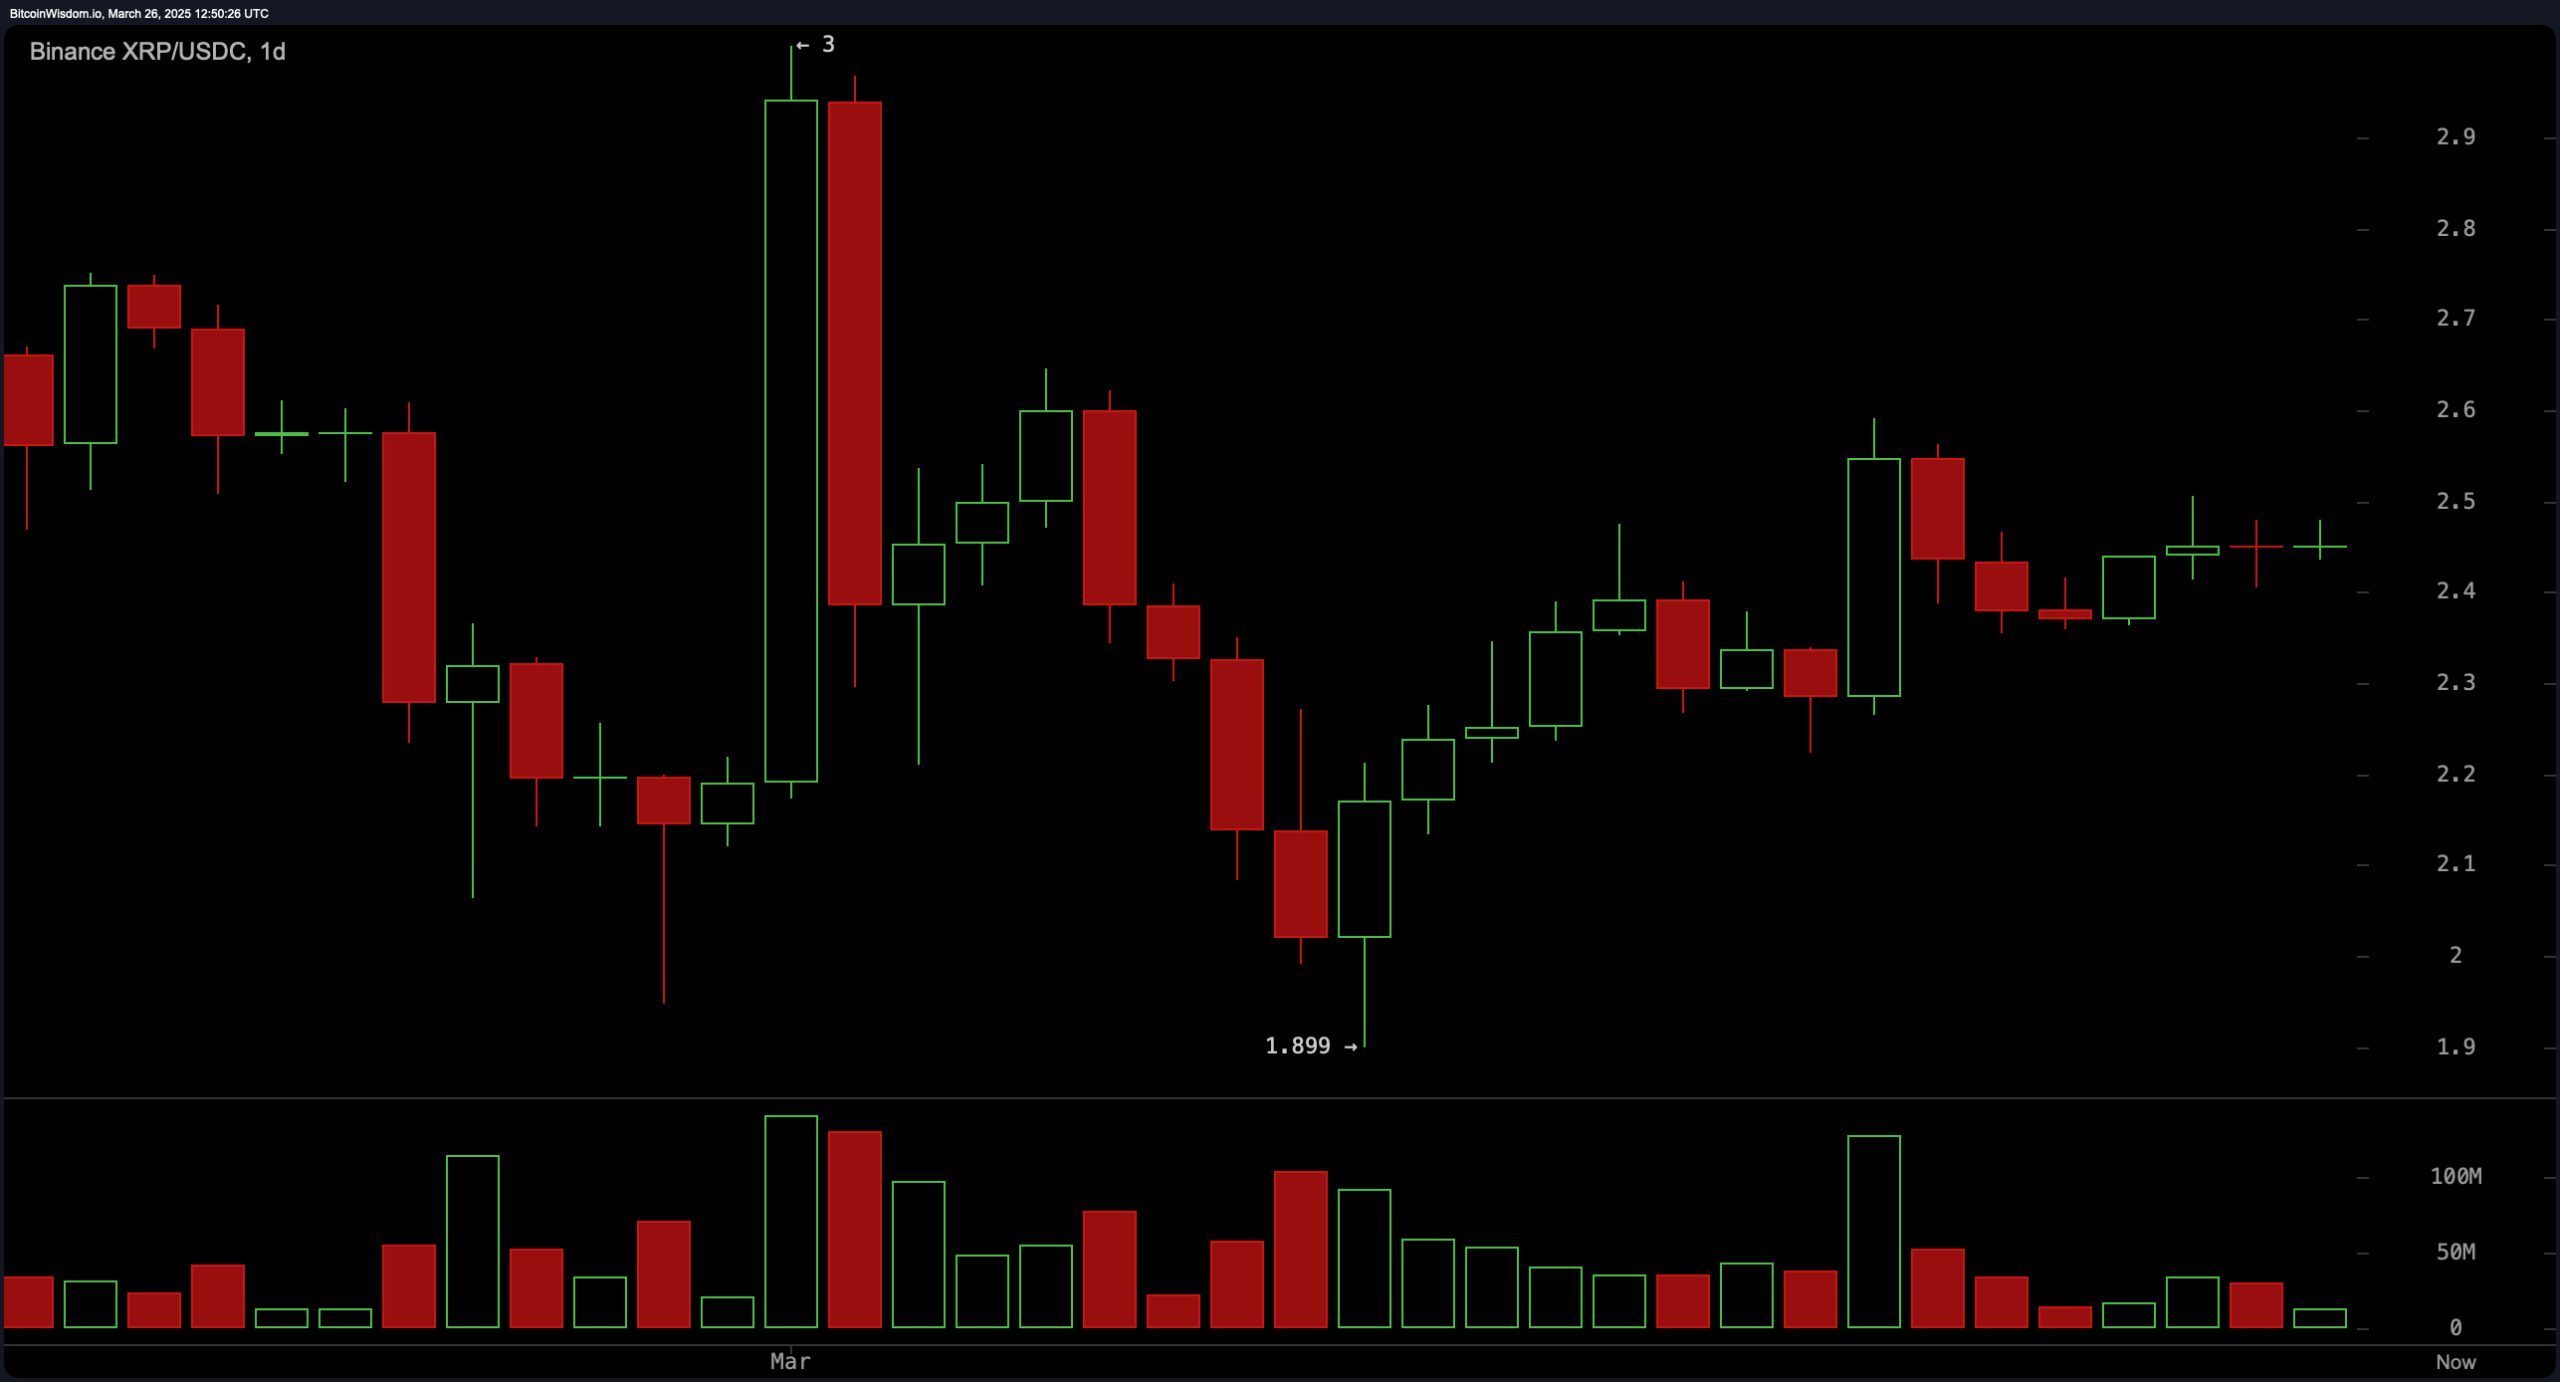
From the daily chart perspective, XRP has maintained a bullish structure after reversing strongly near $1.899. The asset briefly touched resistance at approximately $2.90 before retracing and establishing a range between $2.30 and $2.60. Notably, the ongoing sideways movement above $2.40 reflects possible accumulation rather than distribution. Should XRP hold this level and break above $2.60 with increased volume, it would signal a continuation of the bullish trend. Conversely, a breach below $2.30 with heightened selling activity could prompt a retest of the $2.00–$2.10 area.

Turning to oscillators, the current technical sentiment appears neutral overall, with several indicators suggesting caution. The relative strength index (RSI) is at 52.05, the Stochastic at 70.18, the commodity channel index (CCI) at 80.90, and the average directional index (ADX) at 13.08, all reflecting a market in balance rather than clear overbought or oversold conditions. However, positive signals emerge from the awesome oscillator, momentum indicator, and moving average convergence divergence (MACD), all of which currently indicate a buy position. This divergence between momentum-based and trend-neutral indicators underscores the need for volume confirmation before positioning for a breakout.
A review of moving averages (MAs) reveals a strong bullish bias across most short- to long-term indicators. The exponential moving average (EMA) and simple moving average (SMA) for the 10, 20, 30, 50, and 200 periods are all showing buy signals. The only exception is the 100-period simple moving average, which issues a sell signal, potentially due to residual resistance levels from prior peaks. Collectively, this configuration reinforces the strength of the current trend, suggesting that the $2.40–$2.44 range could act as a critical accumulation zone for further upward movement, provided that trading volume supports the continuation.
Bull Verdict:
XRP maintains a solid bullish framework across multiple timeframes, underpinned by strong support above $2.40, consistent positive signals from both short- and long-term moving averages, and upward momentum indicators such as the awesome oscillator and the moving average convergence divergence (MACD). If volume increases alongside a breakout above $2.60, the path toward reclaiming recent highs near $2.90 remains viable, reinforcing a bullish continuation bias.
Bear Verdict:
Despite XRP’s resilience, the lack of strong volume on recent upswings and the neutral stance of key oscillators—like the relative strength index (RSI), Stochastic, and commodity channel index (CCI)—raises caution. A decisive breakdown below $2.30, especially with rising sell volume, would negate the current consolidation narrative and open the door for a deeper pullback toward the $2.00–$2.10 range, marking a potential bearish reversal.
 news.bitcoin.com