Source: TradingView
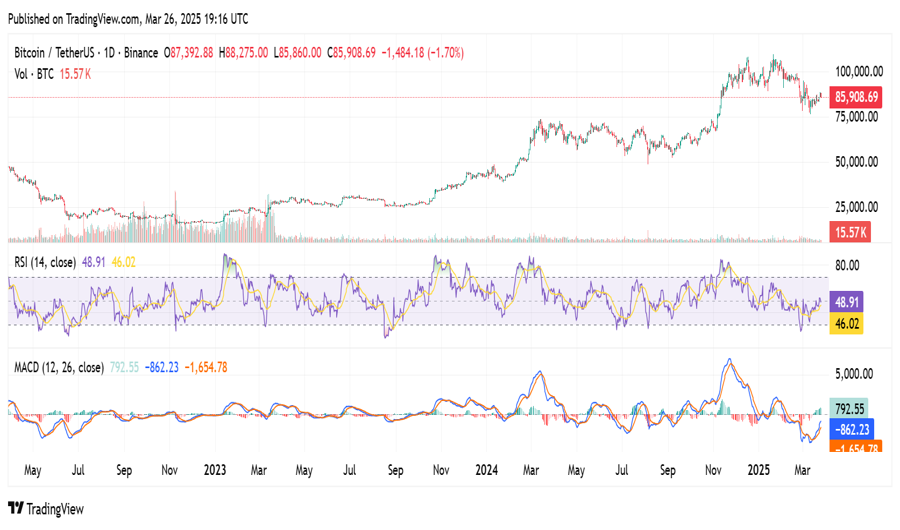
The 14-day Relative Strength Index (RSI) stands at 48.91, while its moving average is 46.02. They indicate neutral momentum with equal buying and selling pressure. Volatility at 50 levels of RSI implies consolidation pending breakout or pullback.
The Moving Average Convergence Divergence or MACD indicator has a MACD line of 792.55 and a signal line of -862.23. A negative histogram of -1,654.78 indicates bearish momentum, which is consistent with Bitcoin’s retracement. Prolonged negative MACD trends can be indicative of further risk of downside.
Fibonacci retracement levels confirm $75,000 as a major support level and coincide with earlier accumulation phases. Trendlines indicate Bitcoin has an uptrend despite short-term retracements. Remaining above $85,000 might permit recovery to major resistance levels.
Market Cycle Trends and Resistance Levels
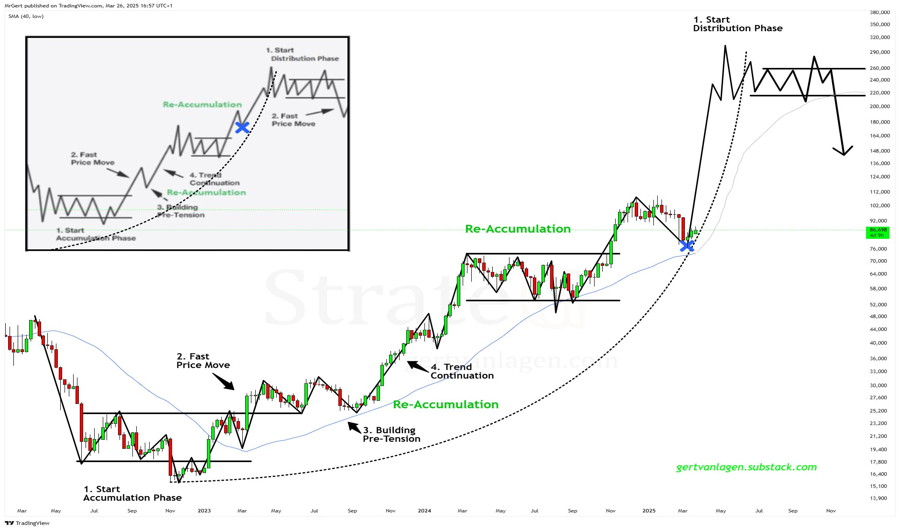
Market analyst Gert van Lagen considers Bitcoin’s re-accumulation phase to be a powerful sign of an imminent rally to $200K-$300K. His analysis considers $73,900 to be a key invalidation point below which there is an increased risk of a downturn.
Source: Gert van Lagen
Previous Bitcoin cycles have provided several opportunities for accumulation before significant breakouts. Periods of reaccumulation have sustained bullish trends by driving continuous uptrends. As a result, Bitcoin may maintain its upward momentum and reach new heights if the trend holds.
Van Lagen emphasizes the importance of the support trendline continuing upwards to keep the bullish case for Bitcoin alive. Pressure can push the prices higher if it is intact. The $100,000 resistance can introduce volatility before a breakout.
Future Price Action and Key Levels to Watch
Bitcoin’s direction depends on support, with trend strength intact. A breakout above $100,000 would confirm bullish momentum with the $ 200 K-$300 K zone as the target. A breakdown below $73,900 can indicate a sentiment reversal.
Bitcoin price cycles suggest that accumulation phases produce strong rallies. Following historical trends, another breakout is imminent. Failure to hold $75,000 could spell downside risks, a make-or-break point for traders.

 cryptonewsland.com