Hedera Hashgraph (HBAR) is very close to reaching a new all-time high price.
Polkadot (DOT) is following an ascending support line and has reclaimed the $29 horizontal area.
DigitalBits (XDB) has been increasing steadily, and reached a new all-time high price on Sept 13.
HBAR
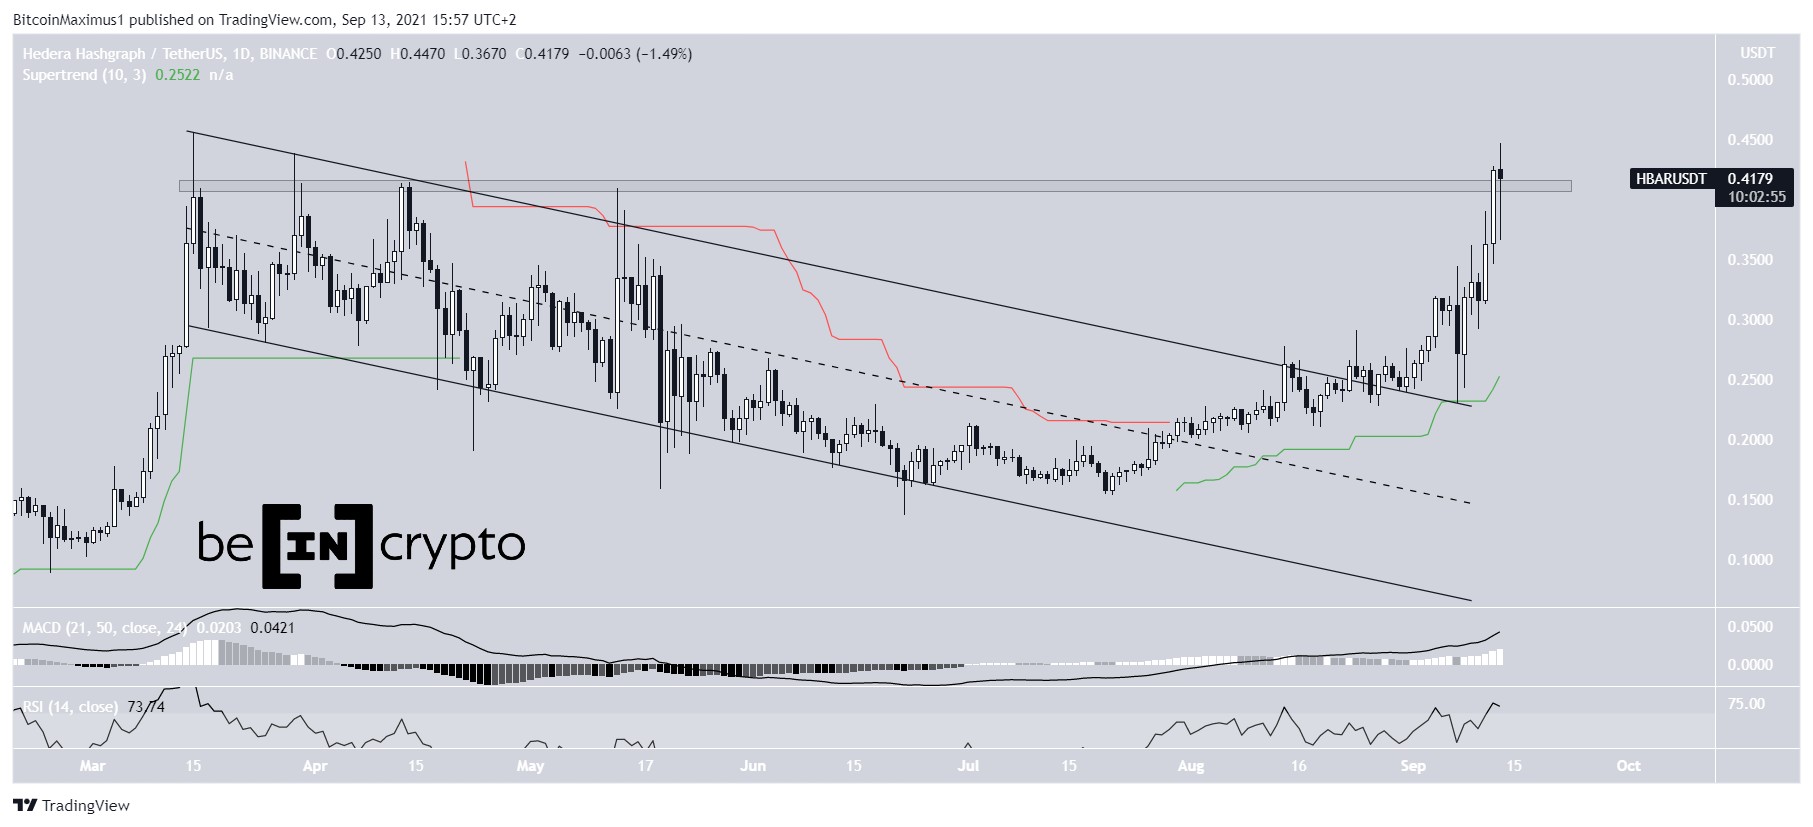
HBAR had trading inside a descending parallel channel since reaching an all-time high price on March 14. Such channels usually contain corrective structures.
The decrease continued until June 22, when the token bounced at the support line of the channel.
On Aug 24, HBAR broke out from the parallel channel and has been moving upwards at an accelerated rate since.
On Sept 13, it reached a high of $0.447, just barely missing a new all-time high.
Technical indicators are bullish. The RSI and MACD are both increasing, and the super trend line (green) is bullish.
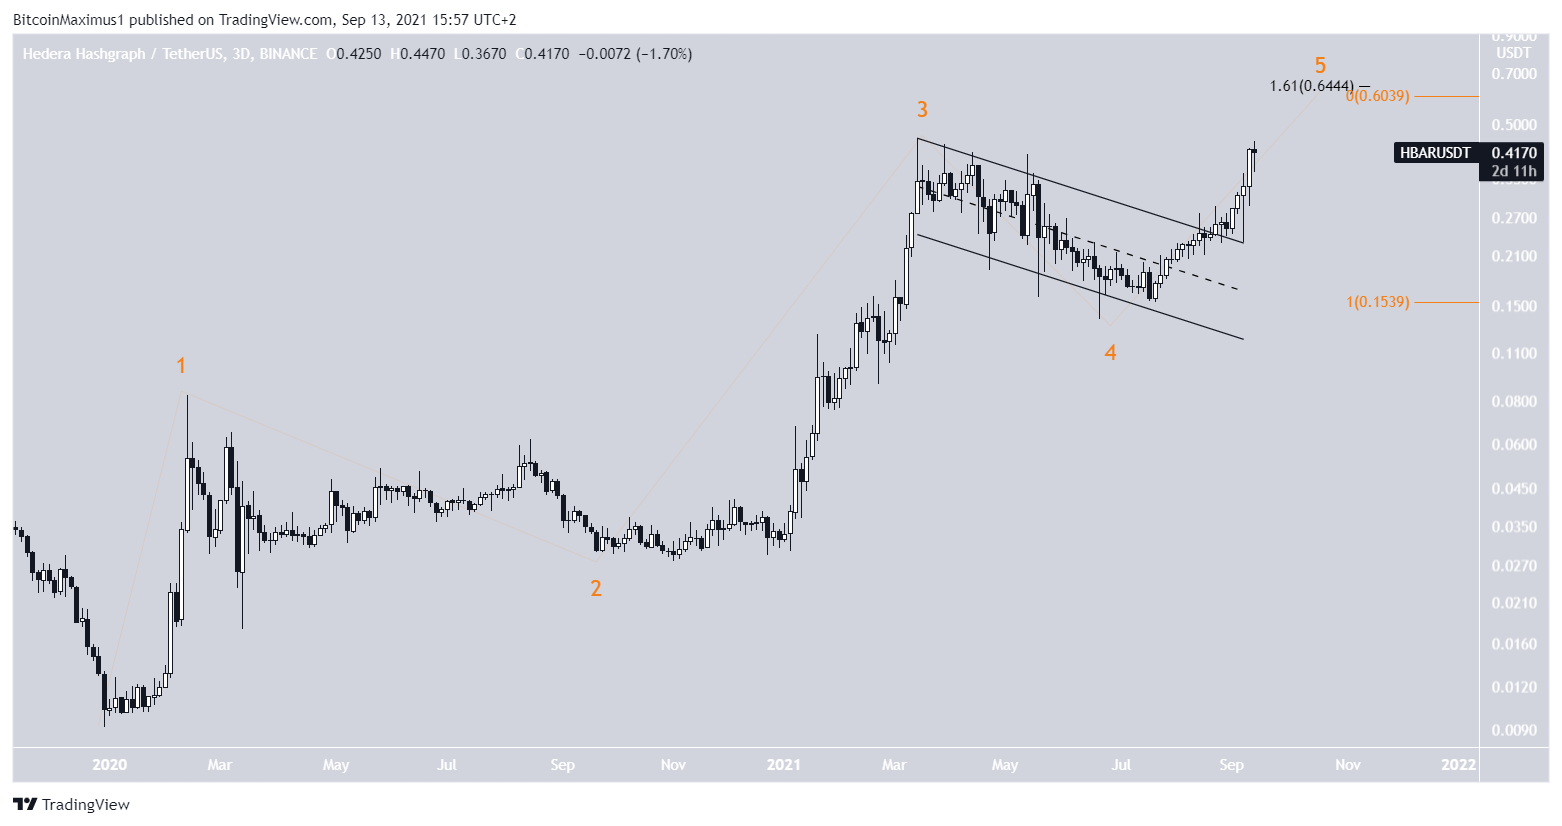
The wave count suggests that the token is now in wave five, after breaking out from the parallel channel.
A likely target for the top of the upward movement is between $0.60-$0.64. The target is found using the 1.61 external Fib retracement level (black) and the length of waves 1-3 (orange).
Highlights
- HBAR has broken out from a long-term descending parallel channel.
- It is close to reaching a new all-time high price.
DOT
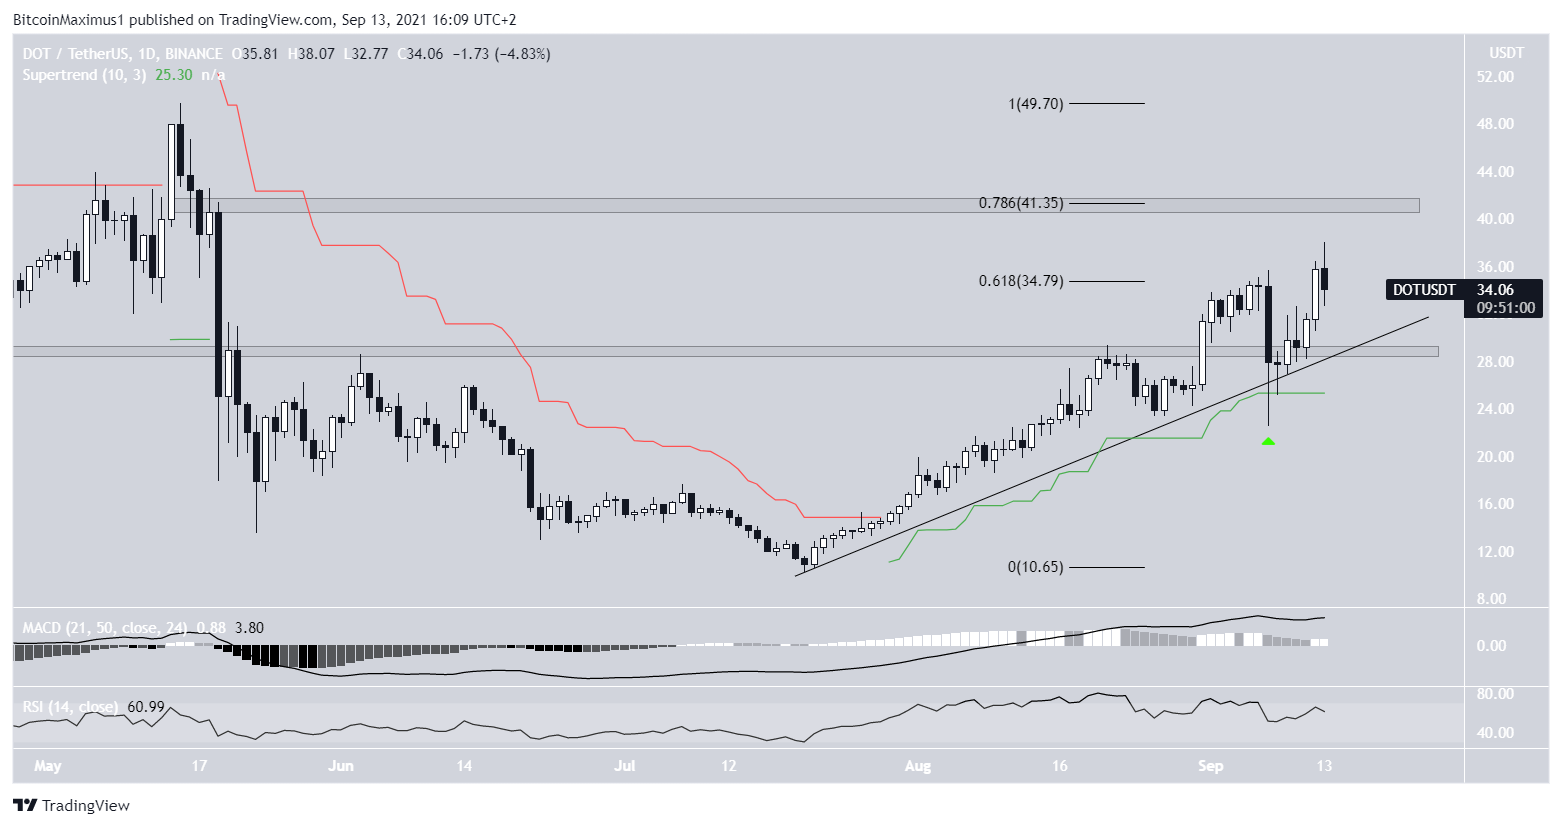
DOT has been moving upwards since July 20. After struggling to move above the $29 area, it was finally successful in doing so on Aug 31.
Afterwards, it returned to validate the area as support on Sept 7 (green icon), also bouncing on the ascending support line. This led to a high of $38.07 on Sept 13.
Technical indicators are relatively bullish, since the MACD is positive and the RSI is above 50. However, neither is moving upwards.
However, the price action looks bullish. DOT is already above the 0.618 Fib retracement resistance level at $34.80. Therefore, the next closest resistance is at $41.35.
Highlights
- DOT is following an ascending support line.
- There is support and resistance at $29 and $41.35.
XDB
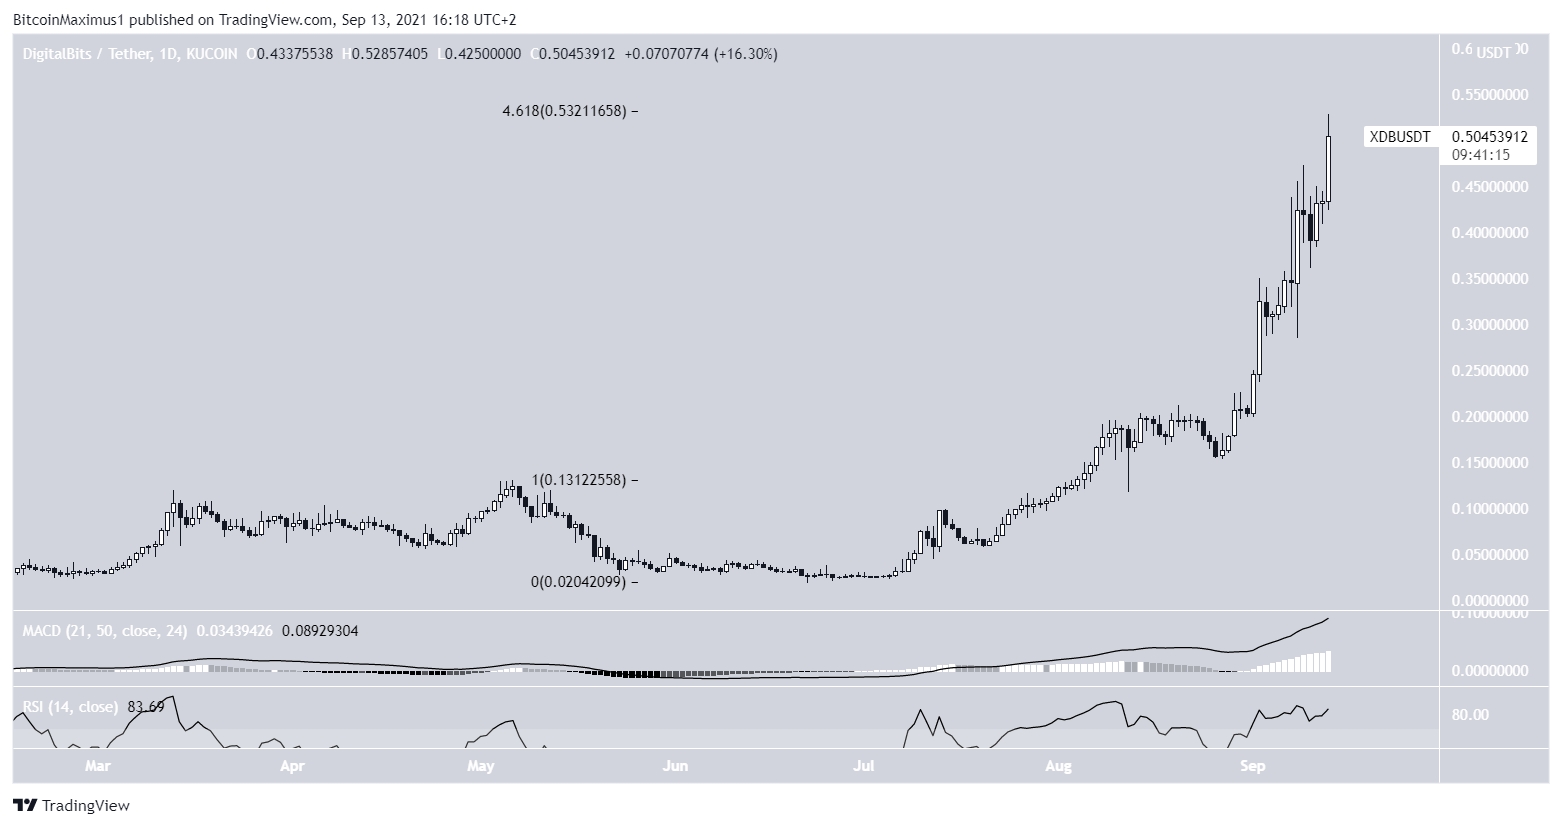
XDB has been moving upwards since June 20. It initially reached a new all-time high price on Aug 5. After breaking out, it returned to validate the all-time high resistance region as support on Aug 13 and created a long lower wick.
Afterwards, the upward movement continued at an accelerated rate and XDB reached a new all-time high of $0.528 on Sept 13.
Despite the MACD and RSI both being bullish, the high has been made at the 4.618 external Fib retracement level, which very often acts as the top of upward movements.
Therefore, it is likely that XDB is approaching the top of its upward movement.
Highlights
- XDB is increasing parabolically.
- It reached a new all-time high price on September 13.