
Bitcoin traded at $66,424 on March 1, 2026, at 8:30 a.m. EST, consolidating inside a defined $63,886 to $68,043 intraday range as the broader structure remained under pressure. While short-term charts show range stabilization, moving averages and momentum metrics continue to lean defensive across time frames.
Bitcoin Chart Outlook
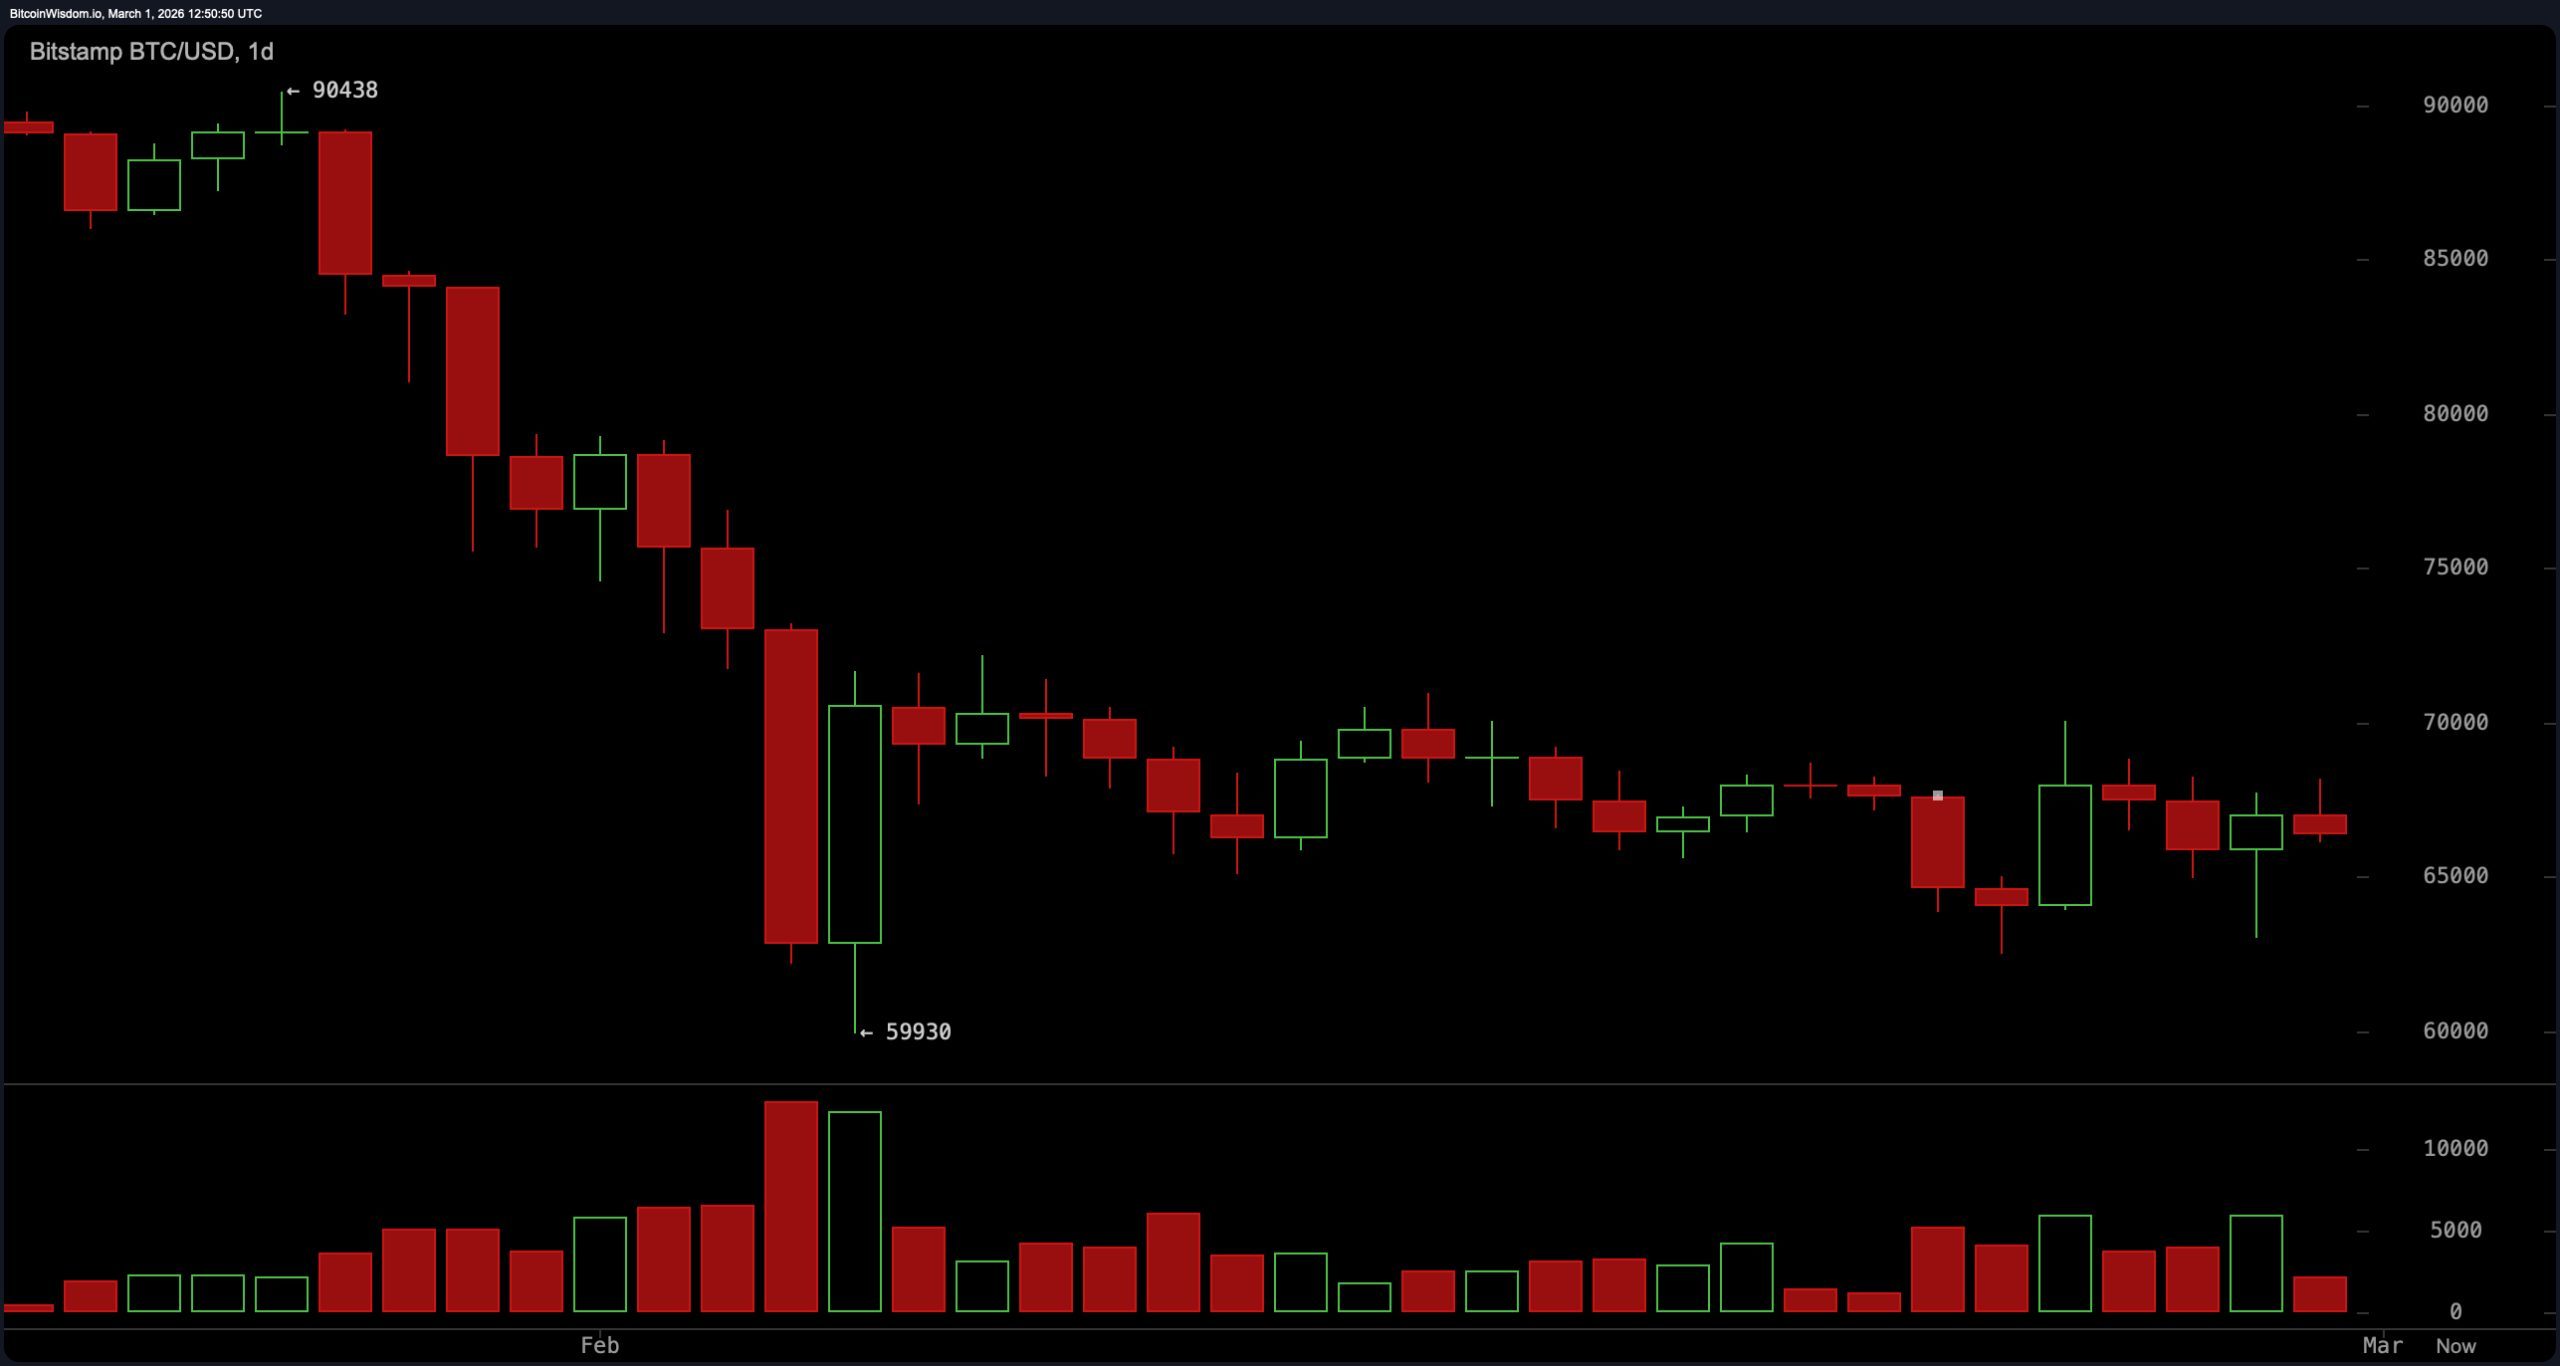
On the daily chart, bitcoin maintains a bearish macro structure following a decline from roughly $90,000 to a capitulation low near $59,900, with price now compressing between $63,000 support and $69,500 to $70,000 resistance. Lower highs continue forming near the upper boundary of the range, while volume has tapered during consolidation, signaling a compression phase.
The prevailing pattern resembles a bear flag or distribution range unless price can reclaim the $70,000 region decisively. Until that occurs, the broader structure remains tilted downward, regardless of intermittent bounces.
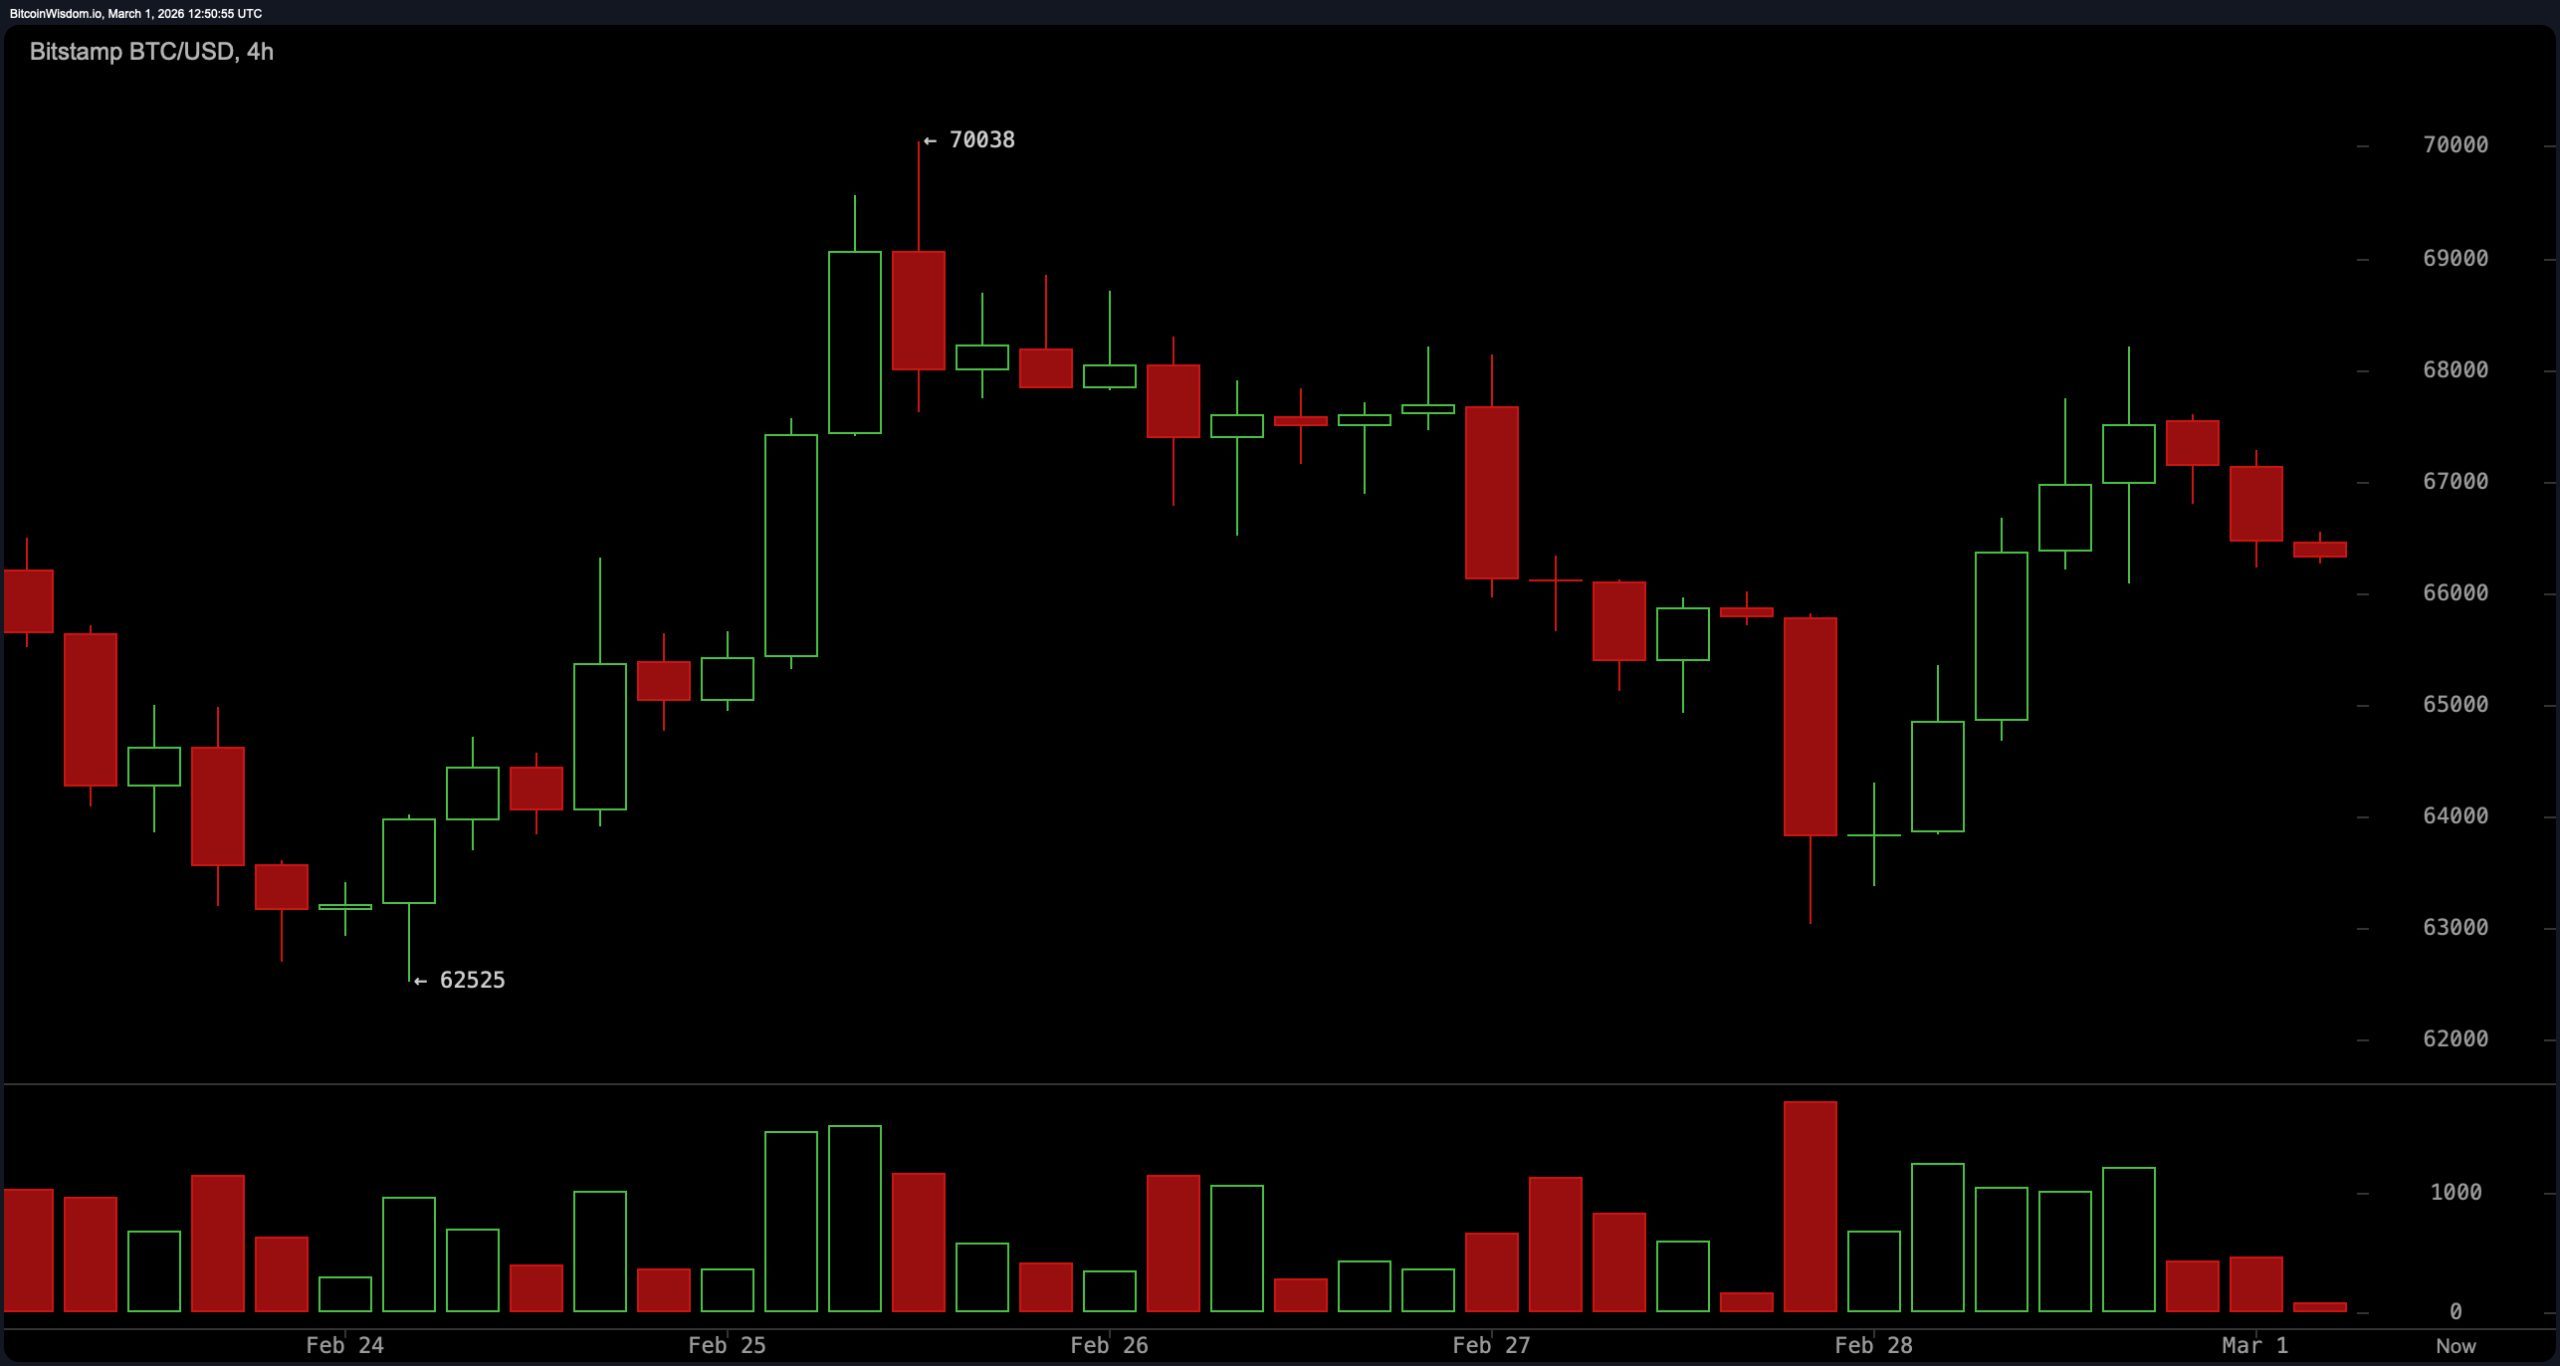
On the four-hour chart, bitcoin’s price rebounded from approximately $63,000 but was rejected near $70,000, forming another lower high before rotating lower again. Buyers have repeatedly defended the $63,000 to $64,000 zone, establishing it as the primary intraday support cluster. Resistance is concentrated between $68,000 and $70,000, with $63,000 serving as the structural breakdown trigger and $70,000 as the upside break trigger. Momentum is described as slightly bearish unless price reclaims $68,000 and sustains acceptance above that level. In other words, the range is intact, but it is not exactly radiating bullish conviction.
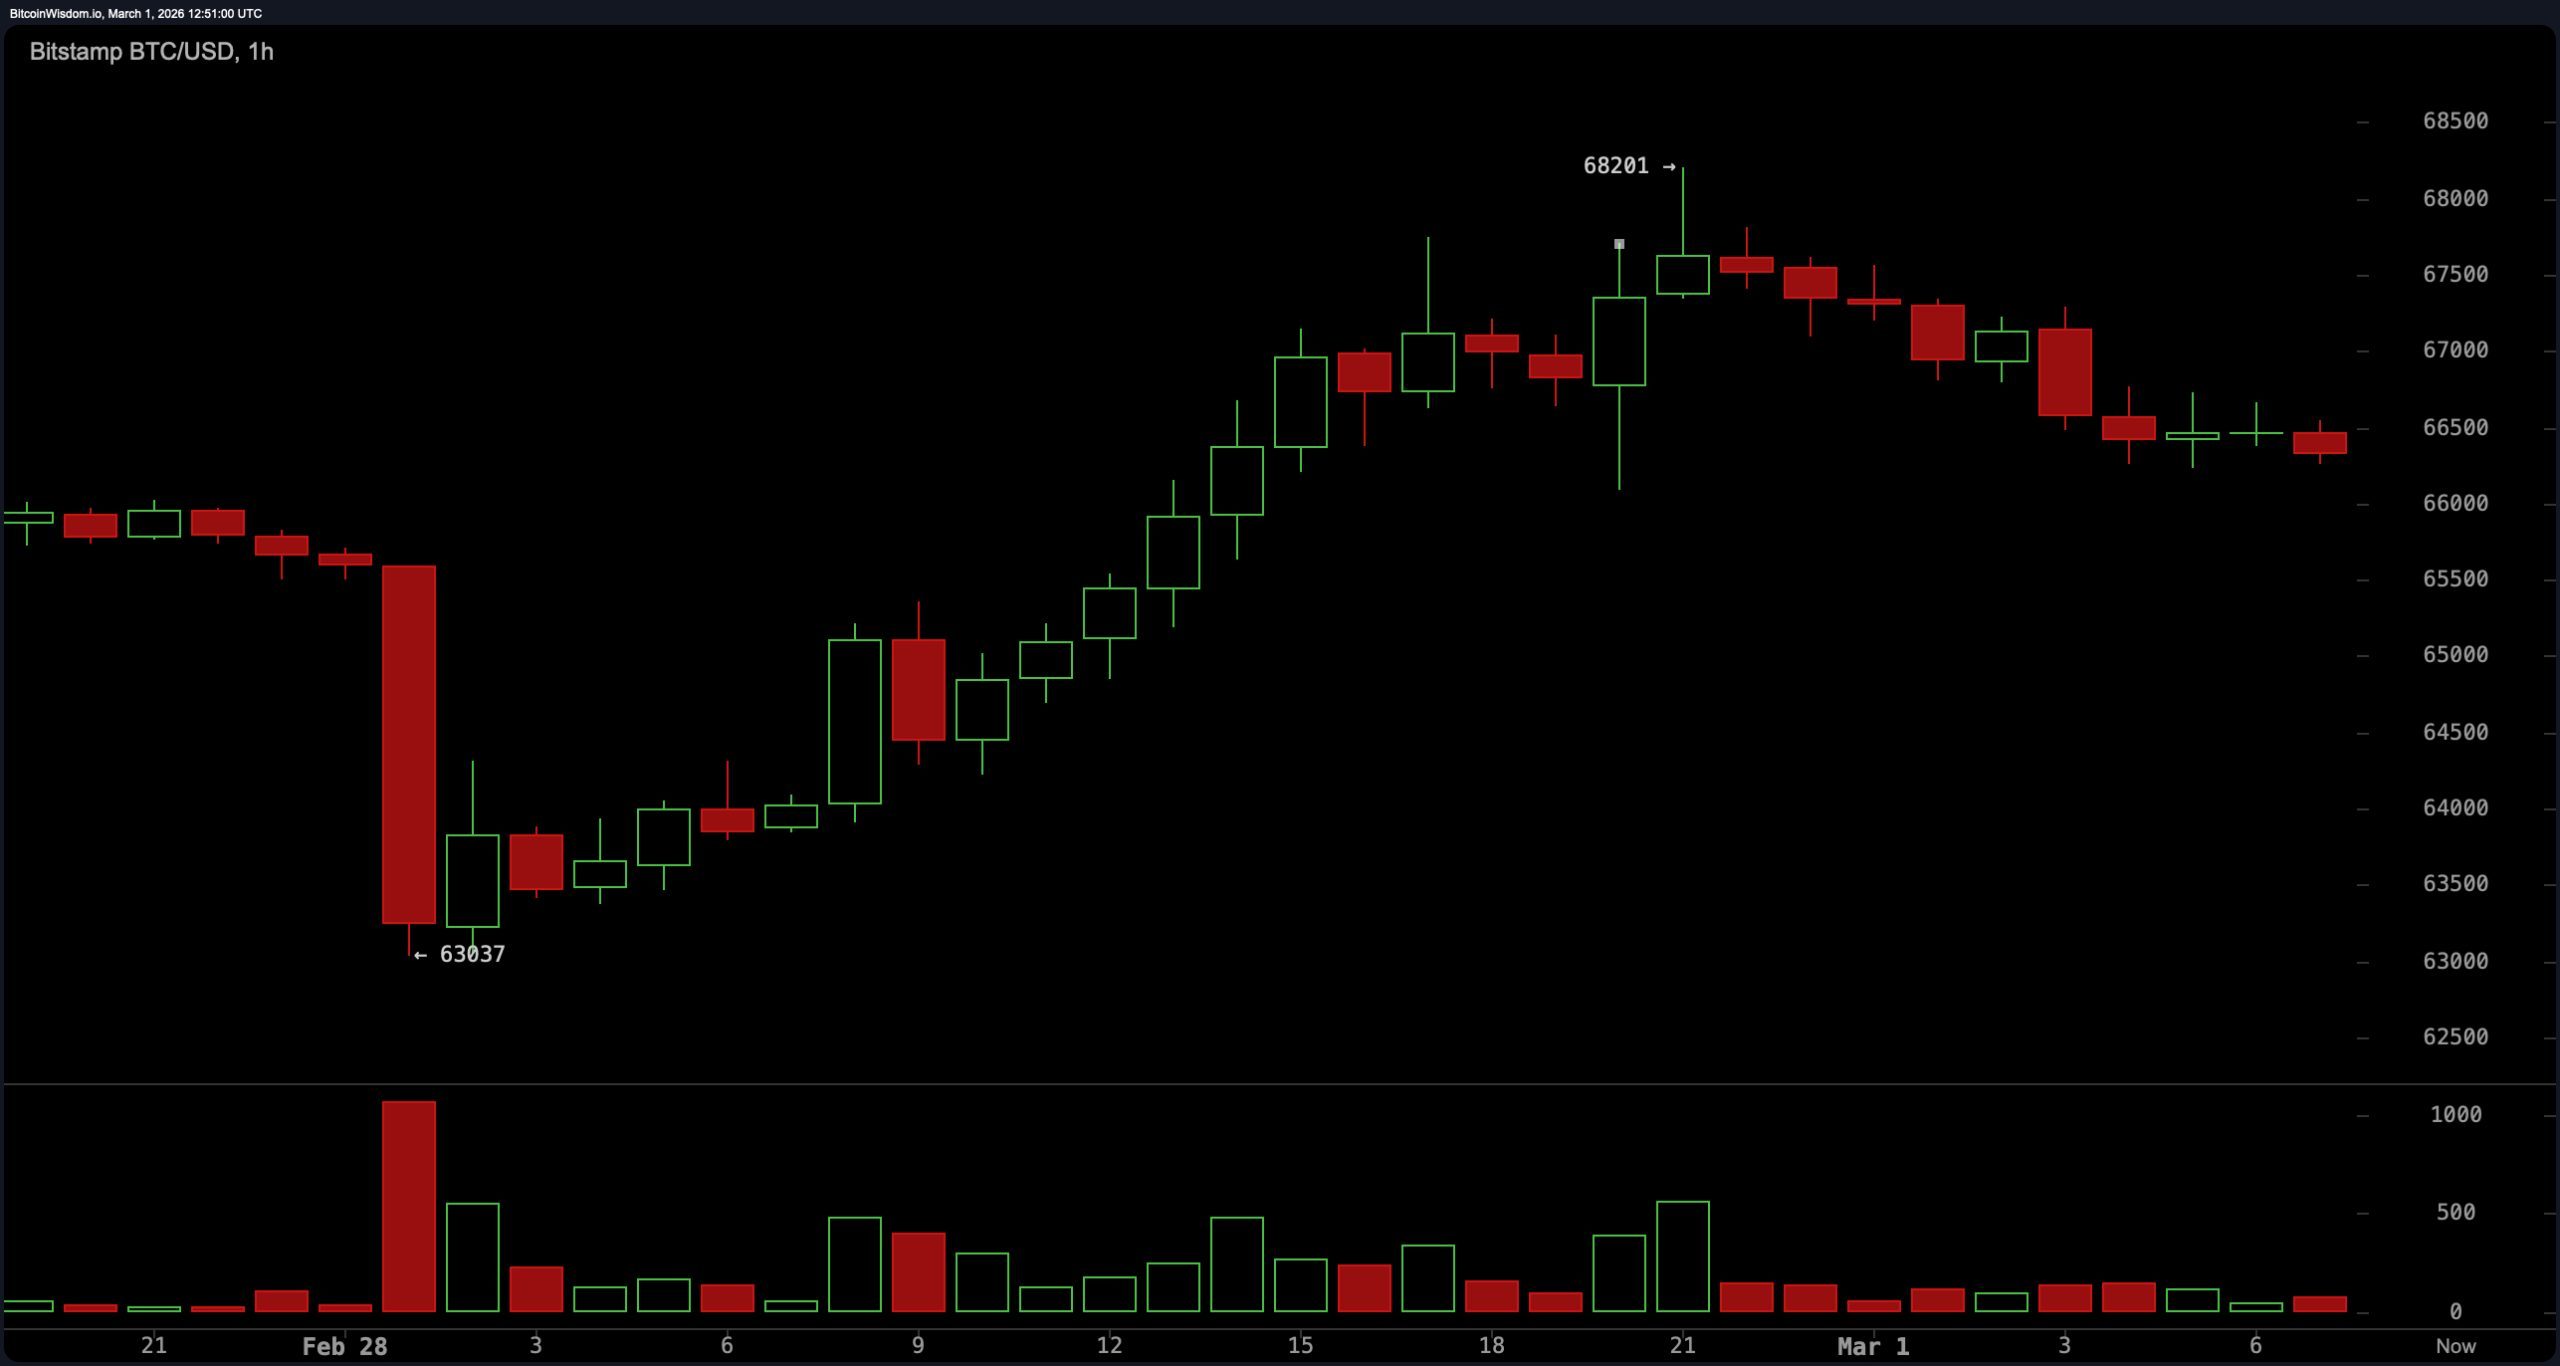
The one-hour bitcoin chart shows a sharp sell-off into $63,000, followed by a clean higher-high advance to $68,200, only to stall and begin forming lower highs near $67,000. The short-term trend has shifted from recovery mode to neutral-to- bearish, reflecting cooling momentum after a failed breakout attempt. A one-hour close below $63,000 would confirm renewed downside pressure toward $61,000 and potentially $59,900, while a sustained move above $68,500 to $69,000 would reopen a test of $70,000. Compression at this level typically precedes expansion; the market is coiling, not sleeping.
Oscillators are mixed but lean cautious. The relative strength index ( RSI) reads 40, the Stochastic oscillator stands at 48, and the commodity channel index (CCI) prints negative 29 — all categorized as neutral. The average directional index (ADX) at 50 signals trend strength without directional bias, while the Awesome oscillator registers a negative 4,465 in neutral territory.
Momentum shows a negative reading of 604 with a downside signal, whereas the moving average convergence divergence ( MACD) level prints a negative 2,772 reading with an upside signal. This divergence between MACD and raw momentum points to internal conflict: trend pressure remains, but directional conviction is fractured.
Moving averages (MAs), however, are unambiguous. Bitcoin trades below every listed exponential moving average (EMA) and simple moving average (SMA) from short- to long-term duration. The 10-day EMA sits at $66,836 and the 10-day SMA at $66,696. The 20-day EMA stands at $68,457 with the 20-day SMA at $67,308.
The 30-day EMA is $70,753, and the 30-day SMA is $69,065. Further out, the 50-day EMA reads $74,999 and the 50-day SMA $77,725, while the 100-day EMA is $82,698 and the 100-day SMA $83,553. The 200-day EMA rests at $90,553 and the 200-day SMA at $97,085. All are signaling downside pressure. When price sits beneath every major moving average across the curve, the burden of proof rests firmly on the bulls — and that proof requires a sustained break above $70,000.
Bull Verdict:
A sustained break and hold above $70,000 — confirmed by a strong one-hour close with expanding volume — would invalidate the current lower-high structure and signal a structural shift on the four-hour and daily charts. Such a move would force price back above short-term resistance and begin challenging the stacked moving averages overhead, opening the path toward $72,000 and potentially $75,000. Until $70,000 is reclaimed decisively, however, upside remains conditional, not confirmed.
Bear Verdict:
Failure to defend $63,000 — particularly on a high- volume one-hour close below that level — would confirm continuation of the broader downtrend visible on the daily chart. With price already trading beneath all major exponential moving averages and simple moving averages from 10-day through 200-day, a breakdown would expose $61,000 first, followed by $59,900 and potentially $56,000 if volatility expands. Structurally, the trend favors downside resolution unless resistance at $70,000 is cleared with authority.
FAQ 🔎
- What is bitcoin’s price on March 1, 2026? Bitcoin is trading at $66,424 with a 24-hour range between $63,886 and $68,043.
- Is bitcoin in a bullish or bearish trend right now? Bitcoin remains in a broader bearish structure, trading below all major exponential moving averages and simple moving averages.
- What are the key support and resistance levels for bitcoin? Immediate support sits at $63,000, while major resistance is concentrated between $69,500 and $70,000.
- What signals could trigger the next big move in bitcoin? A confirmed breakout above $70,000 or a breakdown below $63,000 could trigger the next volatility expansion move.