Bitcoin: No Fluff. Just the Facts
11 December 2019 13:25, UTC
.png")
Source: StockCharts BTC/USD
Market Analysis December 2019: Bitcoin (BTC) is currently trading at $7,300 per unit, and trending strongly bearish vis-a-vis the 50-day moving average and the 200-day moving average. The short and long-term technical indicators for BTC indicate that the bears are back. As a case in point, consider the 50-day moving average (short-term indicator) of $8,234, and the 200-day moving average (long-term indicator) of $9,401, versus the spot price of BTC/USD.
By all accounts, the current price is substantially weaker, indicating that bearish sentiment has gripped the market. There were those who hoped that it would be a ‘December to Remember’ for BTC/USD, but clearly the world’s premier cryptocurrency has other designs.
.png")
Source: StockCharts BTC/USD
An important technical indicator of price movements is Bollinger Bands (20,2). Between the upper and the lower Bollinger Bands, traders will be able to see 90% of all activity that takes place. Currently, the upper range (top band) is at $7,765.67 and the lower range (lower band) is at $7,009.05. The median band (the average) is $7,387.36. At this point, the bands are constricting around the current price. If the price of Bitcoin rises above the upper Bollinger Band, it is strongly reflective of bearish sentiment.
This indicates that the market is overbought and a correction is imminent. By contrast, if the price of Bitcoin closes below the lower band this indicates that Bitcoin is oversold and a correction to the upside is imminent. In both cases, traders have clear indications about what decisions to make. An oversold market requires call options. An overbought market requires put options.
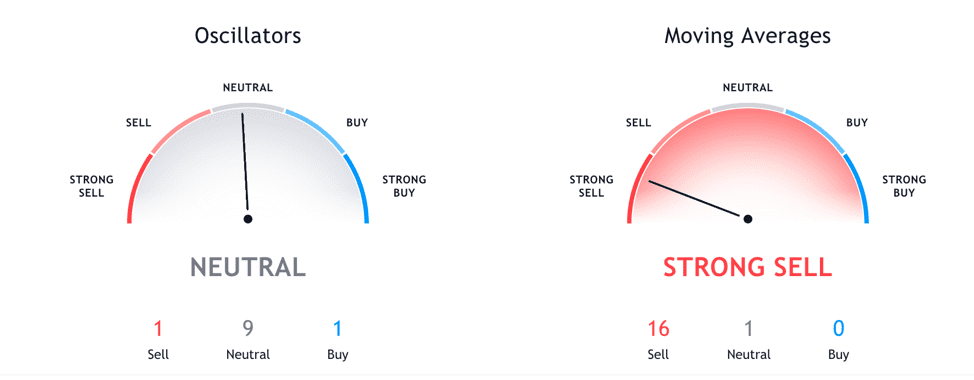
Source: TradingView BTC USD
Currently, technical analysis reveals that Bitcoin is bearish with a majority of experts recommending a sell option, or a neutral option, with very few bulls in the mix. The moving averages suggest a strong sell (50-day moving average and 200-day moving average), while the oscillators are relatively neutral. The oscillators are important technical indicators for people who trade Bitcoin. They include Relative Strength Index (RSI), stochastic indicators, average directional index, MACD (Moving Average Convergence Divergence), momentum oscillators, and Bull Bear Power oscillators among others.
Of all the current technical indicators in the oscillator category, all but two are neutral. The momentum indicators are bearish and the MACD levels are bullish. Equally important are the pivots, including support and resistance levels. Currently, the pivot point is at $7,903.55 (December 10, 2019), the resistance levels are $9,246.96 (R1), and $10,922.16 (R2). The current support levels include the first support level (S1) at $6,228.35, and the second support level (S2) at $4,884.94.
Generating Accurate Buy/Sell Signals with Technical Indicators
Another important technical indicator is Moving Average Convergence Divergence, otherwise known as MACD. This oscillator is used for the purposes of identifying bullish and bearish price trends. In the case of BTC USD, it is derived by subtracting the 26-day EMA (exponential moving average) from the 12-day EMA (exponential moving average). We can then determine the signal line which is the 9-day EMA.With the 9-day EMA, greater emphasis is placed on recent information. This is how the EMA differs from the MA. The EMA is a direct derivation of actual changes in the price of BTC over time. When the MACD moves above the signal line, this is regarded as strongly bearish. When the MACD moves below the signal line, this is identified as a bullish move. MACD is but one of several important technical indicators that can be used to identify bullish or bearish momentum in the markets.
It is important to carefully gauge speculative sentiment with BTC USD as this is a strong determinant of demand. If the MACD rises quickly, it indicates that BTC USD is overbought. This could signal an imminent correction. If the short-term 12-day EMA breaks away from the long-term 26-day EMA, that's the signal that Bitcoin is due for a downward correction, or a retracement. If an asset is oversold and considered undervalued, this is represented by the 12-day EMA falling away from the longer term 26-day EMA. It is important to guard against false signals with EMAs in Bitcoin trading. As with all other aspects of cryptocurrency trading, multiple indicators should be consulted to derive the most accurate signals.