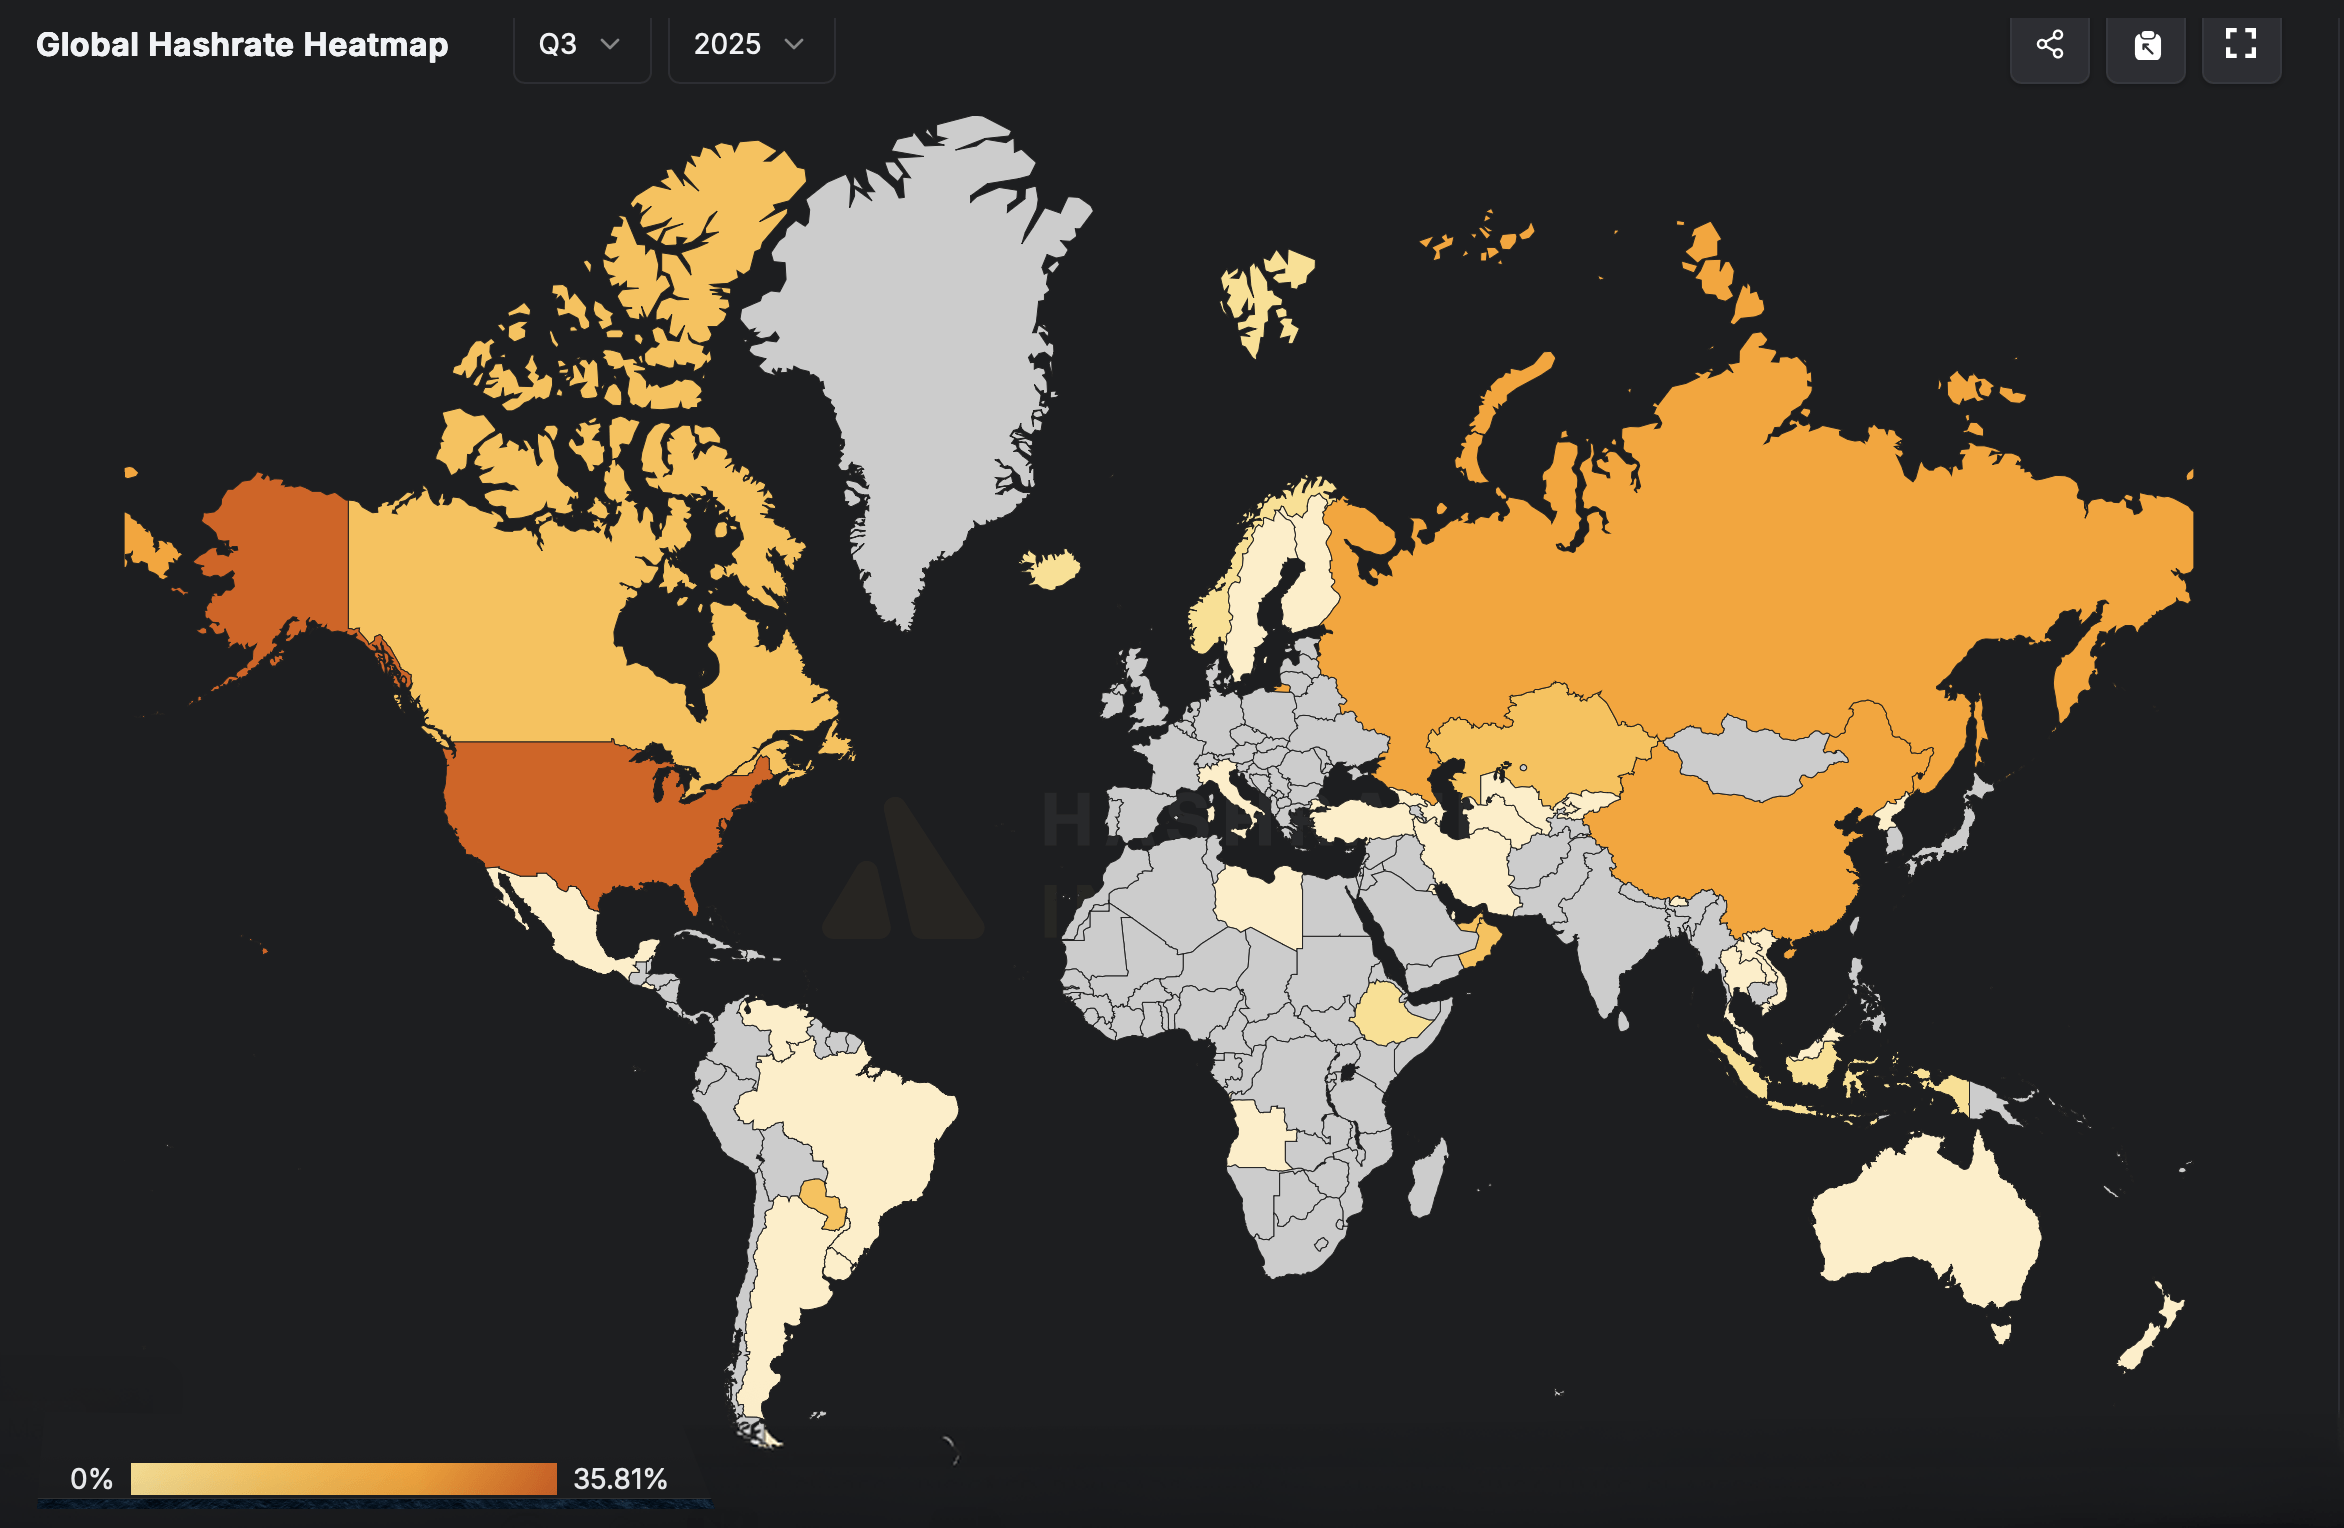
That said, it’s a slight dip from our previous report, where the U.S. stood at 36.025%—a small 0.60% slide as the new quarter kicks off. The U.S. currently wields 323.4 exahash per second (EH/s), maintaining its lead in total computational firepower despite the slight slip in hashrate share. Other major contributors include Russia and China, each shaded in dark to medium orange tones, reflecting significant mining presence.
Russia, on the other hand, saw a 6.12% climb—bumping its share from 15.652% to 16.61%—and now commands a hefty 150 EH/s of raw mining power. China’s share inched up from 13.727% to 13.84%, now accounting for 125 EH/s of hashrate. Paraguay clocks in with 3.87% of the global total, translating to 35 EH/s, while the United Arab Emirates (UAE) holds 3.54% with about 32 EH/s of mining muscle.
Meanwhile, Oman has carved out a 2.99% slice of the pie, and Canada follows closely behind with roughly 2.935%. Meanwhile, much of Africa, Central Asia, and the Middle East remain largely inactive or unreported, depicted in gray. Notably absent from the map are countries like Greenland, North Korea, and parts of central Africa, which either have negligible mining or lack available data.
The map visually emphasizes a clear geographic imbalance, with North America, parts of Europe, and Asia dominating global bitcoin hashrate distribution. The latest hashrate shifts hint at brewing competition beneath the surface. While the U.S. still leads, Russia’s bold climb signals a potential power struggle ahead. As Q3 unfolds, the real story may lie in who’s quietly ramping up behind the curtain, not just on center stage.

 news.bitcoin.com