“ $XRP Withdrawals Dominate Binance for Seven Straight Days, Hitting 53.8% — Highest Since June 2024”
The accompanying chart, which tracks $XRP price alongside Binance deposit and withdrawal transaction shares from mid-2024 through June 2026, illustrates a clear late-stage divergence. Withdrawal activity trends upward while deposit activity weakens, signaling a sustained shift in transaction composition.
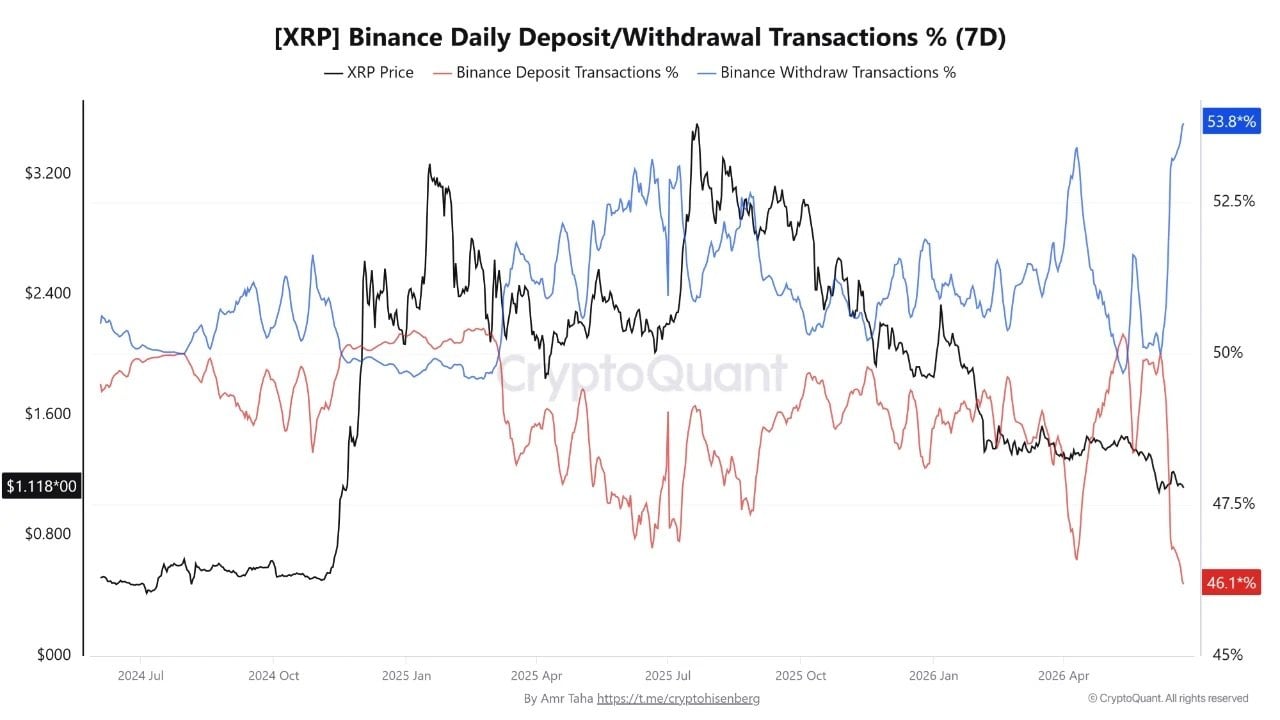
$XRP Transaction Shift Highlights Rising Withdrawal Activity
The Cryptoquant metric tracks the share of deposit versus withdrawal transactions, not the value or volume of $XRP moved, reflecting transaction frequency rather than capital flows.
An elevated withdrawal share means withdrawal transactions outnumber deposits, but it does not confirm net outflows or market direction. The divergence marks the widest visible gap near the end of the chart and persisted for a full week, pointing to a shift in exchange-use behavior, though volume and balance data are needed to assess net flows.
The analyst cautioned:
“A higher withdrawal share indicates that withdrawal transactions are outnumbering deposit transactions on Binance, but it should not be treated alone as a direct buy-or-sell signal.”
A broader view across exchanges reinforces this trend. In a separate analysis published on June 18 by the same analyst, $XRP withdrawal activity was also seen strengthening beyond Binance. Coinbase’s net depositing/withdrawing transaction reading moved deeper into negative territory, indicating withdrawal transactions were again outnumbering deposits at a more pronounced rate.
Meanwhile, Bybit recorded the sharpest reversal, as its net depositing/withdrawing transaction reading fell from roughly +27,000 on June 7 to around -200 by June 18, erasing most of its early-June deposit surge. Together, the data points to a broader shift in $XRP exchange behavior during June, although the metric measures transaction counts rather than $XRP volume or value transferred.

 news.bitcoin.com