The volatility in the crypto markets gives nimble traders the opportunity to make outsize profits. However, that volatility comes with an increased risk profile. A fragmented exchange ecosystem with different pricing can be dangerous, even for the best traders. Bookmap simplifies this by consolidating it into one single, easily accessible and customizable chart. If used correctly, Bookmap provides a vital edge in this extremely volatile space. The following article provides an overview of Bookmap’s unique features.
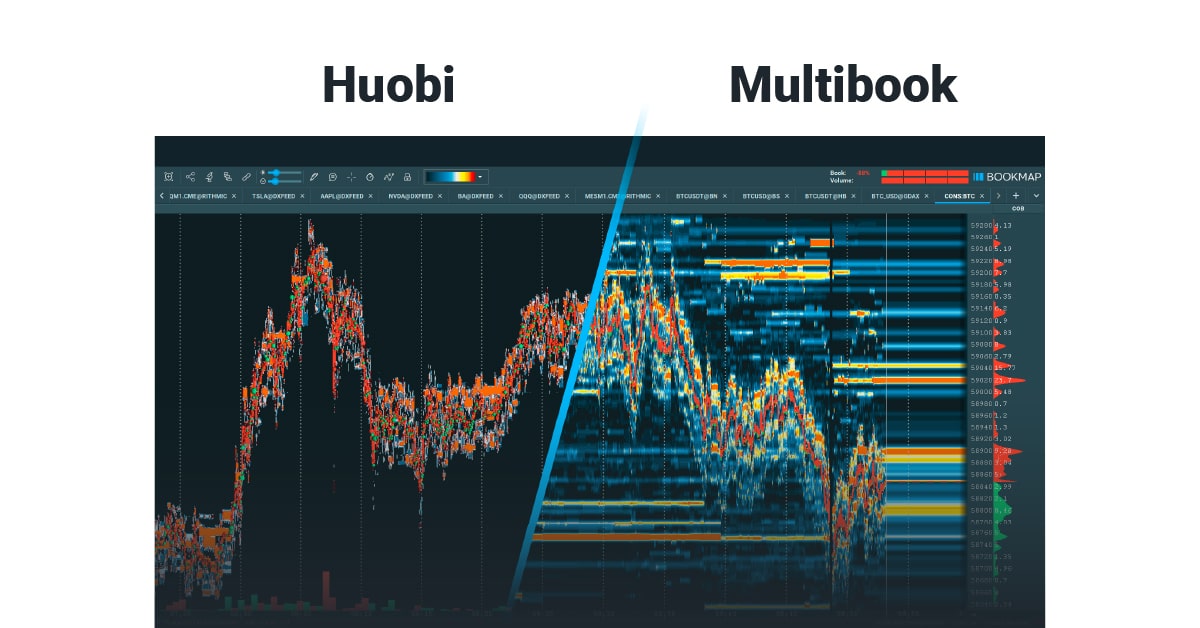
See cross-exchange cryptocurrency liquidity and volume delta in a single chart
What is Bookmap?
Cryptocurrencies are digital assets that trade 24/7. Different exchanges and trading instruments can mean it’s hard to know the true price of a cryptocurrency or trading pair. With Multibook, a trader can generate a synthetic instrument based on the liquidity and volume across multiple exchanges and plot it on a single chart. Bookmap’s heatmap and volume delta will visualize the order flow data of all market participants in real-time, even if they are trading across exchanges or completely different instruments.
Introduction to Multibook
Once you’ve downloaded and installed the Bookmap addon (see the Guide for instructions), you will see a chart that looks similar to this.
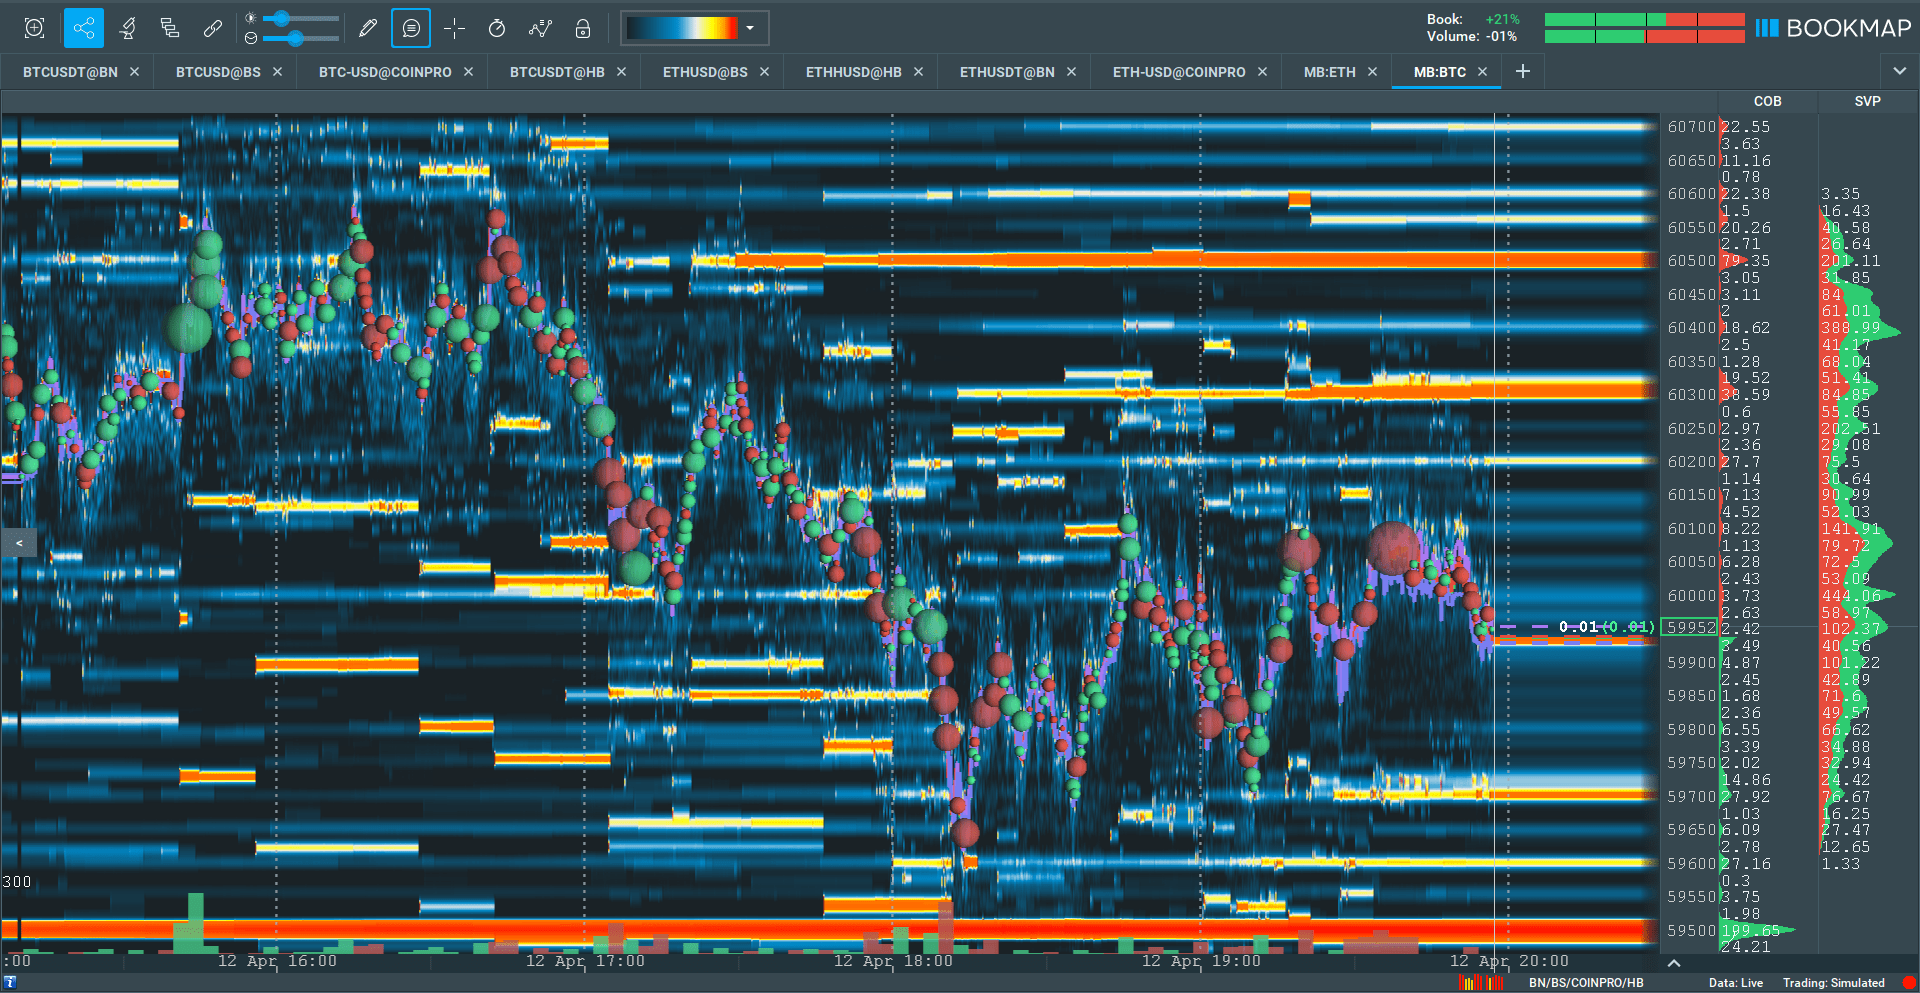
*Fig 1 – Multibook of five BTCUSD spot instruments*
This is the default chart for BTCUSD spot, and the addon also comes with default settings for ETHUSD. All the settings can be modified and you can create your own synthetic instruments from any cryptocurrency pairs and exchanges of your choosing.
Configuration
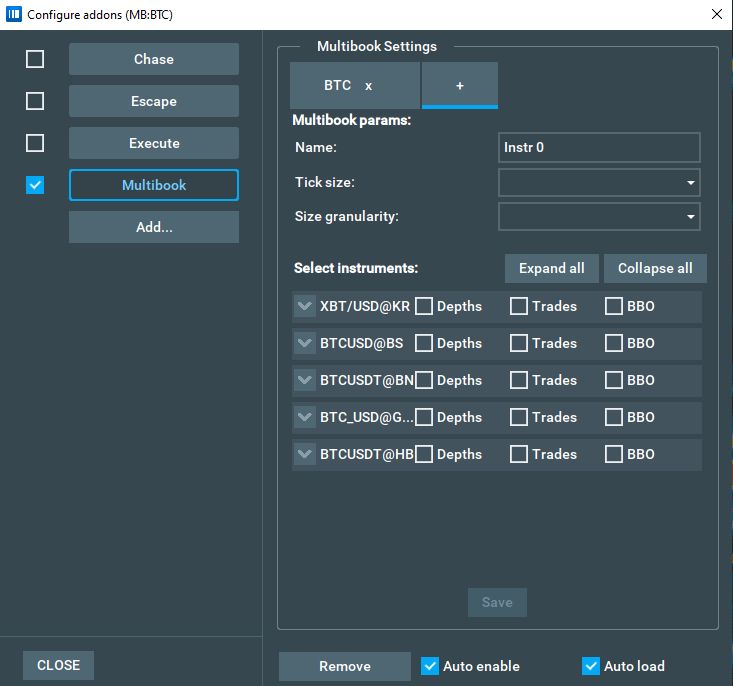
*Fig 2 – Multibook Settings panel*
If you go to Settings > Configure add-ons, and then select Multibook, you will see the settings parameters to edit or create a Multibook instrument. You can combine 2 to 5 instruments into one consolidated instrument.
First, you define a name for this synthetic instrument, then you choose the details of what you want to see from each instrument.
* **Depths**– Check this box to see the liquidity (limit order book) of each instrument combined in the Bookmap heatmap. You must select at least one to generate a chart.* **Trades**– These are the trade bubbles and volume delta that represent aggressive market order transactions. You can choose to see only the trades of a single instrument on an exchange or multiple trades across exchanges. Please note, if you select more than one instrument, you may see trades transacted above or below the best bid vs ask. This is because prices are different across exchanges, as previously mentioned. You can also edit which trades are visible after the Multibook instrument has been created.* **Best Bid and Offer (BBO)** – If you don’t select a BBO, the chart will show 2 lines by default. This is the virtual mid-price across an aggregate of the instruments you have chosen. You can also select to view the BBO of each individual instrument and modify its color. The name of the instrument and exchange is shown when you hover your mouse over the BBO lines. You can also modify which BBOs are visible after the Multibook instrument has been created.
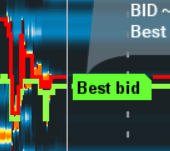
*Fig 3 – BBO lines*
The Advantages of Multibook
Absorption
Even if you are viewing the order book of the largest cryptocurrency exchange, you see only part of the picture. The trading activity and liquidity levels on the rest of the exchanges remain hidden from you.
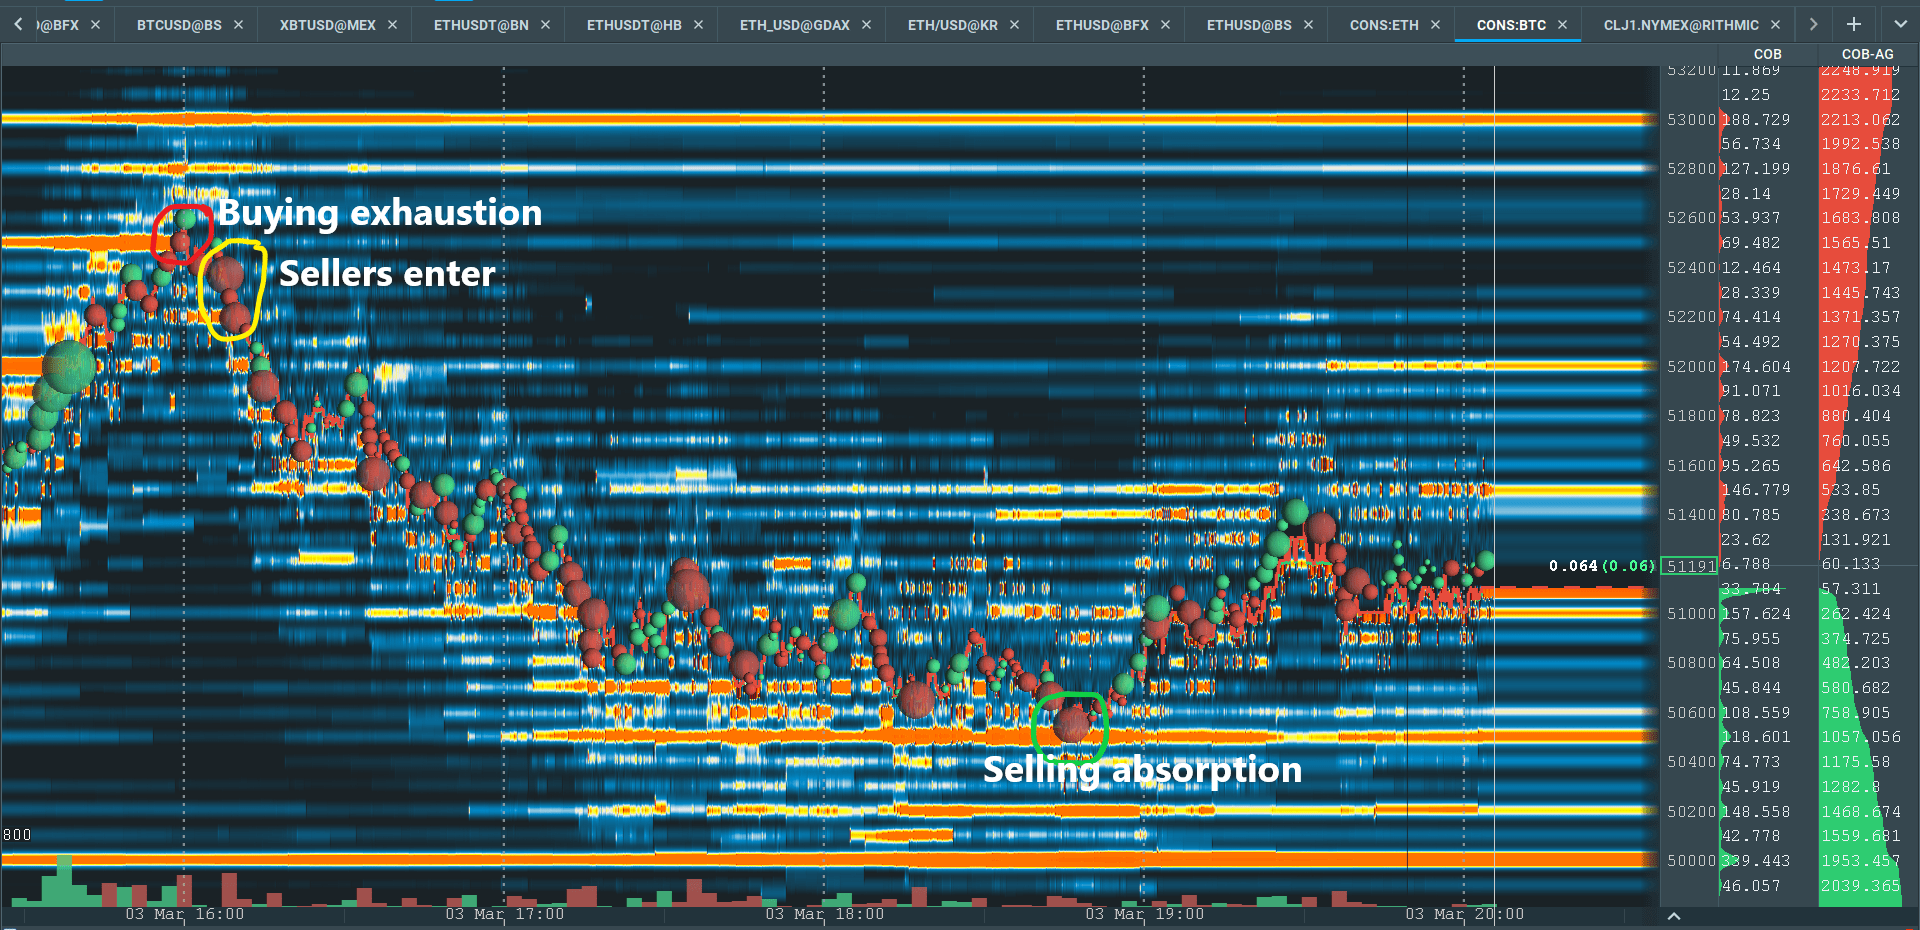
*Fig 4 – Coinbase Pro is one of the biggest crypto exchanges for spot*
At the beginning of the chart, prices are rising rapidly and buyers plow through large offers at 52,000, but large offers at 52,500 absorb the buying momentum. Aggressive buyers manage to push through the level, but having spent so much capital to meet the offers, buyers taper off and sellers enter the market.
For many Bookmap traders, this would have been a high-probability signal to get short. Prices dropped consistently for the next three hours, but just looking at the Coinbase Pro order book showed no significant area of liquidity for a profitable exit of the trade. Instead, about 2 hours after the original signal, prices just suddenly decided to rebound for no apparent reason.
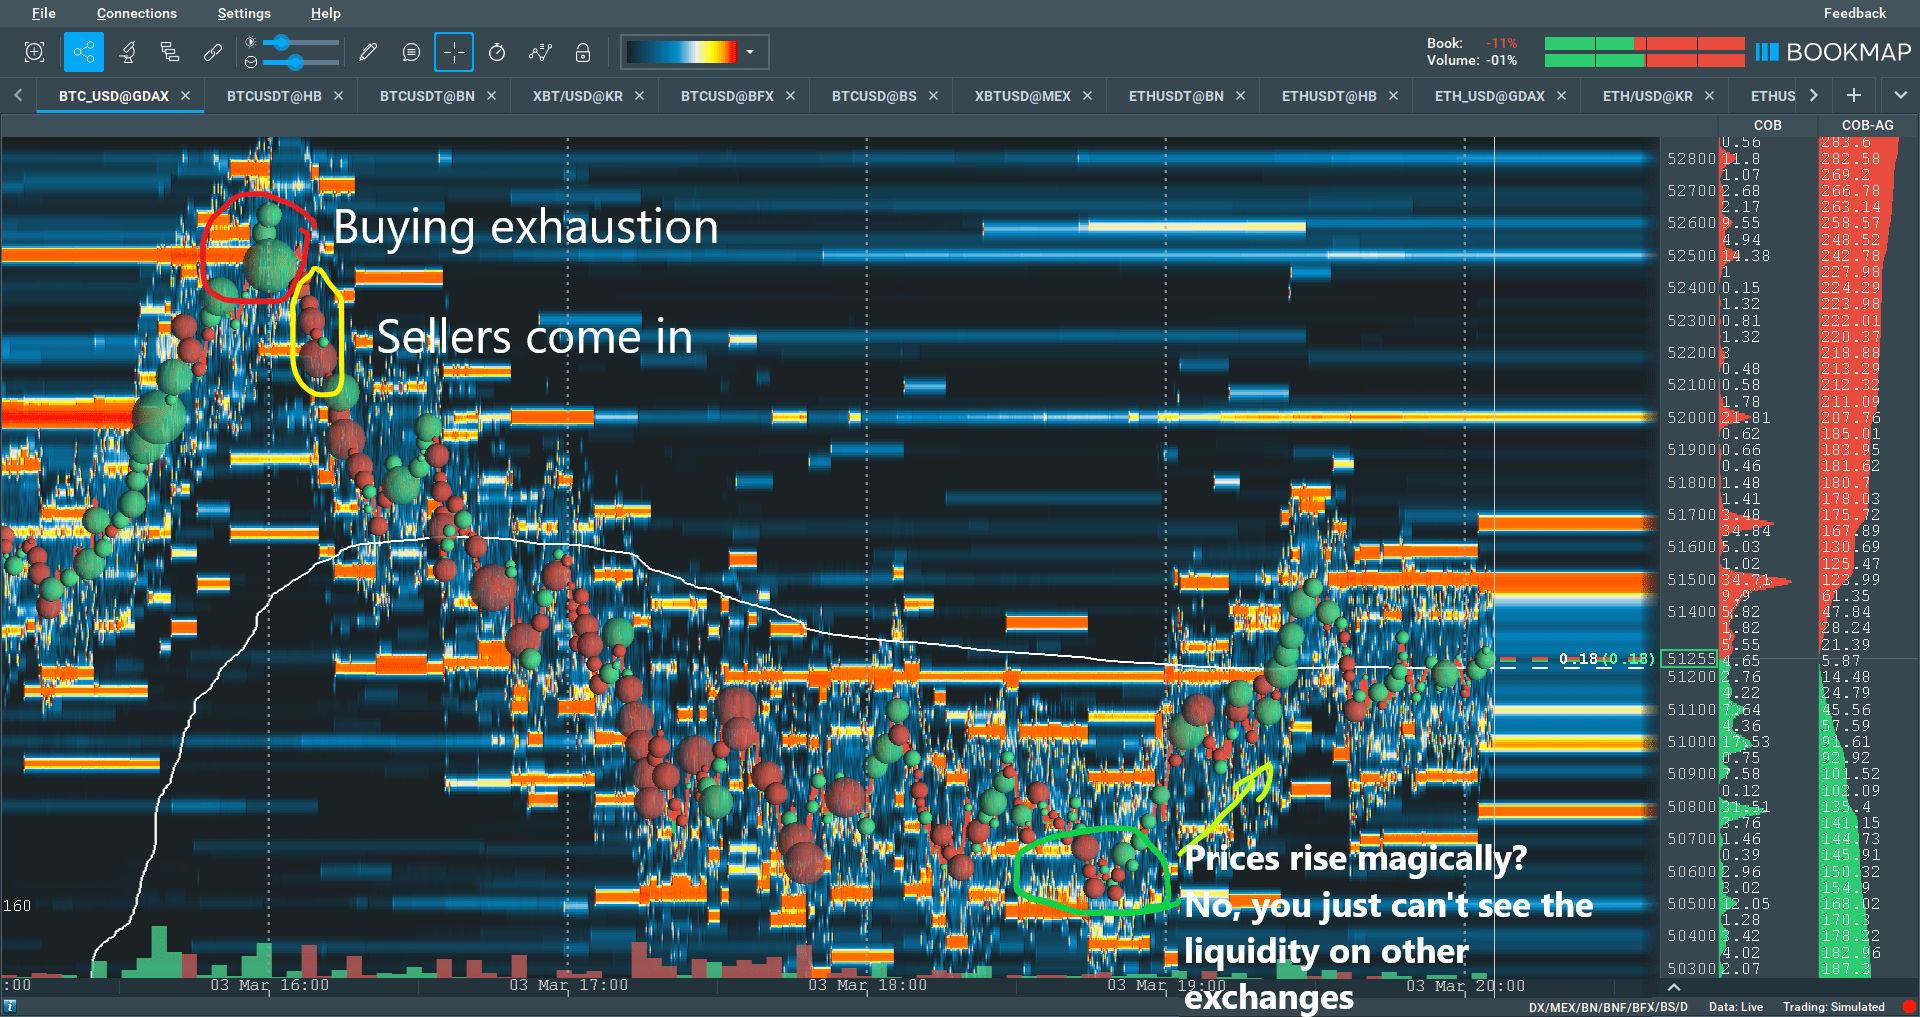
*Fig 5 – Multibook provides a clear picture of selling absorption*
However, looking at the Multibook chart we see a very clear absorption of the selling at 50,500. A trader that took an original position could take full or partial profits here, or even go long. Either way, the Bookmap heatmap of a BTCUSD pair on a single exchange showed a very clear potential entry point, but only in combination with Multibook would the trader have had the opportunity to seize as much of the $2k move as possible.
Cross-exchange Arbitrage
Because different instruments trade at different prices—even those based on the exact same asset—sometimes the price of a lone instrument can be temporarily dislocated from the average. If you have trading accounts across multiple exchanges, the ability to always choose the best price could significantly increase your P/L over time. It can also be a great trading signal.
Consider the last ETHUSD flash crash on Kraken. On February 22, 2021, the rate fell from 1600 to a low of 1120 in a matter of minutes.
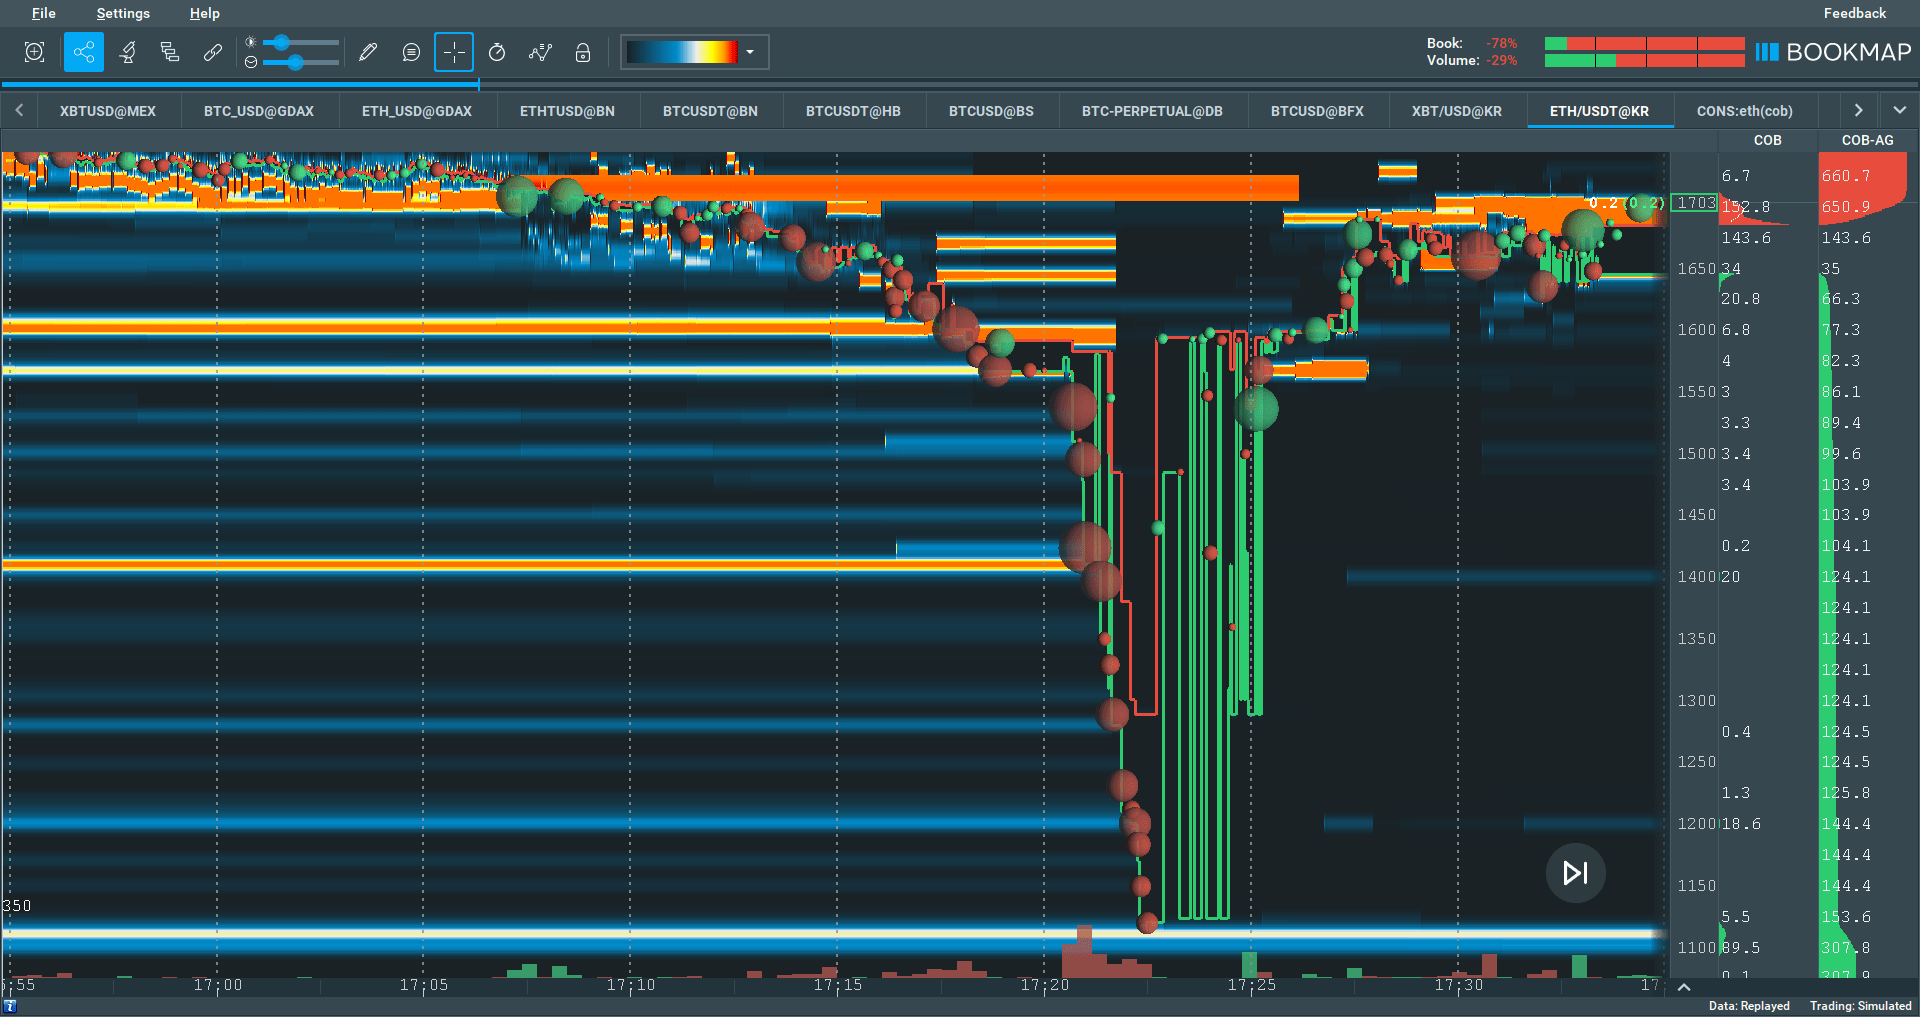
*Fig 6 – ETHUSD flash crash*
Sellers ate through bids at 1600 which then immediately flipped to the offer. The level absorbed a brief moment of market buying, before very rapidly tanking, falling through large bids at 1400 to trade smaller bids just above 1100. Spreads widened and very few trades were transacted during this time. The first reasonably sized volume delta dots appeared as spreads narrowed towards where the movement started at 1600.
While it seems that a market participant did manage to successfully trade this move (the red dot being a market sell that traded into somebody’s best bid at 1120), it’s hard to know if the transaction was a participant closing a short, a market maker balancing their books, or a trader betting that the down move was over. Either way, the reality is that trading this would be very difficult, not to mention risky.
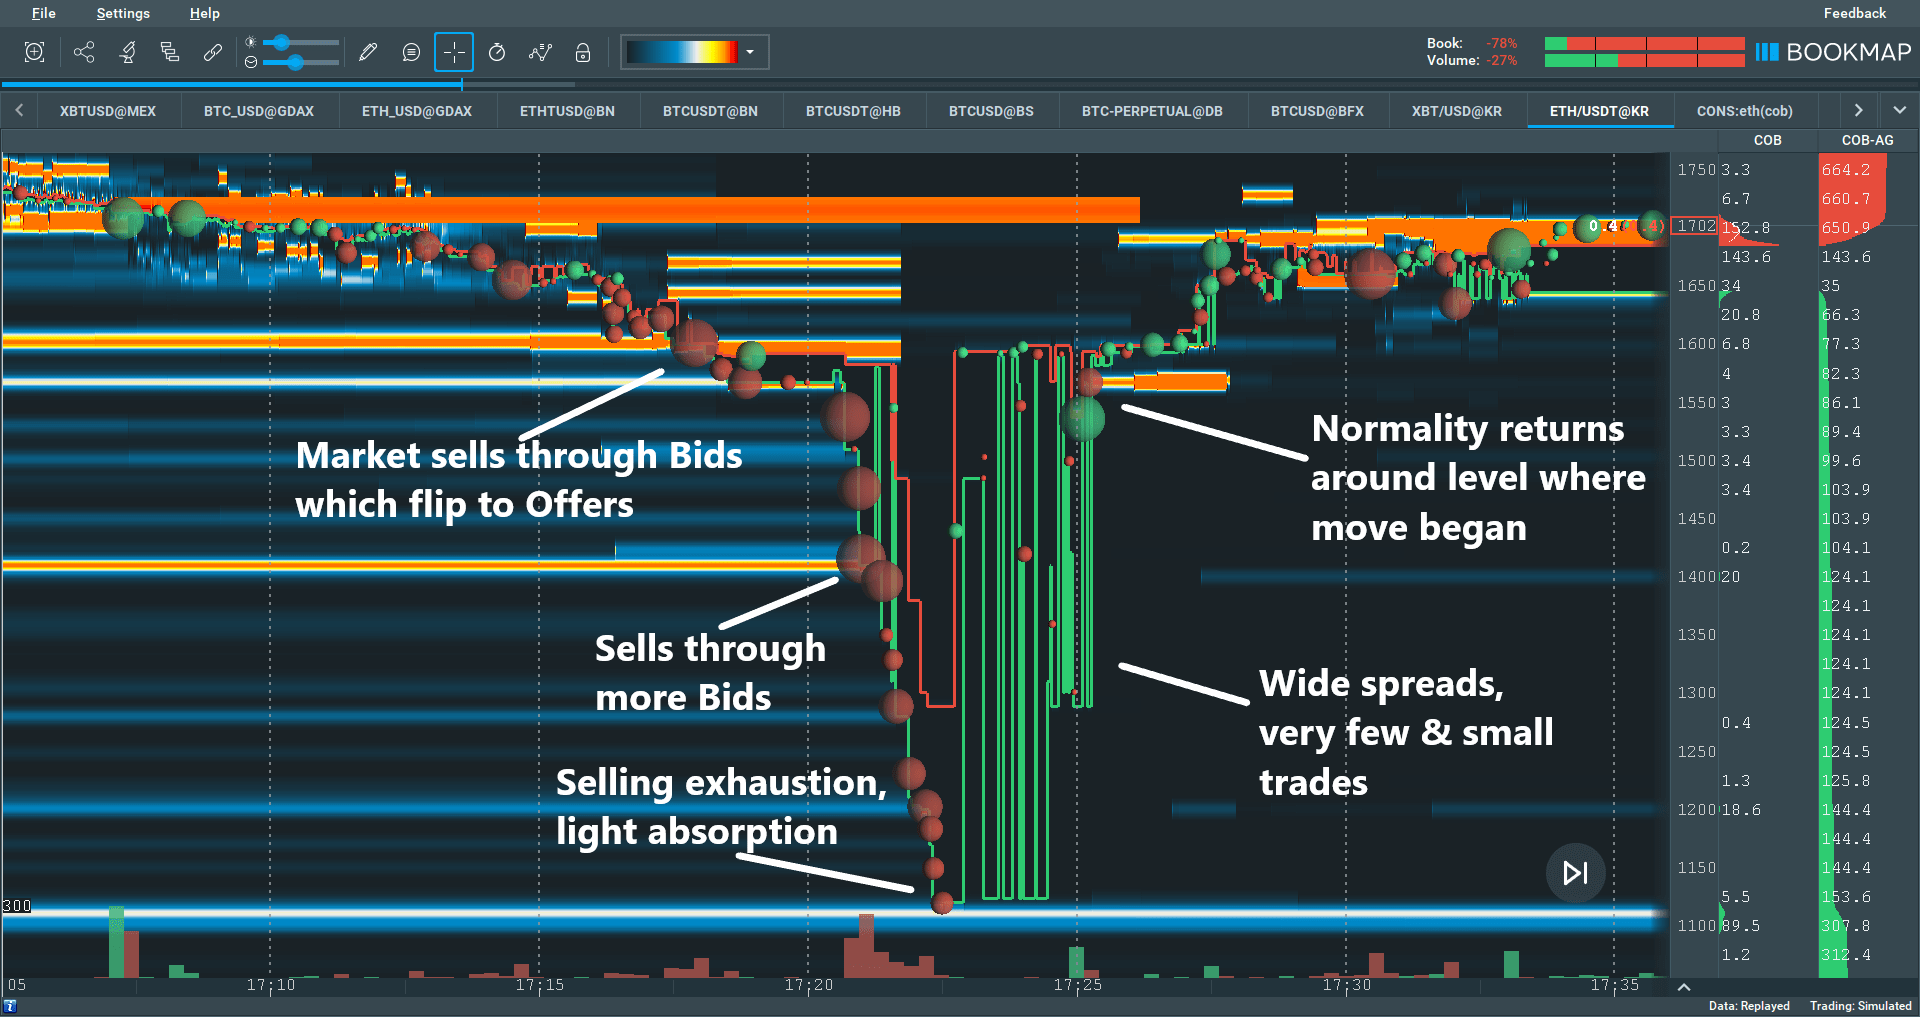
*Fig 7 – ETHUSD flash crash as seen within Multibook*
Looking at a Multibook of ETH based on 5 exchanges including Kraken, we see a clearer picture. The other exchanges only traded as low as 1510, the volume bubbles for the Kraken pair being literally off the charts.
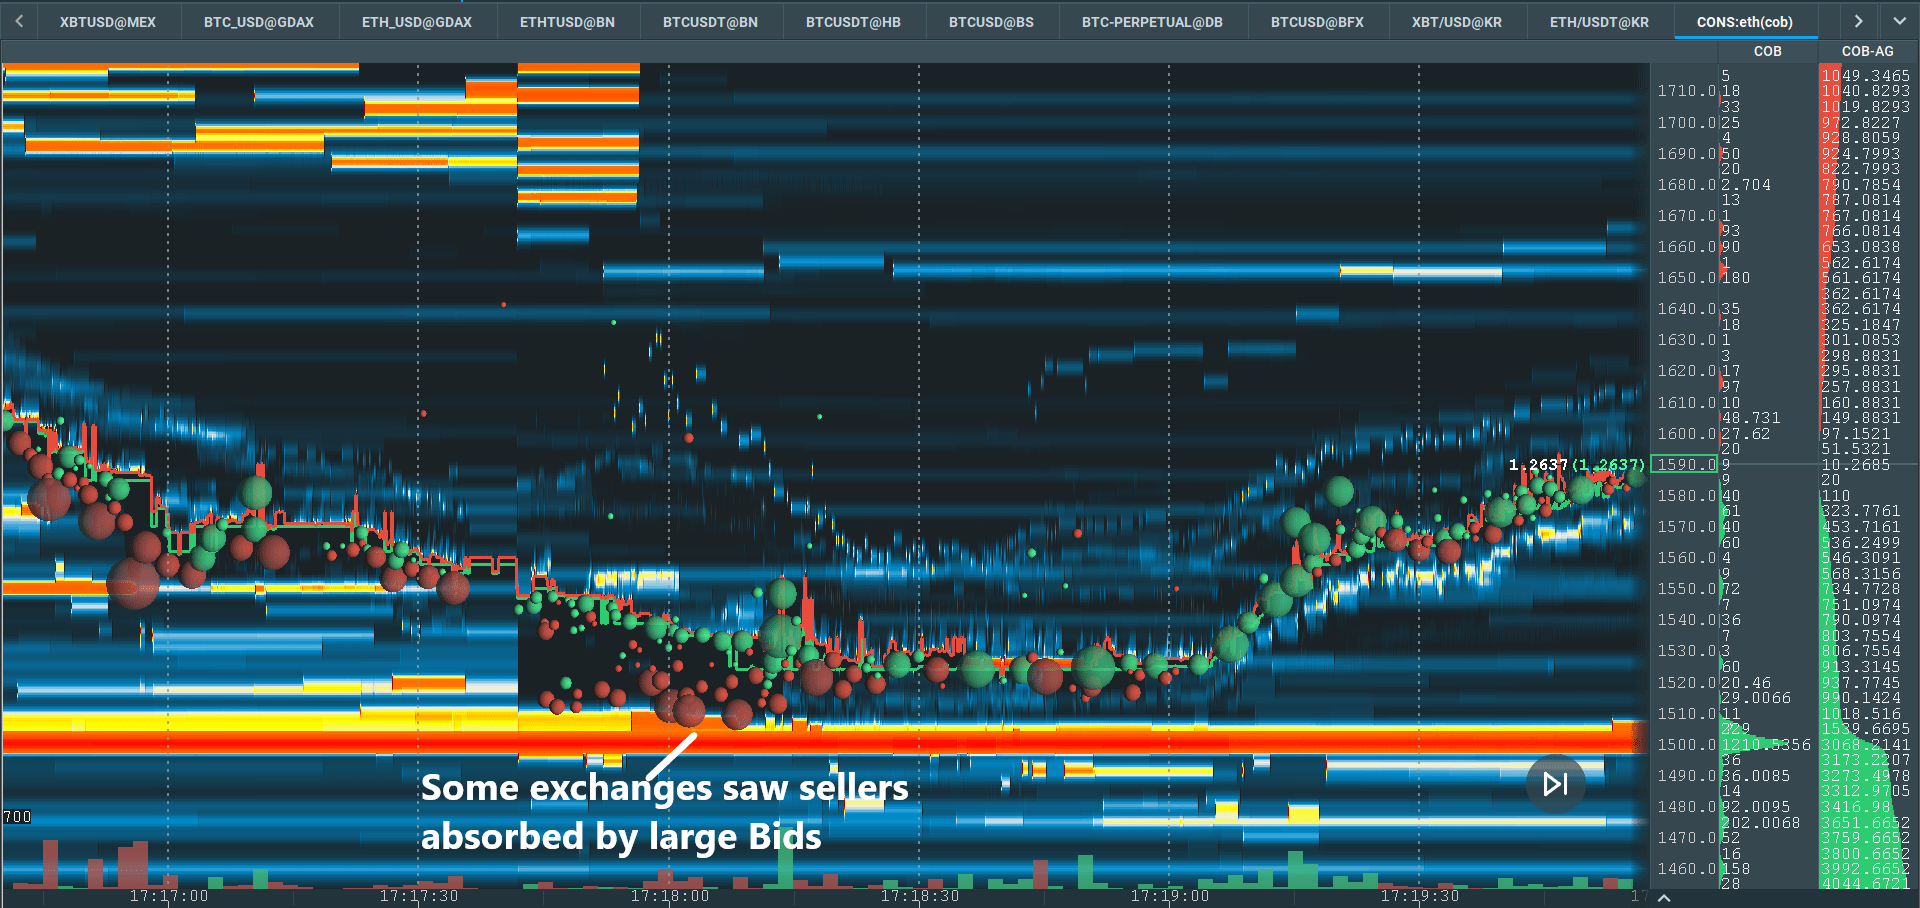
*Fig 8 – Zoomed in even further with Multibook*
Zooming into the Multibook heatmap further, we can see that some exchanges saw selling absorption of the large offers just above 1500. The selling momentum is stalling, and this could have been taken as confirmation that the rapid down move was overdone. This turned out to be the low of the day, the pair making a short term higher high minutes later and trading back up into the 1600-1700 zone almost as quickly as it fell.
Whether a trader utilized this signal to initiate a trade or just to manage risk all comes down to individual trading preferences and style. Either way, the bottom line is simple: Multibook can provide an edge even in high-volatility environments.
Conclusion
Cryptocurrencies are a truly international asset class, and this brings with it both positives and negatives. For traders, the increased interconnectivity provides the potential for more alpha generation. But all these exchanges with their different prices can be dangerous, even for the best traders. Multibook simplifies by consolidating it all into a single, easily accessible and customizable chart. If used correctly, Multibook provides that ever so vital edge in this often extremely volatile space.