Ethereum Price Prediction: Is the Decade-Long ETH/BTC Flip Finally Here?
coinedition.com
24 August 2026 10:43, UTC
The $ETH price prediction stays bullish as price pushes into a key resistance zone that’s capped every rally attempt since May, backed by accelerating ETF inflows and a wave of analysts calling for a structural shift in Ethereum’s performance against Bitcoin.
Ethereum Price Analysis: Will $ETH Price Go Up After Testing $2,450 Resistance?
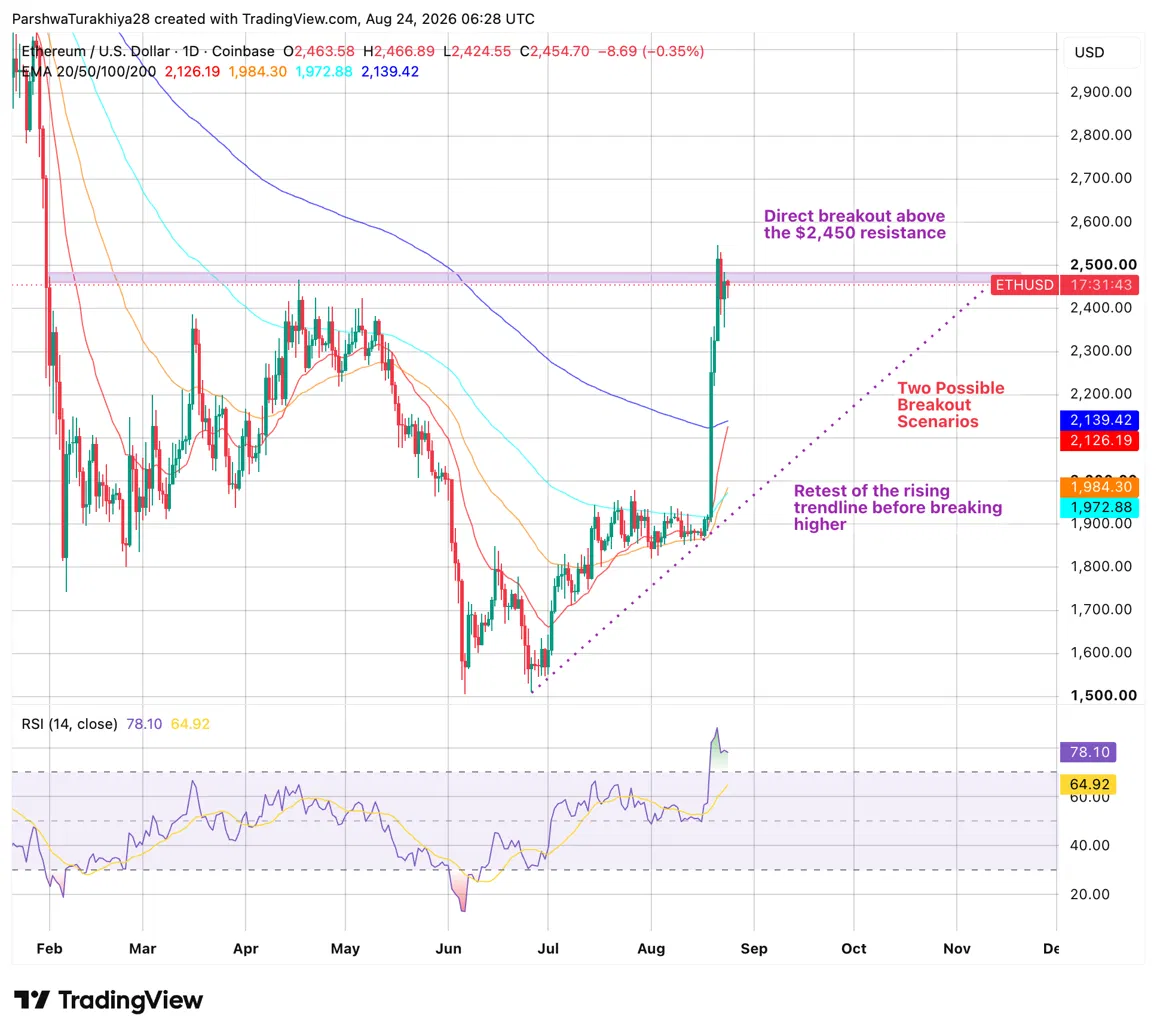
Ethereum Price Analysis (Source: TradingView)
$ETH surged sharply this week, breaking above a rising trendline connecting a series of higher lows since the June bottom near $1,520, and pushed straight into the $2,450 resistance zone that has capped every recovery attempt since May. Price touched a high of $2,466.89 before pulling back slightly to $2,454.70.
Know when your coins move
Alerts, real-time prices, and market news — all in one app
Point your phone camera to install
4.8 based on 40K reviews in the App Store and Google Play
Two scenarios are in play from here. Either $ETH breaks directly above $2,450 and continues higher, or it pulls back first to retest the rising trendline before making another attempt at the breakout. RSI currently reads 78.10, in overbought territory above the 70 threshold, which often precedes a short term cooldown even within an uptrend. All four EMAs sit well below current price, with the 20-day at $2,126.19 the nearest support, followed by the 200-day at $2,139.42 and the 100-day at $1,972.88.
$ETH Support and Resistance Levels, August 24, 2026
Type
Price
Level
Resistance
$2,450 to $2,466.89
Key resistance zone, session high
Support
$2,139.42
200-day EMA
Support
$2,126.19
20-day EMA
Support
$1,984.30
50-day EMA
Support
$1,972.88
100-day EMA
Ethereum News: Tom Lee Says $ETH Rotation Is a Decade in the Making
This is nearly a decade in the making$ETH https://t.co/fBSUdCr4Ex
— Thomas (Tom) Lee (not drummer) FundstratDirect.com (@fundstrat) August 23, 2026
Fundstrat’s Tom Lee said the rotation into $ETH is “nearly a decade in the making,” responding to a chart from analyst Don showing the $ETH/$BTC ratio breaking out of a multi-year descending trendline. The chart shows $ETH/$BTC climbing to 0.17970 after grinding lower in a falling wedge pattern since 2018, with the breakout suggesting Ethereum may be entering a period of outperformance against Bitcoin after years of relative decline.
The $ETH chart is such a bullish chart.
If this holds at 0.03, then I'm assuming we'll start to see a big breakout in the coming months.
Potential target: 0.044.
Why?
Well, with this recent breakout we're most likely going to be getting a lot of momentum going into the… pic.twitter.com/VDl2npvcKN
— Michaël van de Poppe (@CryptoMichNL) August 22, 2026
Analyst Michaël van de Poppe echoed the same bullish structure, saying the $ETH/$BTC chart looks strong and that holding above the 0.03 level could set up a bigger breakout over the coming months, with a potential target of 0.044. Van de Poppe tied the move to building momentum ahead of the Clarity Act’s expected approval, which he expects to lift the broader market.
I am extremely bullish on $ETH this cycle
The global financial system will run on Ethereum
$10,000 $ETH will feel cheap in 2-3 years!!
— borovik (@3orovik) August 23, 2026
Separately, analyst borovik said he is extremely bullish on $ETH this cycle, arguing the global financial system will increasingly run on Ethereum and that $10,000 $ETH will feel cheap within two to three years.
$ETH is having its Netflix moment.
$10,000 Ethereum will happen by 2029. pic.twitter.com/4j5Hv5hK1U
— Ted (@TedPillows) August 23, 2026
Meanwhile, analyst Ted made a similar long-term call, comparing $ETH’s current setup to Netflix’s early growth story and predicting $10,000 $ETH by 2029. These are long-term, speculative price targets from individual analysts and should be treated as opinion rather than guaranteed outcomes.
Ethereum News: ETF Inflows Accelerate for Five Straight Days
Spot $ETH ETFs pulled in $693M in net inflows over five consecutive trading days, according to analyst Emperor Osmo, with daily inflows accelerating each session from $31M to $71M to $187M to $220M and finally $184M.
Public company treasuries now hold approximately $18.8B in $ETH, representing about 6.4% of circulating supply, a figure Osmo characterized as long term buying rather than short term trading activity.
Related: Cardano Price Prediction: ADA Pulls Back 3% as Trump Memecoin Rumor Gets Debunked
$ETH is up 28% over the past seven days, and total value locked across Ethereum’s mainnet has climbed 19% over the same period to $48.7B, suggesting capital is flowing into the network alongside the price move rather than merely following it from the sidelines.
Ethereum Derivatives: Volume Rises as Longs Dominate Positioning
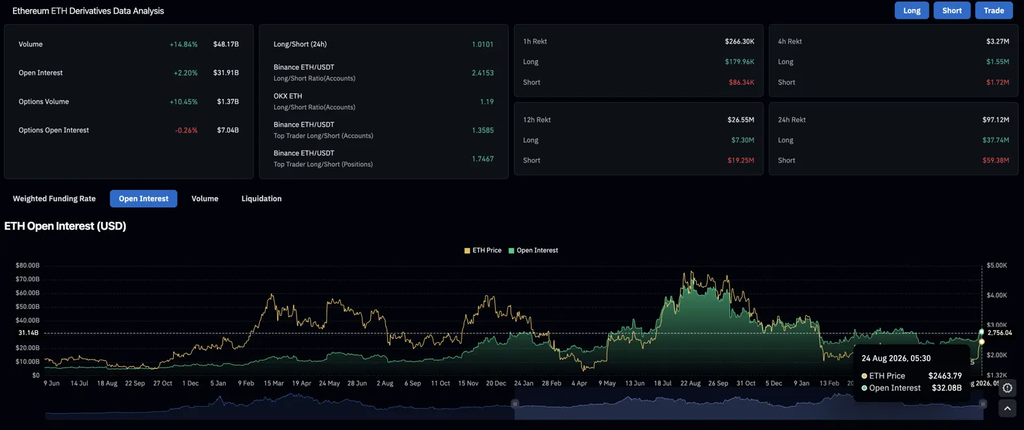
$ETH Derivative Analysis (Source: Coinglass)
Ethereum’s derivatives volume climbed 14.84% to $48.17B over the past 24 hours, while open interest, the total money locked into open positions, rose 2.20% to $31.91B, showing both more trading activity and more capital staying committed to open bets. Options volume also increased, up 10.45% to $1.37B.
Positioning is heavily tilted toward longs across major exchanges. Binance shows more than 2 long positions for every short, and OKX shows 1.19, meaning traders remain broadly positioned for continued upside.
Metric
Value
What it shows
Derivatives volume (24h)
$48.17B, up 14.84%
Trading activity increased
Open interest
$31.91B, up 2.20%
More capital staying in open positions
Binance long/short ratio
2.4153
Traders heavily favor further upside
OKX long/short ratio
1.19
Similar bullish lean on OKX
That long-heavy positioning shows up clearly in liquidations, which happen when a leveraged bet gets forcibly closed after price moves against it.
Of the $97.12M liquidated over the past 24 hours, $59.38M came from short sellers getting squeezed as price pushed higher, while longs lost $37.74M. That pattern held over the past 12 hours too, with shorts again taking the larger share of losses, suggesting sellers have continued getting caught out as $ETH pushes into resistance.
$ETH Price Prediction: Upside and Downside Targets
Bullish Case, Target: $2,700
$ETH breaks directly above the $2,450 to $2,466.89 resistance zone on a daily close, avoiding a deeper pullback to the rising trendline. Continued ETF inflow acceleration, rising treasury holdings, and the $ETH/$BTC breakout analysts have flagged all reinforce the bullish case, while short liquidations continue adding fuel to the move. A confirmed breakout opens the path toward $2,700.
Bearish Case, Risk Level: $2,126.19 (20-day EMA)
$ETH fails to clear resistance and pulls back to retest the rising trendline before any further move higher, consistent with the second scenario marked on the chart. Overbought RSI conditions add to the case for a cooldown, and if ETF inflows or treasury buying slow down, price could fall further toward the 20-day EMA at $2,126.19.
Conclusion
This setup has an unusual amount of fundamental support for a chart that’s also flashing a classic overbought warning at the same time. Five straight days of accelerating ETF inflows, a genuine $ETH/$BTC trendline break, and treasury buying that looks like accumulation rather than trading are all independent signals pointing the same direction.
RSI at 78.10 doesn’t contradict that case, but it does mean the path to $2,700 may run through a pullback to the rising trendline first rather than a clean break above $2,450. The long-term $10,000 targets floated by individual analysts are worth noting as sentiment, not as a basis for near-term expectations.
FAQs
What is the Ethereum price prediction right now?
$ETH trades at $2,454.70, testing key resistance near $2,450. The bullish target is $2,700, while the bearish risk level is $2,126.19 at the 20-day EMA if $ETH pulls back to retest its rising trendline first.
What did Tom Lee say about the $ETH/$BTC rotation?
He called the rotation into $ETH from Bitcoin “nearly a decade in the making,” pointing to the $ETH/$BTC ratio breaking out of a multi-year descending trendline that’s been in place since 2018.
How strong are Ethereum’s ETF inflows right now?
Spot $ETH ETFs pulled in $693 million over five consecutive days, with daily inflows accelerating each session from $31 million up to $184 million, a pattern analyst Emperor Osmo reads as sustained demand rather than a single spike.
Are the $10,000 $ETH predictions realistic?
They’re long-term, speculative targets from individual analysts rather than confirmed forecasts, and should be treated as opinion. Analysts borovik and Ted have both floated $10,000 $ETH over a two-to-five-year horizon, but neither target is grounded in a specific, verifiable catalyst.
Is $ETH a good buy right now?
$ETH is showing a genuinely strong combination of accelerating ETF demand, rising treasury holdings, and a structural $ETH/$BTC breakout, but overbought RSI conditions add real near-term pullback risk. This is not financial advice, so weigh the bullish and bearish cases above against your own research and risk tolerance.

 coinedition.com