
Ethereum trades at $1,664 on June 15, bouncing from a liquidity sweep that bottomed near $1,500 earlier this month and now challenging a short-term downtrend line that has capped every recovery attempt since the June crash began.
$ETH Daily Chart: Liquidity Sweep Done but Downtrend Still Intact
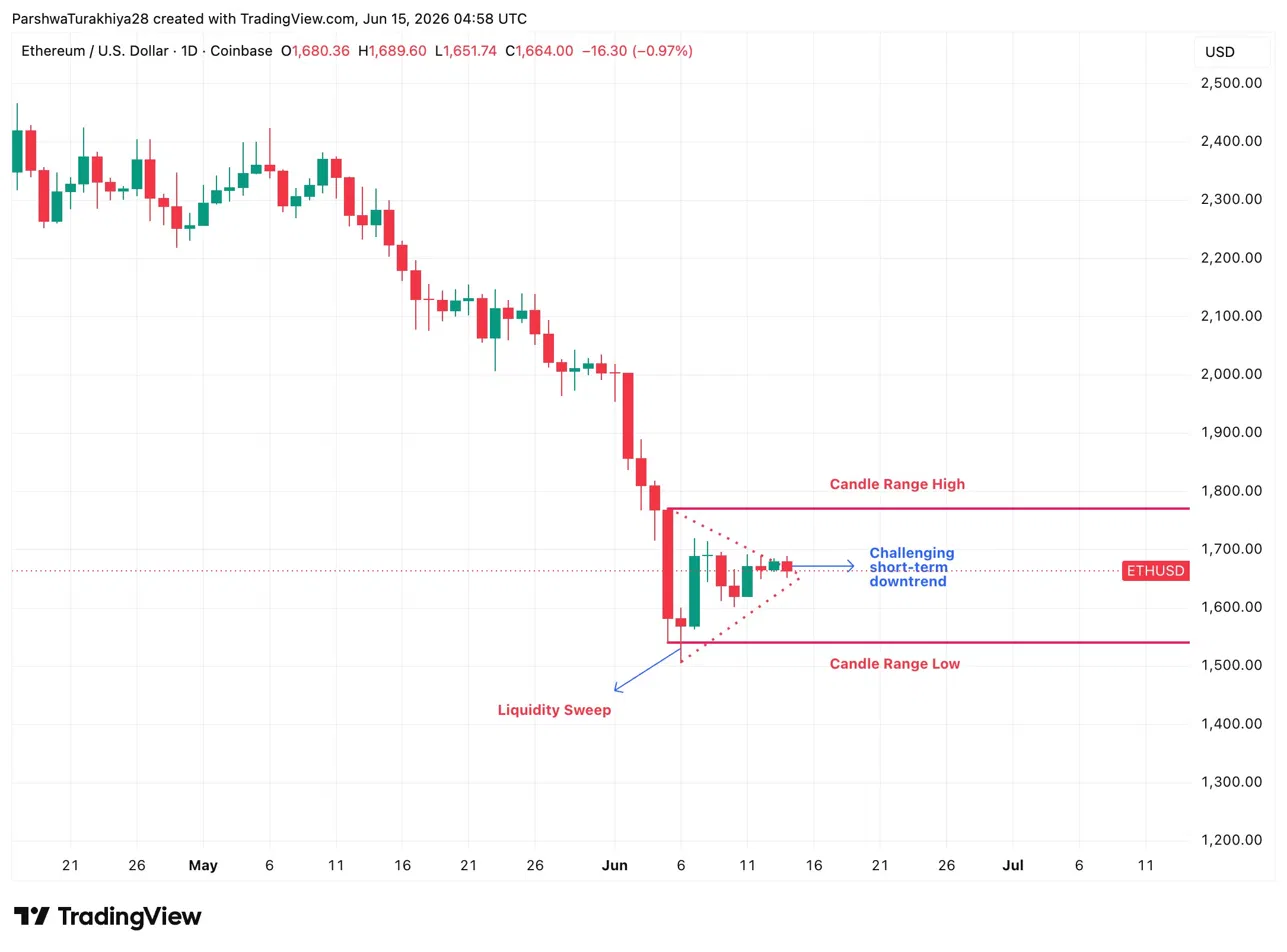
The daily chart shows a clean liquidity sweep below $1,500 followed by a recovery attempt that is now pressing against the descending trendline near $1,700. The candle range high sits at $1,800 and the candle range low at $1,500, defining the current battle zone.
Price needs a daily close above $1,700 to break the short-term downtrend that has defined every session this month.Above current price, $2,282 is the first meaningful resistance level from the weekly structure, followed by $3,335.
- Resistance: $1,800 (candle range high), $2,282 (weekly structure)
- Support: $1,500 (candle range low), $1,069 (multi-year channel support)
Saylor Says $ETH Has Lost Its Monetary Premium
Michael Saylor: Investors Have Lost Confidence in Ethereum
— Wu Blockchain (@WuBlockchain) June 13, 2026
On June 12, 2026, at the Bitcoin Corporate Day event, Michael Saylor @saylor discussed Bitcoin's rising market dominance. He stated that, excluding stablecoins, Bitcoin's dominance in the crypto market has climbed… pic.twitter.com/xWqf6ONb0a
At the Bitcoin Corporate Day event on June 12, Michael Saylor stated that investor confidence in Ethereum has collapsed. He pointed to Bitcoin’s dominance climbing from roughly 41% in 2021 to nearly 70% today, excluding stablecoins, as evidence that the market has made its choice. Saylor argued that $ETH is now locked in an exhausting competition with Solana and BNB that has drained their monetary premium entirely, leaving utility as the only remaining value argument.
The timing of the statement lands while $ETH trades at its lowest level since 2023 and has underperformed Bitcoin significantly across every timeframe this year. Whether Saylor’s framing is correct or a cycle-peak narrative from a Bitcoin maximalist, the market has largely voted with him so far.
Why $1,069 Matters More Than Any Near-Term Level
If Ethereum $ETH revisits $1,070, I believe it would present one of the best buying opportunities on the chart, according to this multi-year channel pattern. https://t.co/LNkygeXO5n pic.twitter.com/ZLHNjiUPJl
— Ali Charts (@alicharts) June 14, 2026
Ali Charts flags $1,069 as one of the best buying opportunities on the $ETH chart based on a multi-year channel pattern. That level aligns with the 2022 bear market floor before the recovery toward $4,868. A revisit of $1,069 would represent a 36% drop from current levels and would require the candle range low at $1,500 to give way first.
The setup is not a base case but it is a defined level with historical significance. Anyone holding $ETH into that zone has a clear reference point for accumulation based on multi-cycle data.
$ETH Derivatives: Shorts Got Hit Hard as Options Volume Doubled
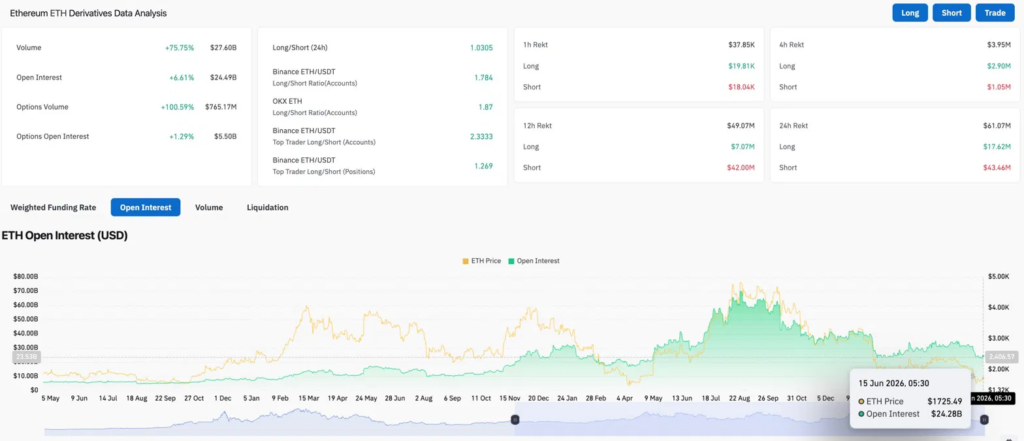
Volume rose 75.75% to $27.60B while open interest climbed 6.61% to $24.49B. Options volume more than doubled, up 100.59% to $765.17M, pointing to traders positioning for a defined move rather than spot speculation. The long/short ratio of 1.0305 sits nearly neutral.
Over 24 hours, $43.46M in short positions were liquidated against $17.62M in longs. Bears absorbed over twice the pain of bulls, consistent with the short squeeze dynamic that has driven the bounce off $1,500.
Ethereum Price Prediction for June 16, 2026
- Upside: A daily close above $1,700 breaks the short-term downtrend and targets $1,800. A hold there with continued short liquidations opens the path toward $2,282.
- Downside: A rejection at $1,700 and close below $1,600 keeps the candle range low at $1,500 in play. A break of $1,500 removes the last near-term floor and puts the multi-year channel support at $1,069 on the table.