
 ambcrypto.com

Solana [$SOL] traded near $74 after its early-July rally faded, then failed to reach $80, leaving the token trapped in a narrowing trading range.
Although July has historically been one of Solana’s strongest months, this year’s recovery lost momentum. Weak trend strength, subdued trading volume, and modest ETF inflows suggest buyers still lack the conviction needed for a sustained breakout.
Solana’s July rally lost momentum
Historically, July has been one of Solana’s strongest months, with the cryptocurrency reportedly delivering a median return of 21.4% over its previous six Julys.
This year, however, the rally fell short of those expectations.
$SOL briefly climbed above $82 during early July before surrendering much of those gains, leaving the token well below its January 2025 peak near $294.
At the time of analysis, $SOL traded at around $74.28, slightly below the Bollinger Band midpoint of $74.93.
That level now represents the first obstacle buyers need to overcome before testing the stronger $78-$80 resistance zone.
Technical indicators show a market waiting for direction
The broader technical picture suggests neither buyers nor sellers have established clear control.
Solana’s Average Directional Index [ADX] stood at 13.53, well below the widely watched 20 threshold, which typically signals a developing trend.
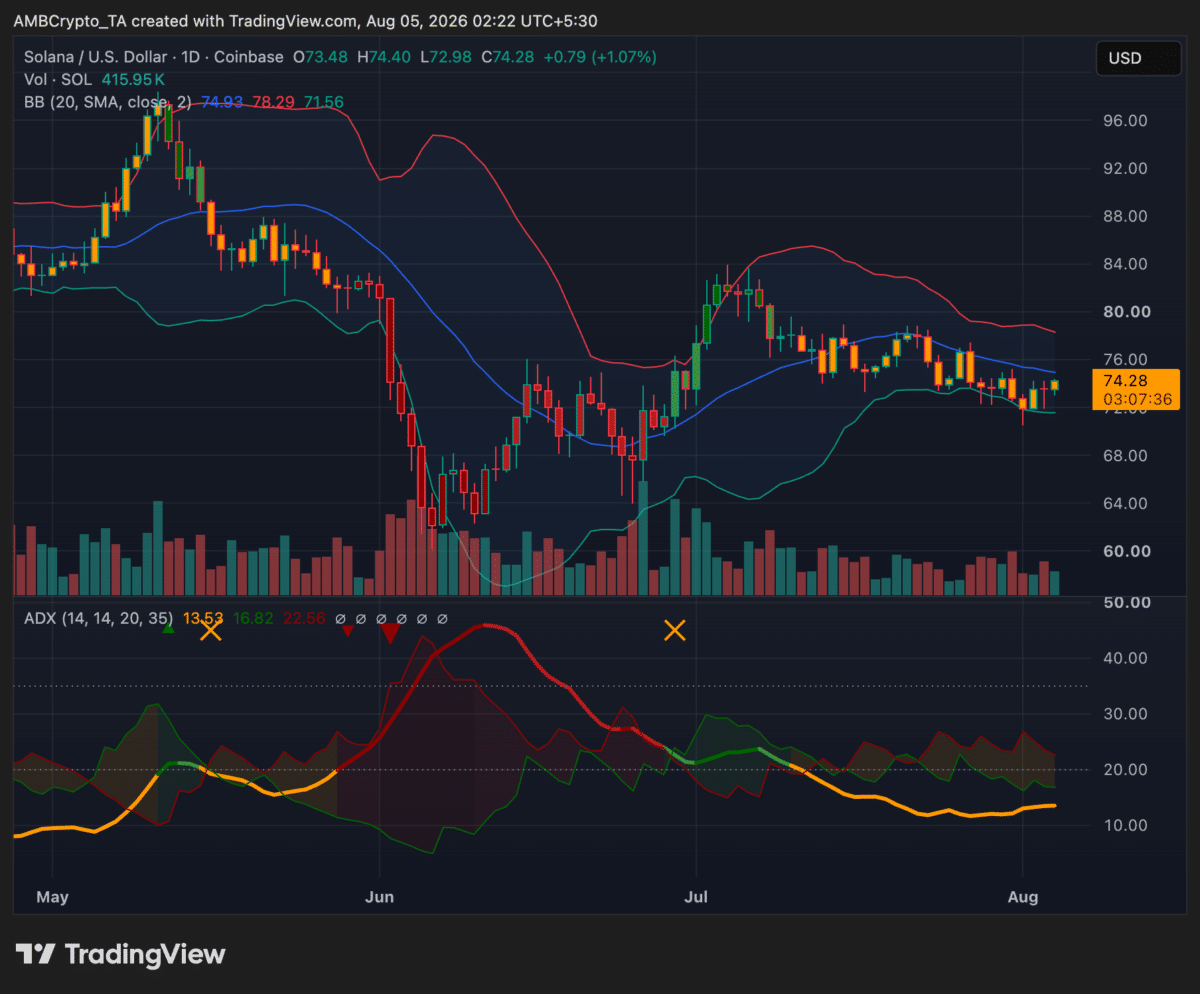
Meanwhile, the Negative Directional Indicator [-DI] measured 22.56, compared with 16.82 for the +DI, giving sellers a modest advantage.
However, the weak ADX suggests bearish momentum itself remains limited.
The lower Bollinger Band sits near $71.56.
A break below that level could expose the $68 support area.
On the upside, $SOL would first need to reclaim $78.30 before challenging the more significant $80-$82 resistance region that has repeatedly capped rallies.
Trading volume has also continued to decline since June’s sell-off and the early-July recovery, reinforcing the view that investors are waiting for a stronger catalyst before committing capital.
ETF demand remains positive but subdued
Institutional demand has continued to improve gradually.
US spot Solana ETFs held approximately $889 million in combined assets as of July 27, while cumulative net inflows reached roughly $1.16 billion.
Even so, the latest reported daily inflow totalled only around $1.03 million.
That suggests institutional interest remains positive but has not accelerated enough to provide the buying pressure needed to push $SOL through overhead resistance.
Meanwhile, Solana’s blockchain continues to record healthy levels of network activity.
However, strong ecosystem usage does not necessarily translate into immediate demand for the native token, particularly while broader market sentiment remains cautious.
Can $SOL reclaim $80?
The answer depends on whether buyers can generate enough momentum to escape the current consolidation range.
For now, technical indicators point to a market lacking conviction rather than one entering a new downtrend.
A convincing recovery would likely require:
- A move back above the Bollinger Band midpoint near $75.
- A breakout through the $78-$80 resistance zone.
- Stronger trading volume and more sustained institutional inflows.
Until those signals improve together, $SOL appears more likely to remain range-bound than begin a sustained recovery towards its early-July highs.
Final Summary
- Solana’s July rally faded before reaching $80, leaving the token trapped between key support near $72 and resistance around $78-$80.
- ETF demand remains positive, but weak trend strength and declining trading volume suggest buyers still lack the momentum needed for a confirmed breakout.