
Ethereum is testing a key support area while traders watch whether buyers can hold the latest pullback. At the same time, resistance levels at $2,400 and $2,665 keep the upside path crowded.
Ethereum Pullback Puts $2,222 to $2,036 Support Zone in Focus
Ethereum may be entering a wave two pullback, with chart analyst Man of Bitcoin pointing to a support area between $2,222 and $2,036. The setup mirrors a similar view on Bitcoin and suggests $ETH could face more short term downside before any stronger bullish continuation appears.
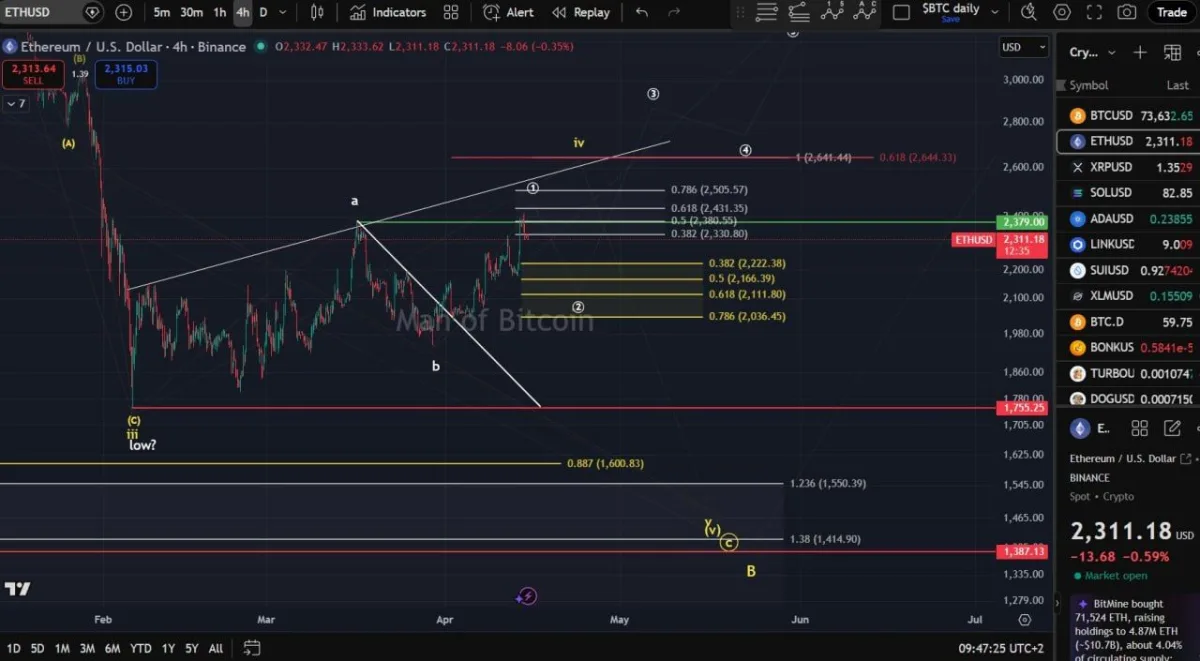
$ETH/USD 4 Hour Chart. Source: Man of Bitcoin
The 4 hour chart shows Ethereum trading near $2,311 after pulling back from the recent local high around the $2,380 area. The analyst marked the current move as a possible corrective decline, with Fibonacci support levels stacked below price. Those levels include $2,222, $2,166, $2,111, and $2,036, which together form the main support zone for the expected wave two retracement.
At the same time, the chart keeps a broader bullish structure on the table as long as $ETH holds that lower area. A white projected path shows the pullback finishing before a possible push higher in a larger wave three move. However, if Ethereum loses the $2,036 level, the chart opens room for a deeper drop toward lower downside targets shown near $1,755 and $1,387.
For now, the analysis suggests Ethereum remains in a correction phase rather than a confirmed breakdown. The key question is whether buyers step in between $2,222 and $2,036. If they do, the pullback could stay within a bullish wave structure. If not, downside pressure may grow and push $ETH into a much deeper retracement.
Ethereum Near Buy Wall as $2,400 and $2,665 Mark Next Resistance Levels
Ethereum is moving toward a key buy wall zone, while overhead resistance continues to build, according to chart analysis shared by trader CW on X.
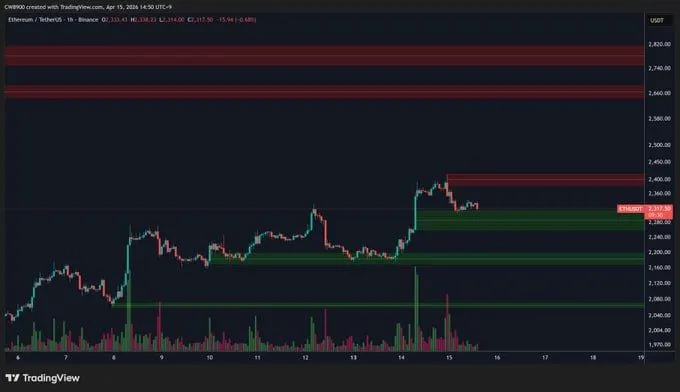
$ETH/$USDT 1 Hour Chart. Source: CW on X
The 1 hour $ETH/$USDT Binance chart showed Ethereum trading near $2,317.50 as price drifted lower into a green support area. CW said that zone represents the buy wall, where buyers may step in and try to slow the pullback. The chart also showed that $ETH recently failed to hold above the nearby resistance band after a sharp move higher.
Above current price, the first sell wall stands at $2,400. That level now acts as the nearest resistance and could limit any short term rebound. Beyond that, the next major sell wall sits at $2,665, marking a much higher barrier if Ethereum regains upward momentum.
For now, the setup points to a test of support first. If the buy wall holds, Ethereum could attempt another push toward $2,400. However, if price breaks below the support zone, the chart would suggest weakening short term demand and raise the risk of a deeper pullback.