
Ethereum price failed to hold above the $3,000 mark once again, with price slipping back toward the lower end of its weekly range as U.S. demand indicators weaken.
- Ethereum slipped below $3,000 after another failed breakout attempt, extending weekly losses.
- Coinbase Premium fell to its lowest level since 2023, showing weak U.S. institutional interest.
- Derivatives open interest rose even as volume declined, increasing downside risk near $2,800 support.
$ETH was trading at $2,930 at press time, up 1.9% on the day. Price is down 7% on the week and nearly 40% from the $4,946 all-time high set in August last year. Over the past seven days, $ETH has moved between $2,801.87 and $3,125.89, showing repeated rejection near the psychological $3,000 zone.
Spot activity has cooled. Ethereum’s ($ETH) 24-hour trading volume stood at $28.44 billion, down 6% from in the last day, pointing to fading participation during recent attempts to push higher.
CoinGlass data shows a divergence in the derivatives market. Total volume fell 8% to $56 billion, while open interest rose 3.6% to $38 billion.
This mix suggests traders are opening new positions while overall turnover slows, showing growing conviction rather than aggressive momentum trading.
Coinbase Premium falls to multi-year lows
A deeper structural problem is revealed in a Jan. 26 analysis by CryptoQuant contributor CryptoonChain. Ethereum’s Coinbase Premium Index 30-day average dropped to -0.08, its lowest level since early 2023.
The index tracks the difference in price between $ETH/USD on Coinbase and $ETH/USDT on Binance. If the reading is negative, Ethereum is trading at a lower price on Coinbase, which is commonly used as a stand-in for institutional demand in the U.S.
In the past, long-term $ETH rallies have been linked to a positive premium driven by U.S. purchases. It appears that American institutions are largely on the sidelines due to the current decline.
While global flows on Binance have helped stabilize price, the lack of U.S. participation limits upside follow-through in the near term.
Ethereum price technical analysis
Ethereum continues to trade within a declining structure on the daily chart. Price sits below all major moving averages. The 20-day and 50-day averages are clustered between $3,040 and $3,100, now acting as firm overhead pressure.
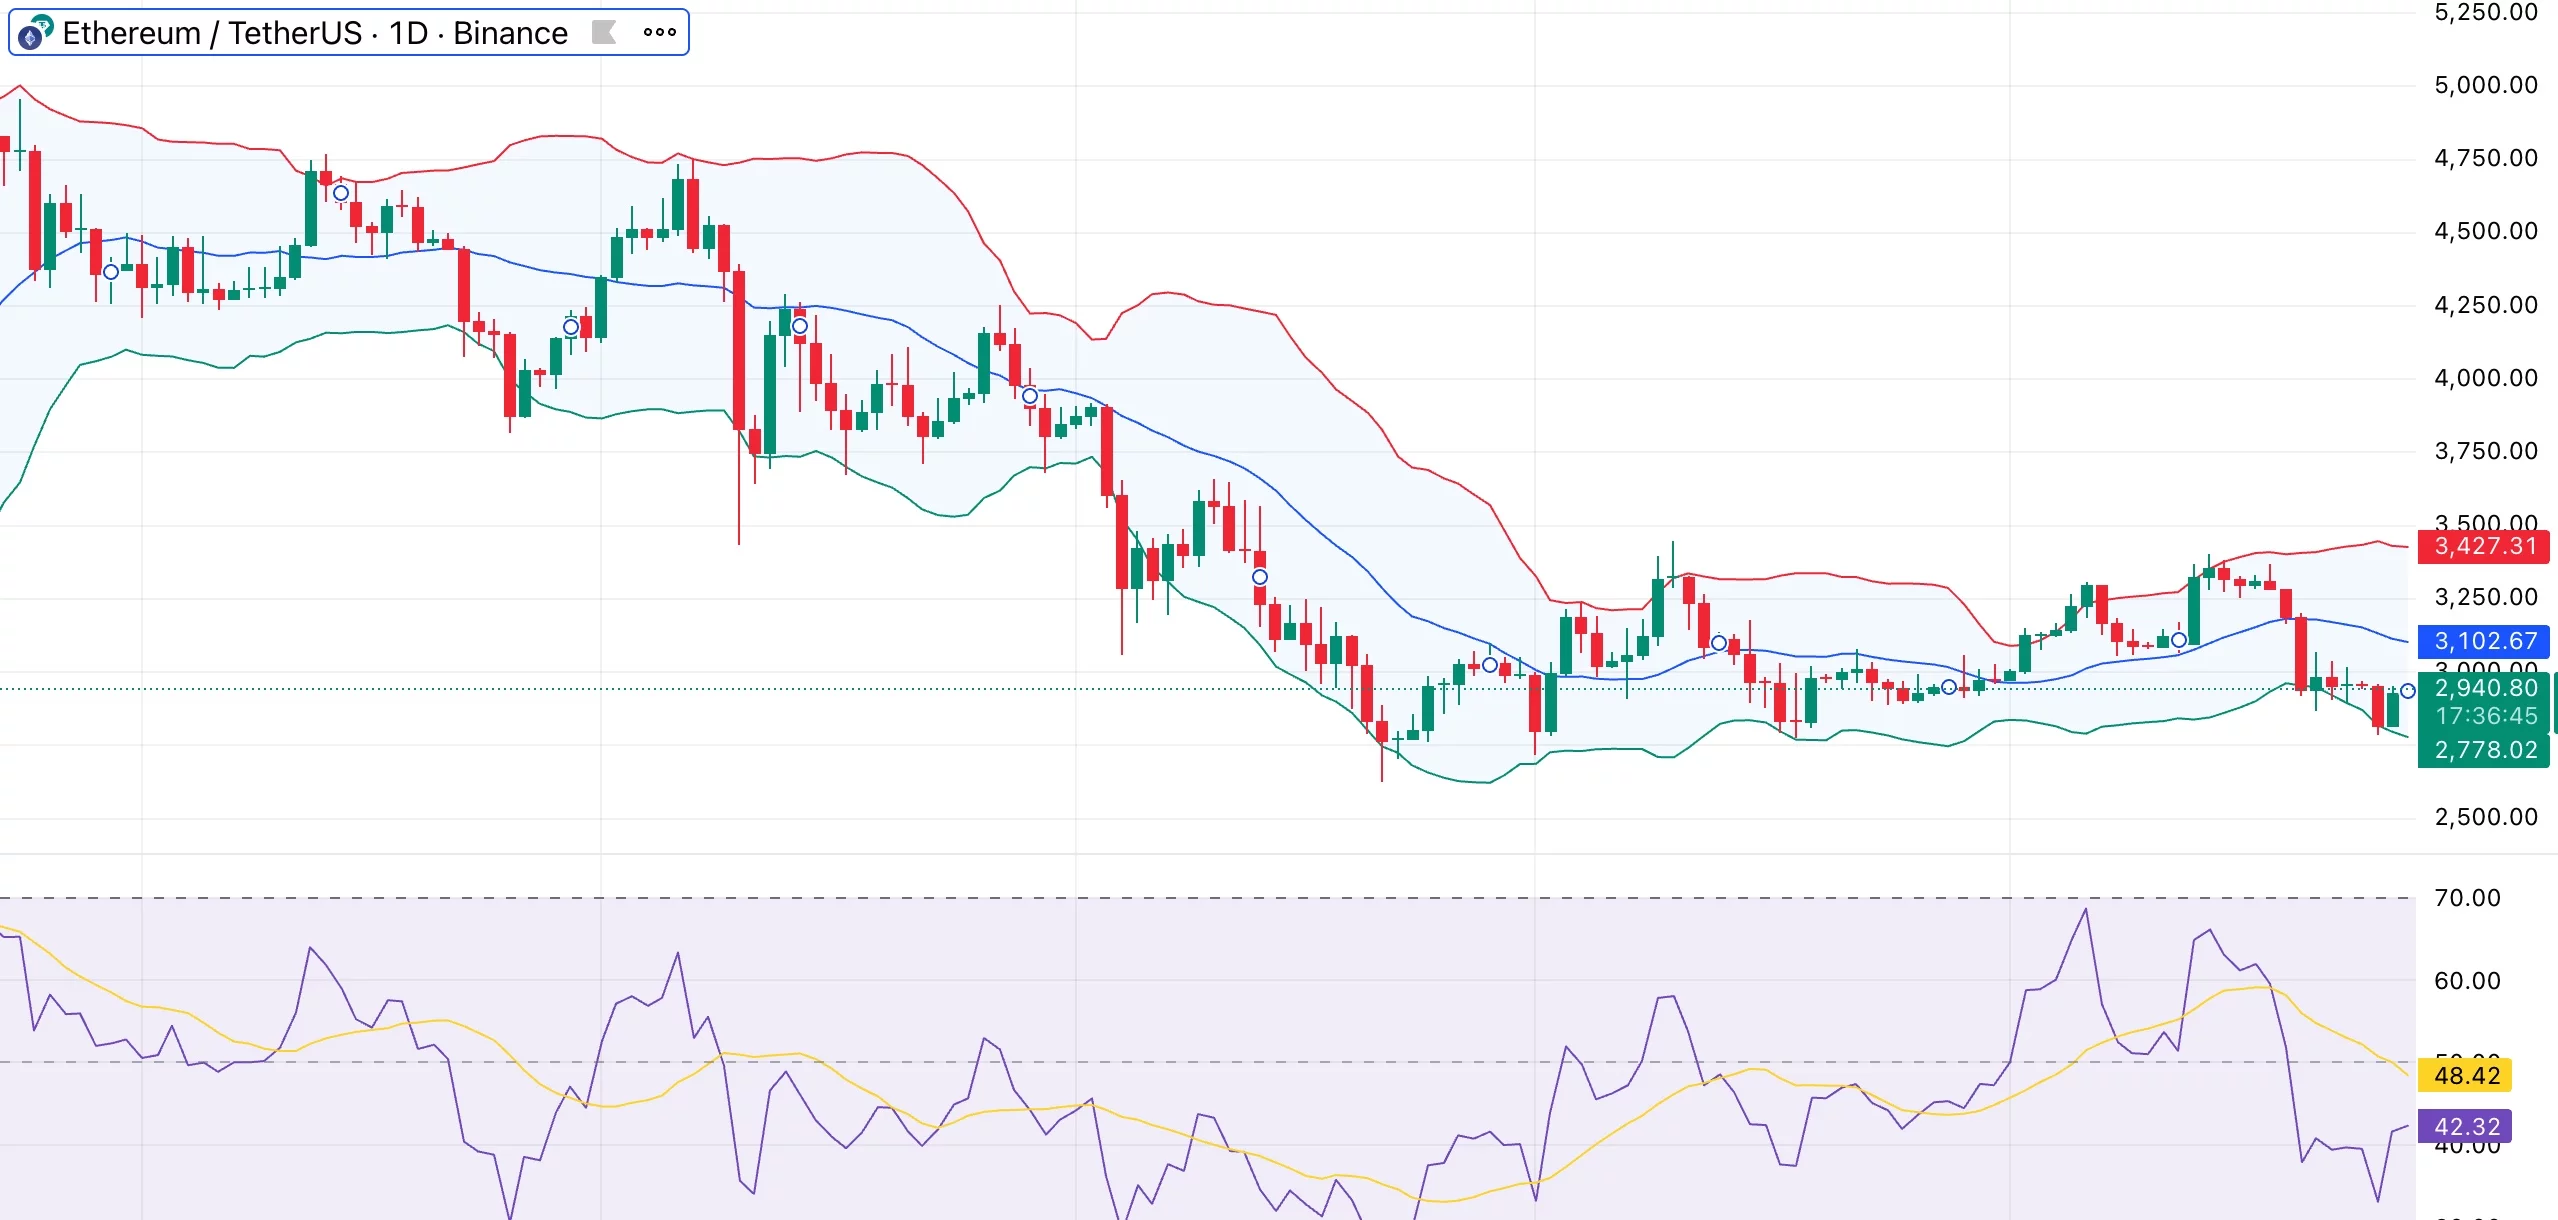
Following the recent decline, Bollinger Bands have started to narrow, indicating decreased volatility. This compression often comes before expansion. The lower band, which is slightly above $2,780, aligns with prior demand from earlier this month.
The relative strength index at 41 is below neutral, while the stochastic RSI is close to oversold territory, suggesting a slowing downward pressure. Caution is reinforced by the fact that MACD and short-term momentum readings continue to point lower.
$2,800 is still the crucial level to keep an eye on on the downside. A daily close below it would expose $ETH to a deeper move toward $2,600, where buyers last stepped in. On the upside, $ETH needs a clean reclaim of $3,050–$3,100 to reopen the path toward $3,250. Without that, rallies risk fading quickly near resistance.