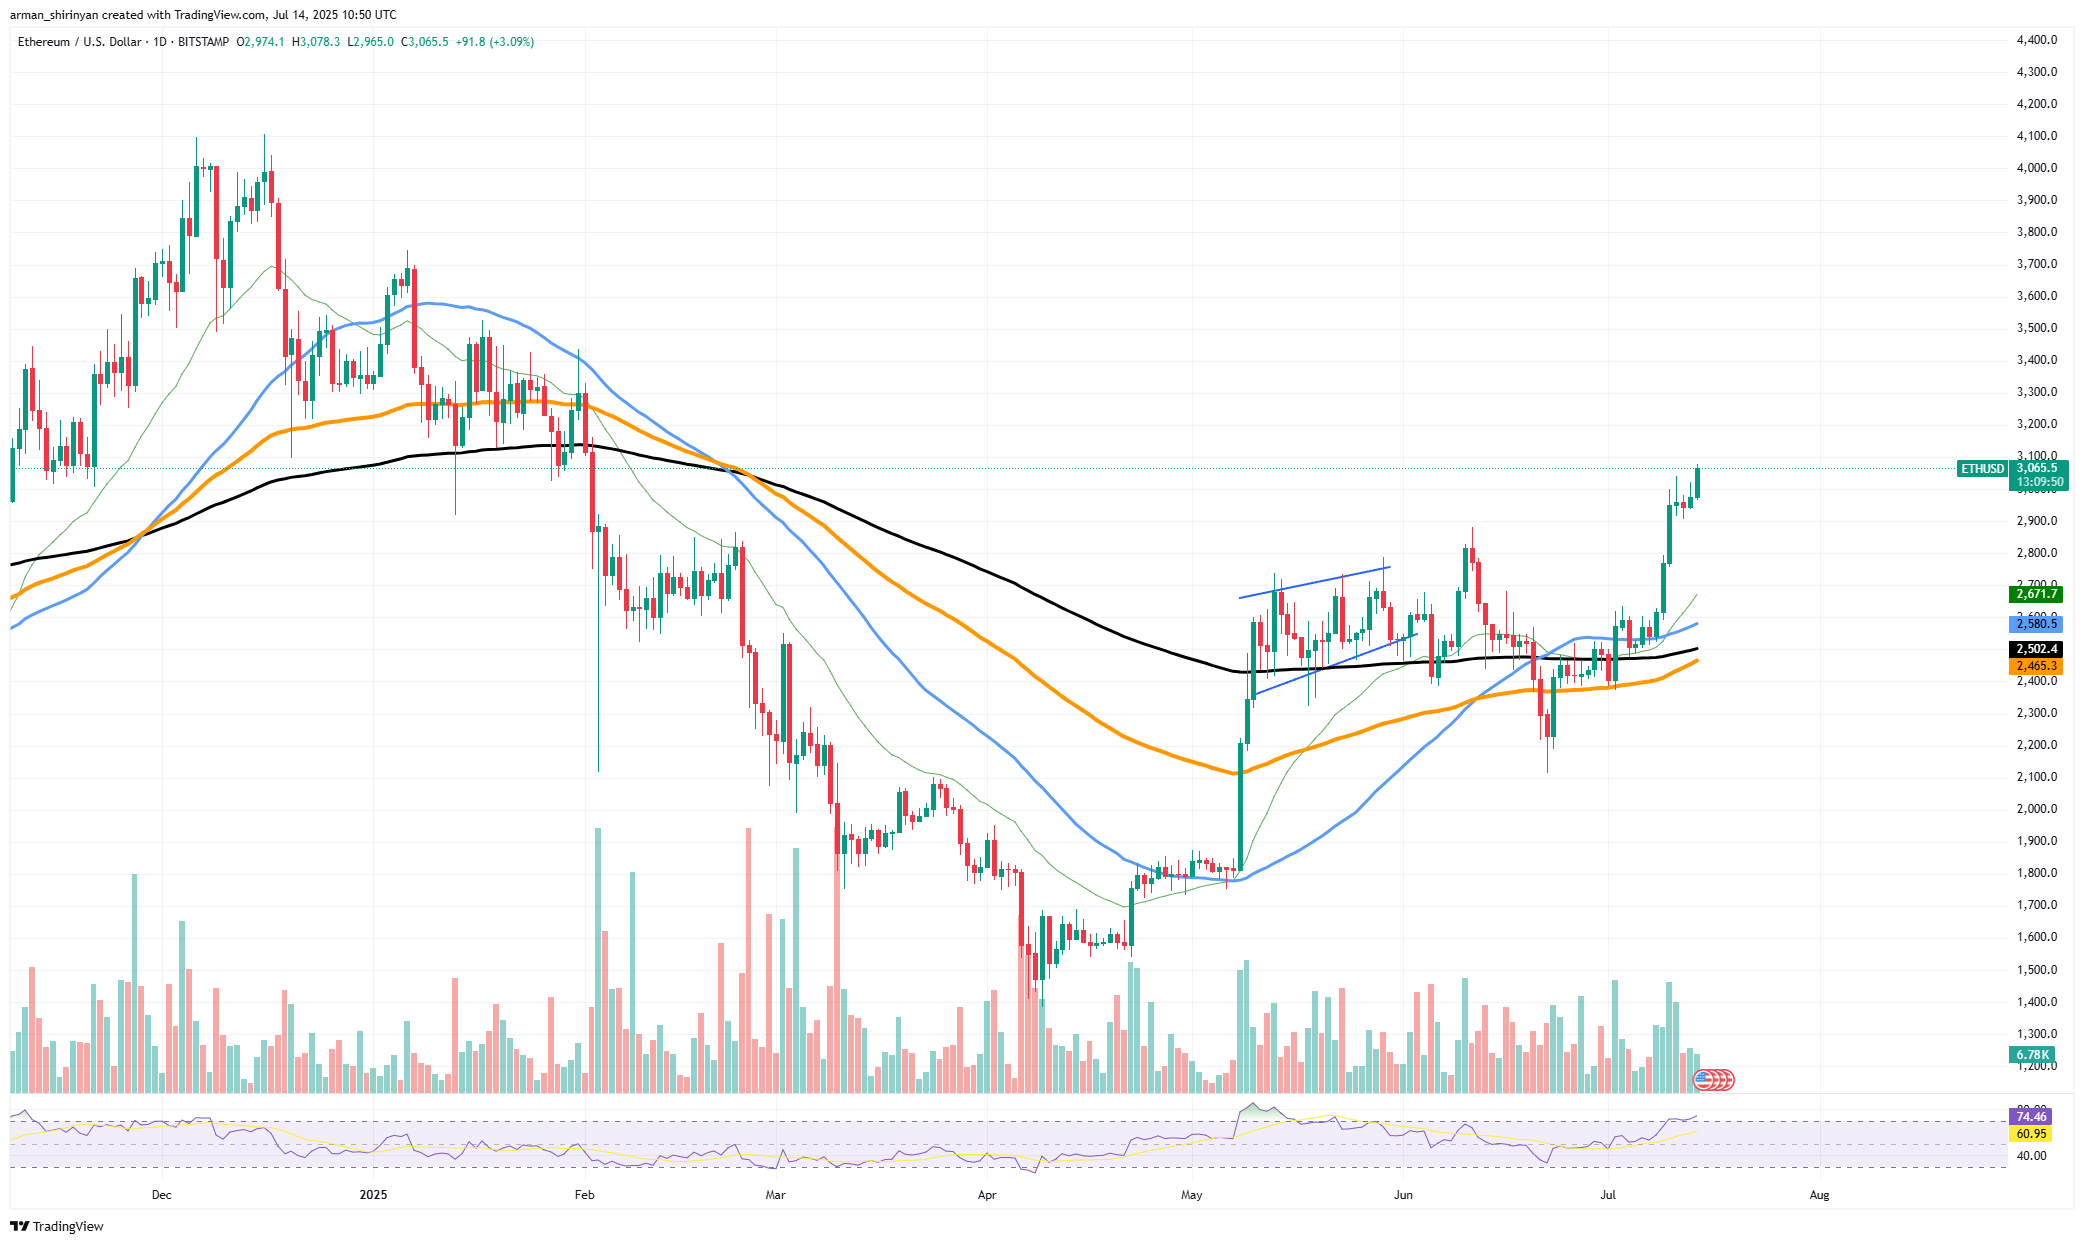
The 100/200 EMA crossover on the stock and cryptocurrency markets has only ever happened at critical turning points in the past, frequently following protracted declines that take months to recover from. It is important because the 50-day EMA is extremely sensitive to shorter swings and can result in false positives when conditions are choppy.
Much of that noise is muted by the 100-day EMA, which bends its slope upward only after a prolonged directional move. It signals that longer-term investors are also reentering the market and making consistent capital commitments when it eventually surpasses the 200-day EMA. Since the price is currently trading well above the 50-day, 100-day and 200-day EMAs, it is evident that $ETH has regained control of all of the major moving averages on the chart.
Strong overbought momentum, which is common in the early phases of significant bullish transitions, is reflected in the RSI's hovering around 74. Because of this the current move is distinct from the false breakouts that occurred in late 2024 and early 2025, when shorter-term averages crossed but failed as volume dried up.
There is currently a technical argument that the larger Ethereum bear phase is coming to an end as the 100-day EMA is about to surpass the 200-day. If the crossover is confirmed within the next few weeks, $ETH may be preparing for a long run in the $3,500-$4,000 range. The $3,200 resistance level, however, is where traders should watch out for profit-taking, as it will probably decide whether the breakout turns into a real long-term trend shift or just another failed rally.

 u.today