Ethereum Holds Strong As Altcoin Momentum Builds
Ethereum is leading the altcoin charge as investors position themselves for what many expect to be a massive rally in the coming weeks. After months of volatility, $ETH has reasserted its strength by reclaiming key technical and on-chain levels. Since crossing back above the $2,200 mark, Ethereum’s price structure has leaned decisively bullish, forming higher lows and consolidating around a critical resistance zone near $2,700.
Bulls remain firmly in control, and Ethereum is once again being looked to as the benchmark for broader altcoin sentiment. In a market environment now defined by Bitcoin’s recent breakout above all-time highs, $ETH is well-positioned to benefit from capital rotation into high-cap altcoins. To fully validate a bullish continuation, however, Ethereum must break above and hold the $2,700–$2,900 range.
Glassnode on-chain data adds another layer of bullish conviction. In May, Ethereum broke above its Realized Price at $1,900, putting the average holder back in profit—a milestone that typically signals renewed investor confidence. $ETH has also moved above its True Market Mean at $2,400, a key historical metric that aligns with strong accumulation phases.
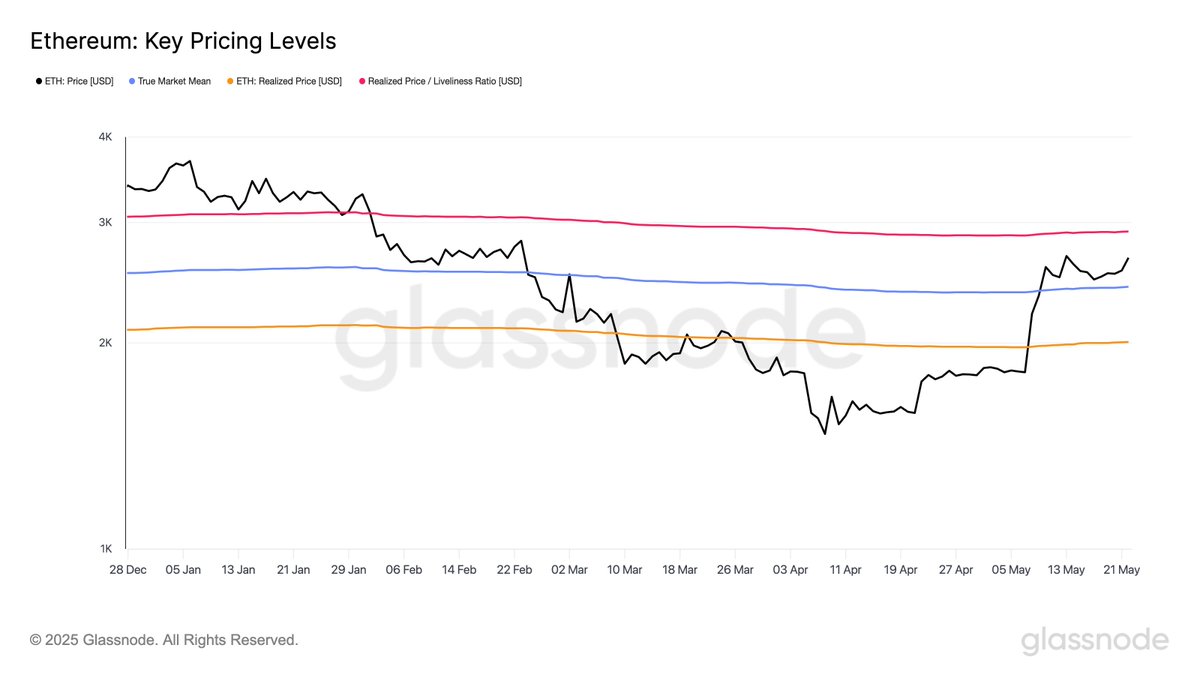
However, the final hurdle lies at the Active Realized Price, currently near $2,900. Reclaiming that level would not only confirm a major structural breakout but also signal that recent buyers are holding strong and that confidence has returned at scale. Until then, $ETH remains in a powerful setup, but the next few sessions will be critical for confirming whether the altcoin market’s leader is ready to drive the next leg higher.
$ETH Price Tests Major Resistance
Ethereum continues to push higher, with price currently consolidating around the $2,665 mark after briefly touching $2,734. The daily chart shows $ETH holding a clear uptrend since early May, with higher lows and strong buying volume supporting the move. All key moving averages are sloping upward, with the 34 EMA currently at $2,249 and the 50 SMA at $1,965—both well below the current price, reinforcing bullish structure.
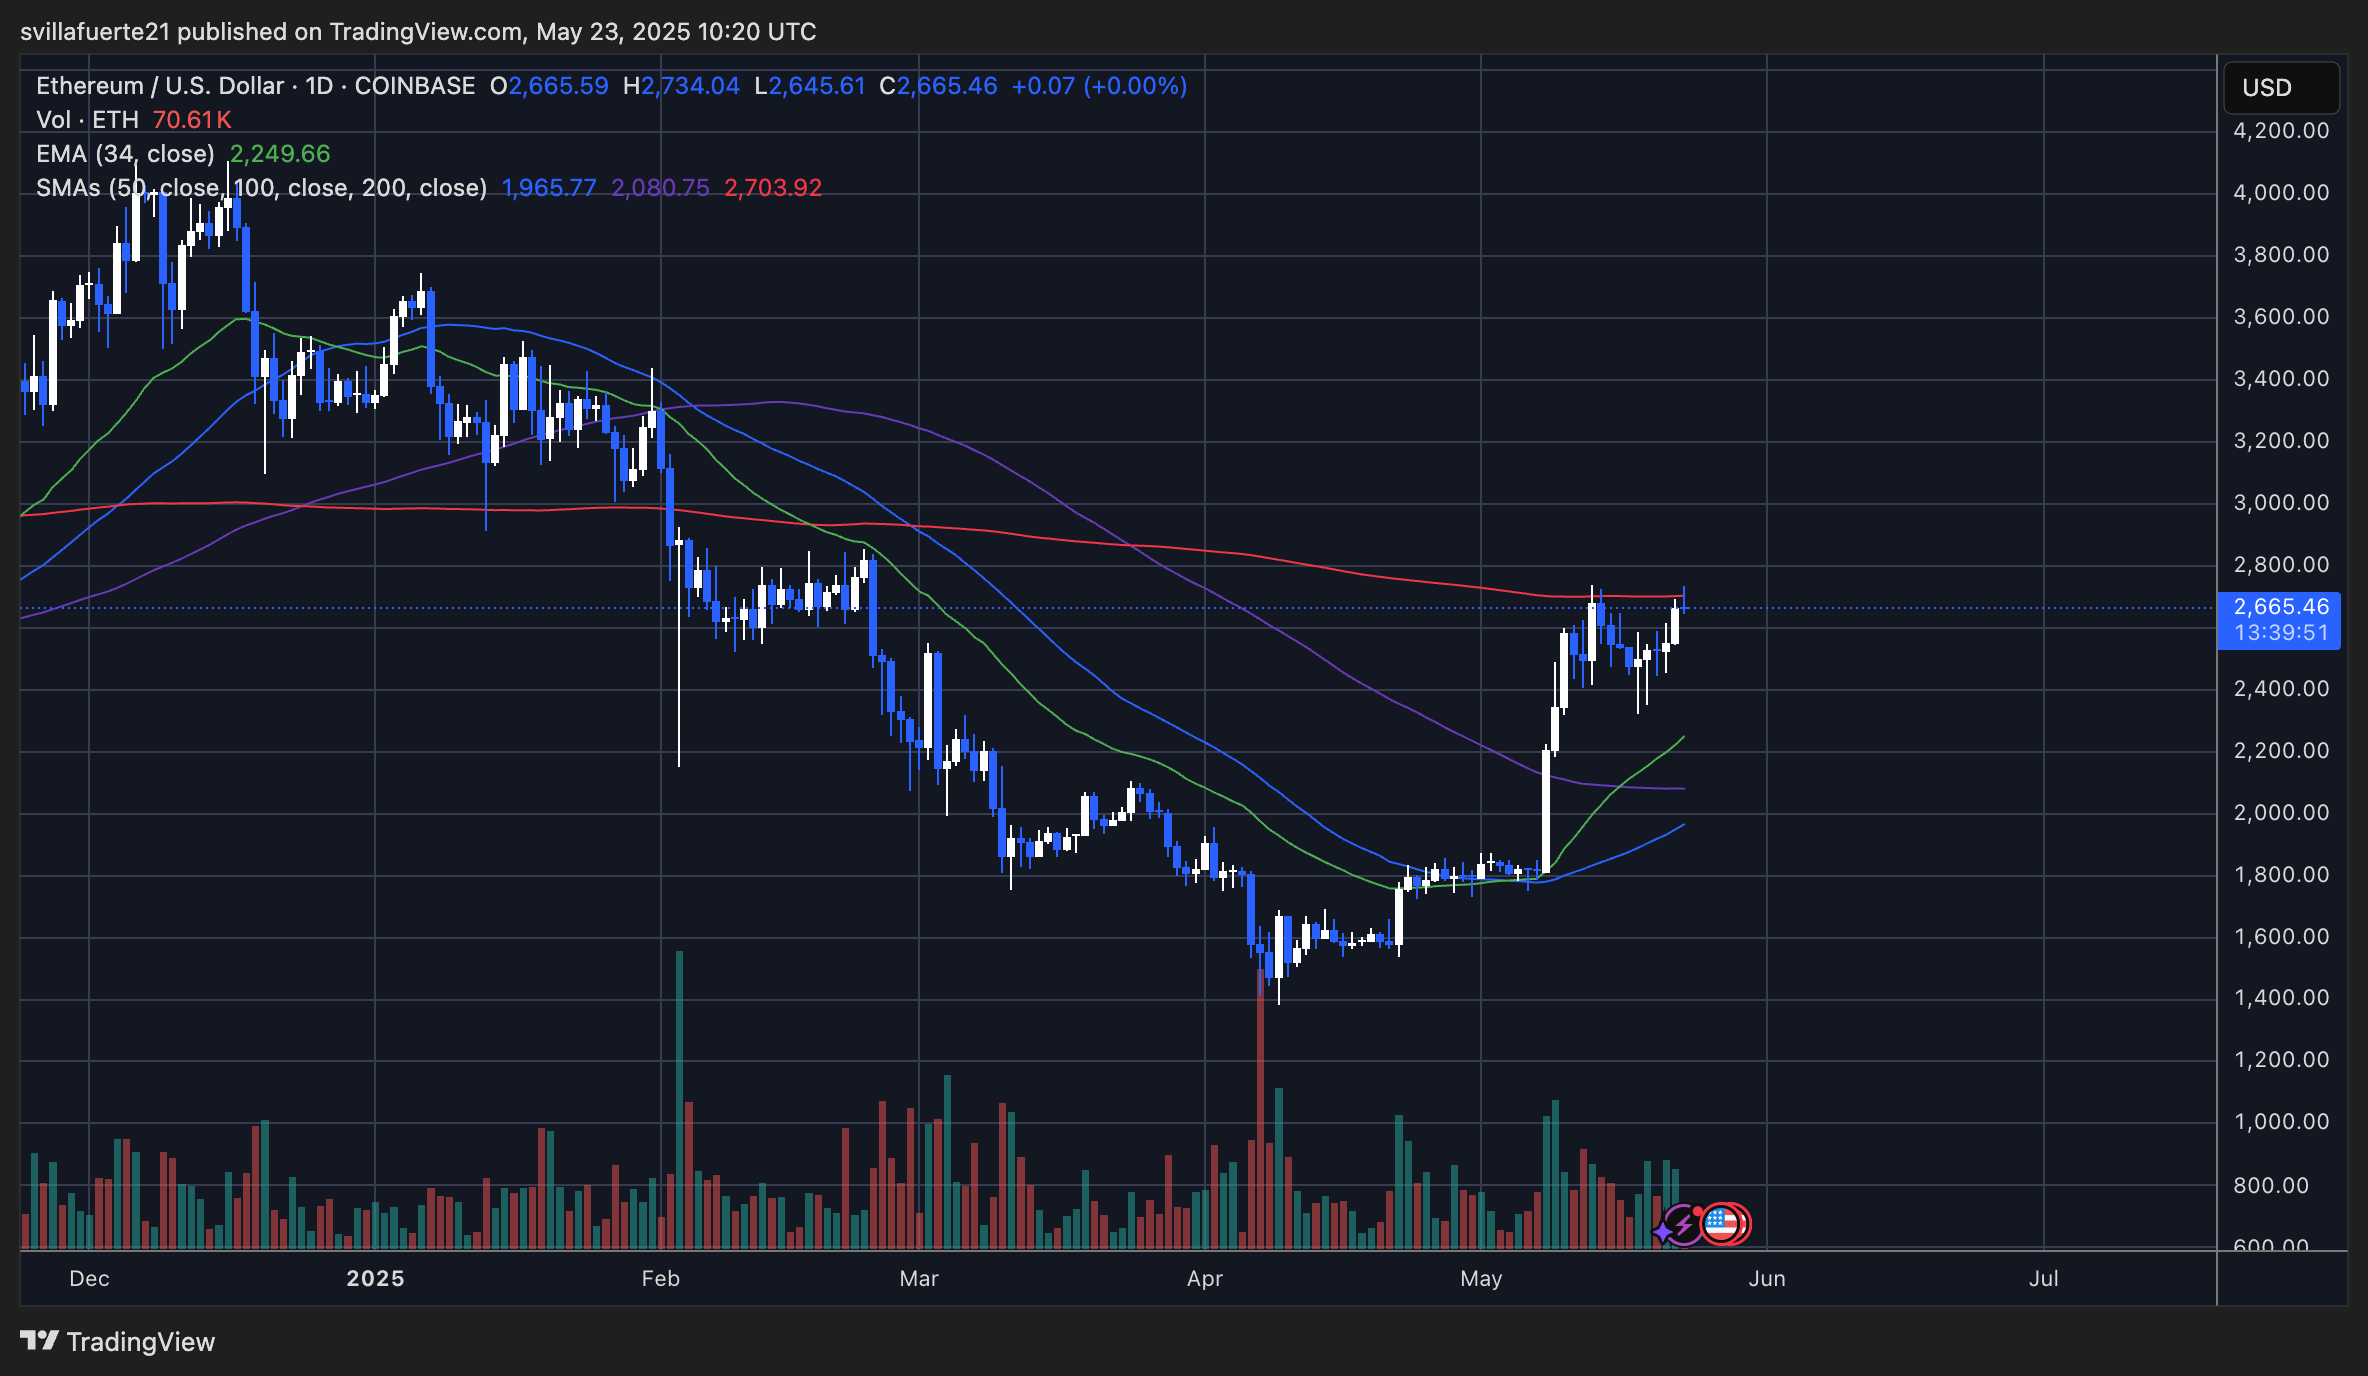
The most immediate technical challenge lies at the 200-day SMA, marked at $2,703. This long-term indicator has acted as dynamic resistance in previous cycles and will be critical to watch. A daily close above this level could trigger a breakout and confirm a broader bullish continuation, possibly opening the door toward reclaiming the $2,900–$3,000 region.
Volume has picked up slightly on recent green candles, signaling growing demand, but the test of the $2,700 zone could invite short-term profit taking. Support is seen around $2,445 (100 SMA) and $2,080 (close to the True Market Mean), which would likely act as a cushion if a pullback occurs.
Featured image from Dall-E, chart from TradingView

 newsbtc.com



