Lookonchain, a Web3 data analysis platform reported that Cumberland, a crypto asset trading company, withdrew 8,250 ETH from Binance and 4,500ETH from Coinbase again. Concurrently, the Web3 data analysis platform also noticed that Cumberland withdrew another 20,000 ETH and 4,850 ETH earlier. So far, a total of 37,500 ETH has been withdrawn, which is worth $69 million approximately, at the reported time.
Cumberland withdrew 8,250 $ETH ($15M) from #Binance and 4,500 $ETH ($8M) from #Coinbase again.
— Lookonchain (@lookonchain) June 7, 2023
A total of 37,600 $ETH ($69M) has been withdrawn.https://t.co/YzPbuAi980 pic.twitter.com/5fUgVcc9R5
Highlighting the possible reason behind this substantial outflow, Lookonchain claimed financial institutions and companies have bought “from the bottom” after the crypto market was negatively affected.
This could indicate that Cumberland is expecting ETH ‘s price to rise in the future as it takes advantage of this golden opportunity. Reportedly, one of the main factors behind crypto’s recent fall was due to the FUD rising after news reported SEC sued Binance and Coinbase.
Apart from the leading altcoin, the Web3 data analysis platform also observed that Cumberland also transferred altcoins such as AXS, SHIB, COMP, LINK, CRV, AAVE, and RNDR. Despite SEC’s bewildering assaults on the crypto industry, many institutions, and whales remained unfazed and viewed it as a serendipitous event.
ETH’s fall created a fortunate juncture for various traders who were thinking about purchasing this leading altcoin, based on its market cap.
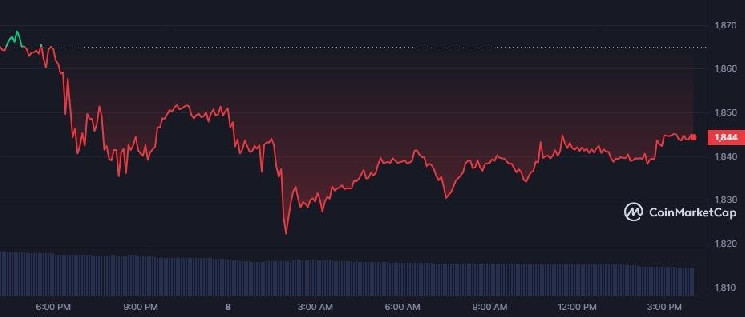
According to CoinMarketCap, ETH faced a fall of 1.41% in just 24 hours, at the reported time. The leading altcoin’s price is valued at $1,844.29 after its weekly performance witnessed a 0.93% tumble to the red zone. The trading volume also fell by 23.95% to $1,382,958,513.
Looking at the 3-hour ETH/USD chart, the candlesticks have recently entered the weak region, trading in the lower half of the Bollinger Band. Moreover, the gap between the upper band and lower is still huge, which indicates that there is high volatility in the market.
During the last week of May, ETH climbed up towards the Support 2 region and was trading in the current recovery point.
However, the candlesticks experienced a recent Bollinger Band squeeze which led to a breakout in the lower half. Moreover, the tremendous drop that ETH faced could also be the result of the FUD observed in the crypto market, recently.
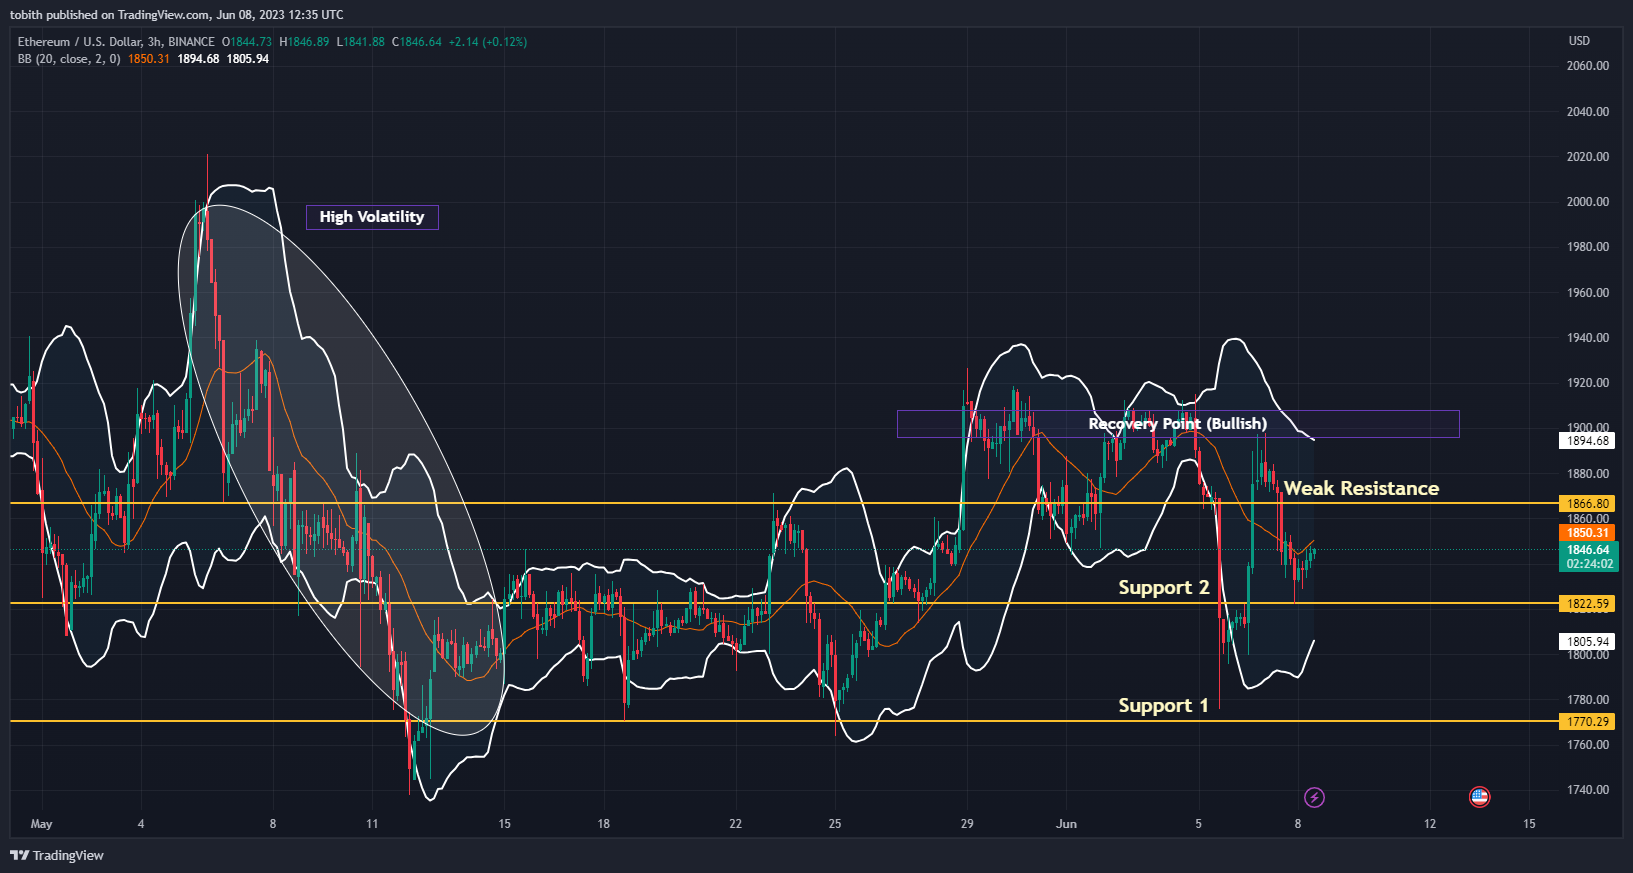
As the lower band is moving upwards, there is a chance that the volatility could reduce. During the low volatile market, ETH’s candlesticks could trade between the Support 2 and the Weak Resistance for some time. If ETH continues to have optimistic support from whales and institutions, then, the altcoin could easily trade above the recovery point.
Disclaimer: The views and opinions, as well as all the information shared in this price analysis, are published in good faith. Readers must do their own research and due diligence. Any action taken by the reader is strictly at their own risk, Coin Edition and its affiliates will not be held liable for any direct or indirect damage or loss.