After dropping to a monthly low over the past week, finally, the steep dive seems to be finding a local bottom. $ETH saw a staggering 12% price increase over the past three days, touching a high of over $1600 as of yesterday (Wednesday).
Could this end up in breaking out above the falling wedge, which is textbook bullish?
Technical Analysis
By Grizzly
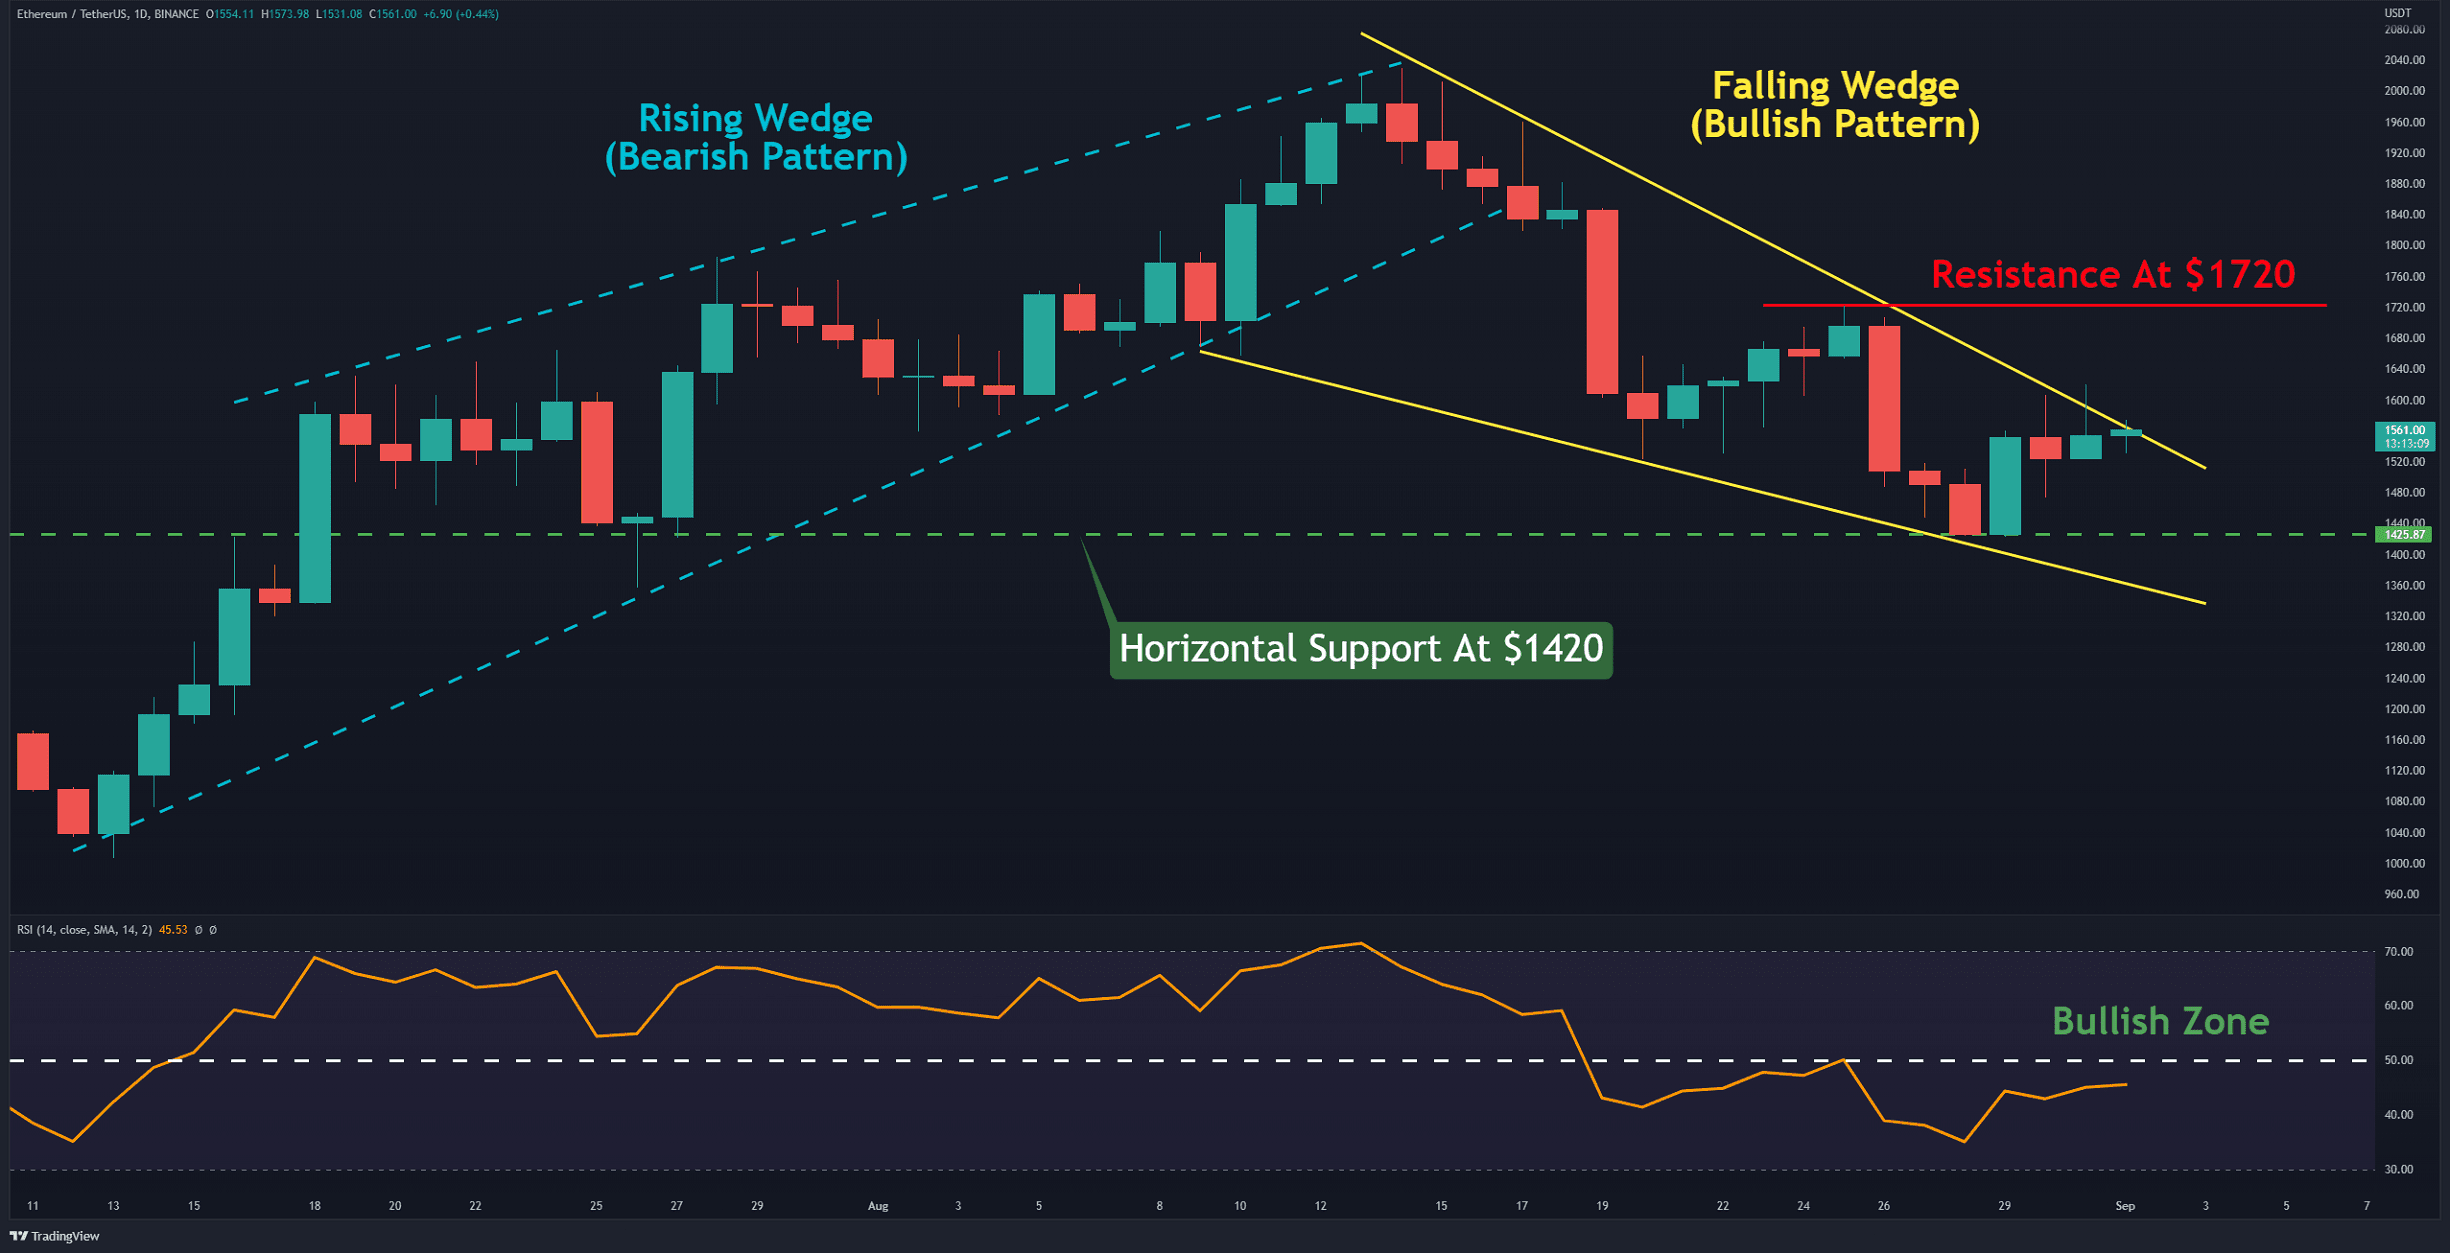
The Daily Chart
The bottom line of the falling wedge pattern (in yellow) has already supported the price three times. This pattern is technically bullish if and when the price breaks out of it. This is the second wedge that has been formed in recent months. The first turned out to be bearish (in light blue), causing the price to fall toward the horizontal support at $1420.
If the bulls can break above the horizontal resistance at $1,720 (in red) following a bullish breakout of the wedge, then a rally to reclaim $2,000 is expected.
Considering that the Relative Strength Index (RSI) is also moving towards the bullish area, there is a possibility that the bulls will regain control of the market again, as they did on July 15 (in white) when the pair rallied from $1,200 to $2,000. To confirm this scenario, $ETH must break above and hold the $1720 level, along with a breakout of the RSI’s baseline.
Key Support Levels: $1420 & $1300
Key Resistance Levels: $1720 & $2000
Daily Moving Averages:
MA20: $1693
MA50: $1623
MA100: $1512
MA200: $2153
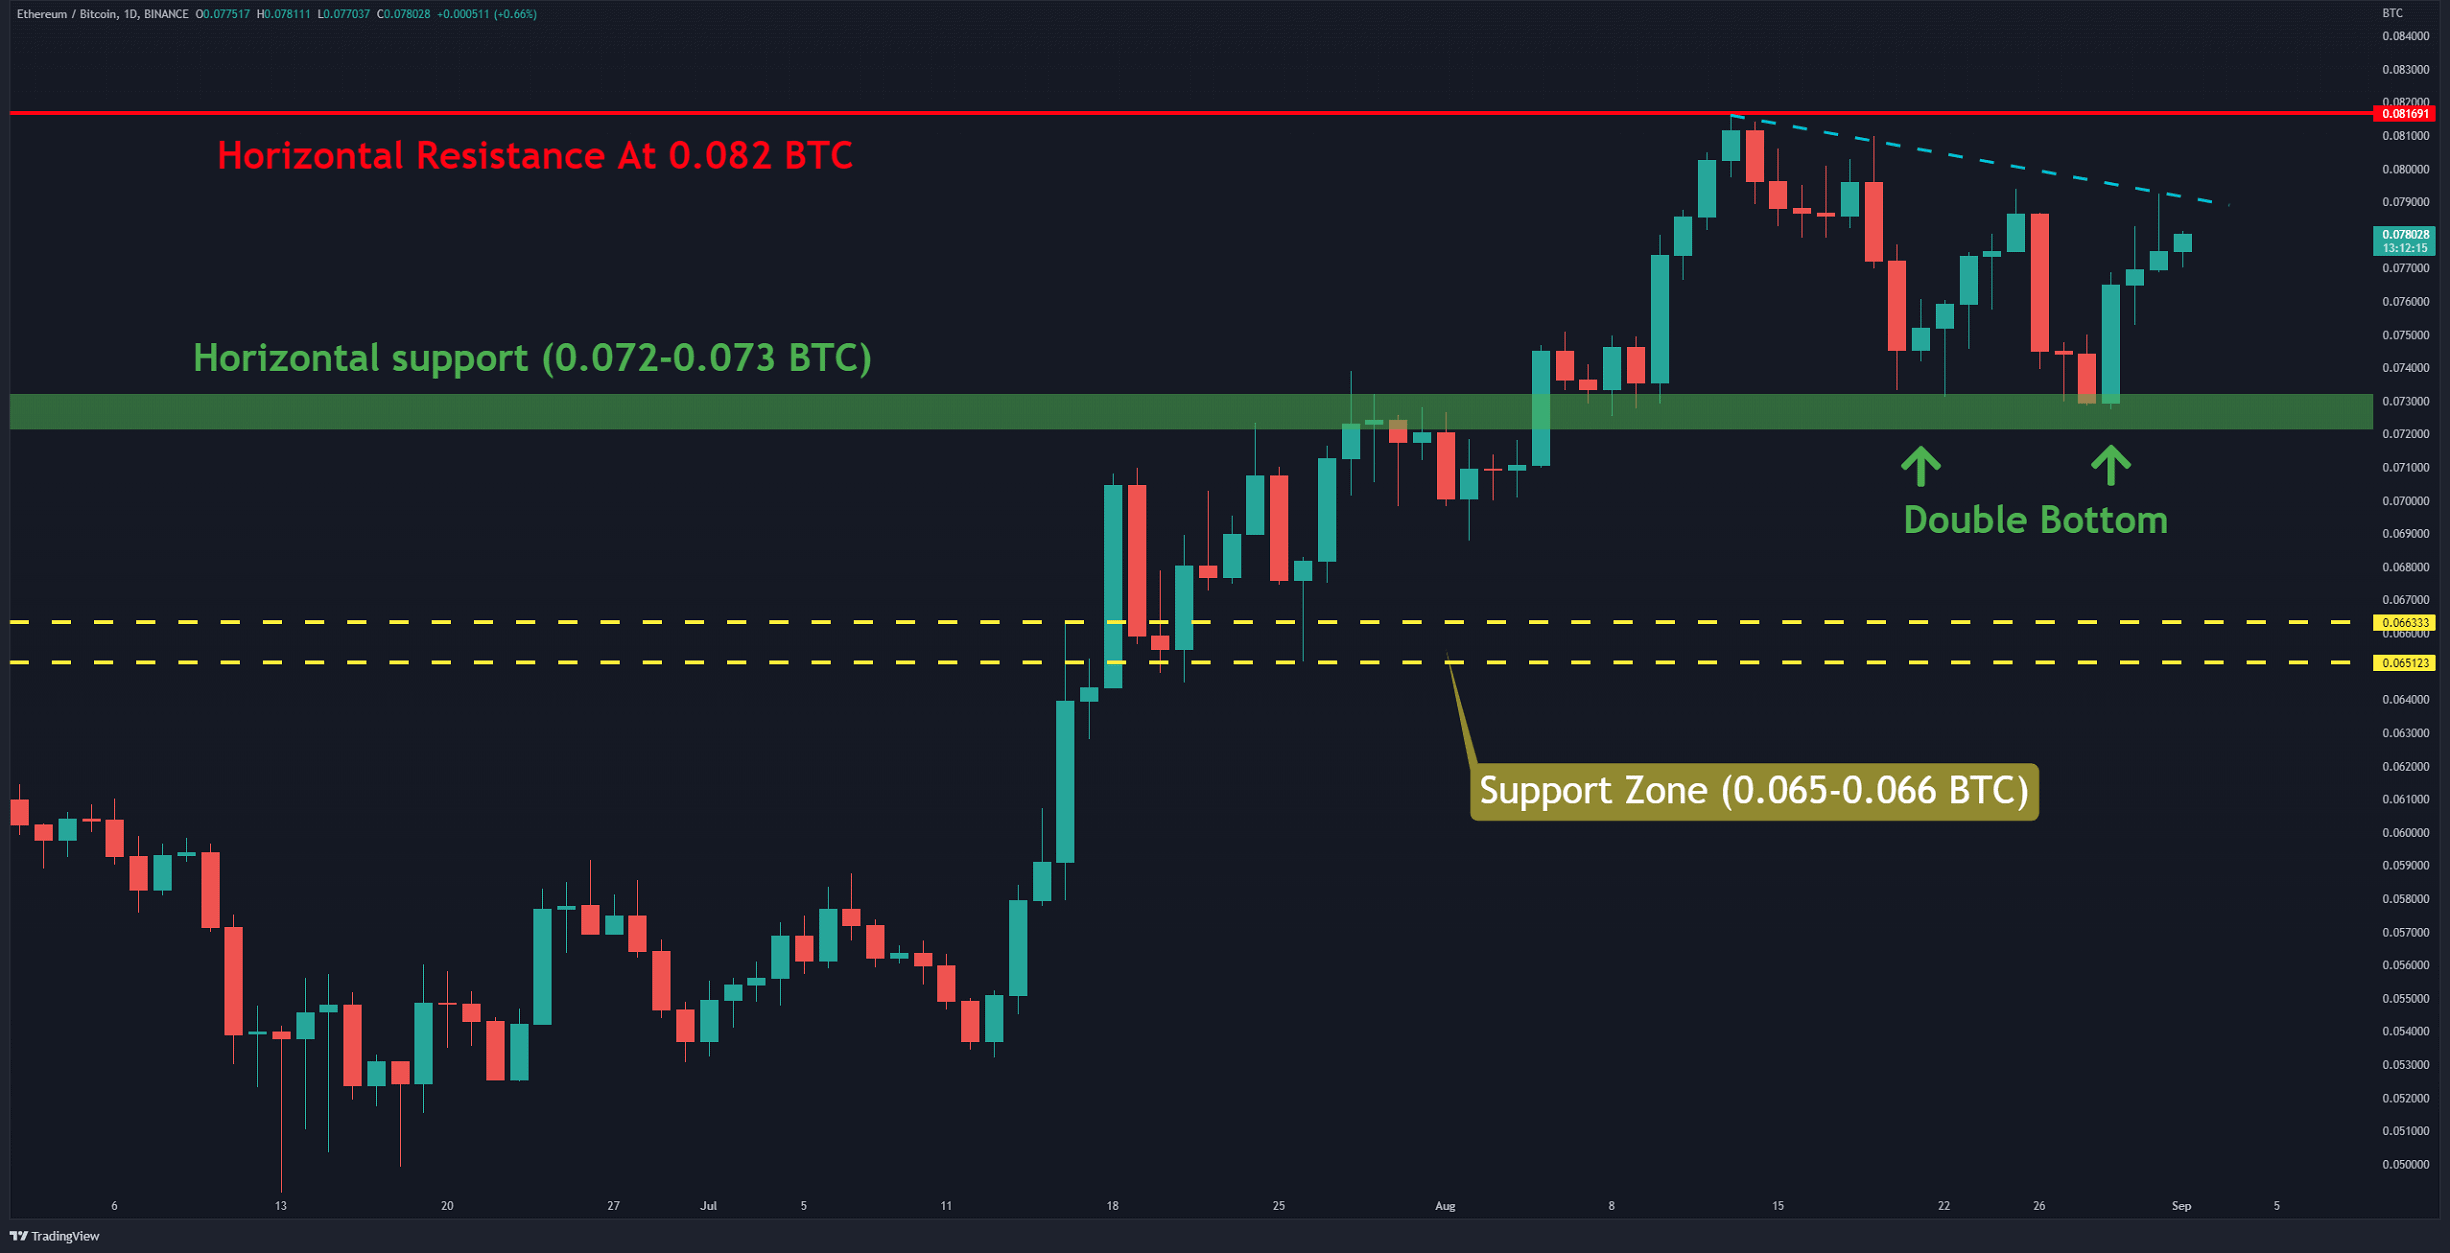
The $ETH/$BTC Chart
The $ETH/$BTC trading pair chart reveals a double-bottom pattern (bullish). Horizontal support in the range of 0.072-0.073 $BTC (in green) has been a barrier against the bears. The bullish momentum has increased compared to the recent rally.
If the bulls can push the price above 0.08 $BTC, breaking the horizontal resistance at 0.082 $BTC (in red) will become likely. Overall, optimism for the bulls can be witnessed by looking at the $ETH/$BTC chart.
Key Support Levels: 0.0.073 & 0.065 $BTC
Key Resistance Levels: 0.083 & 0.088 $BTC
On-chain Analysis
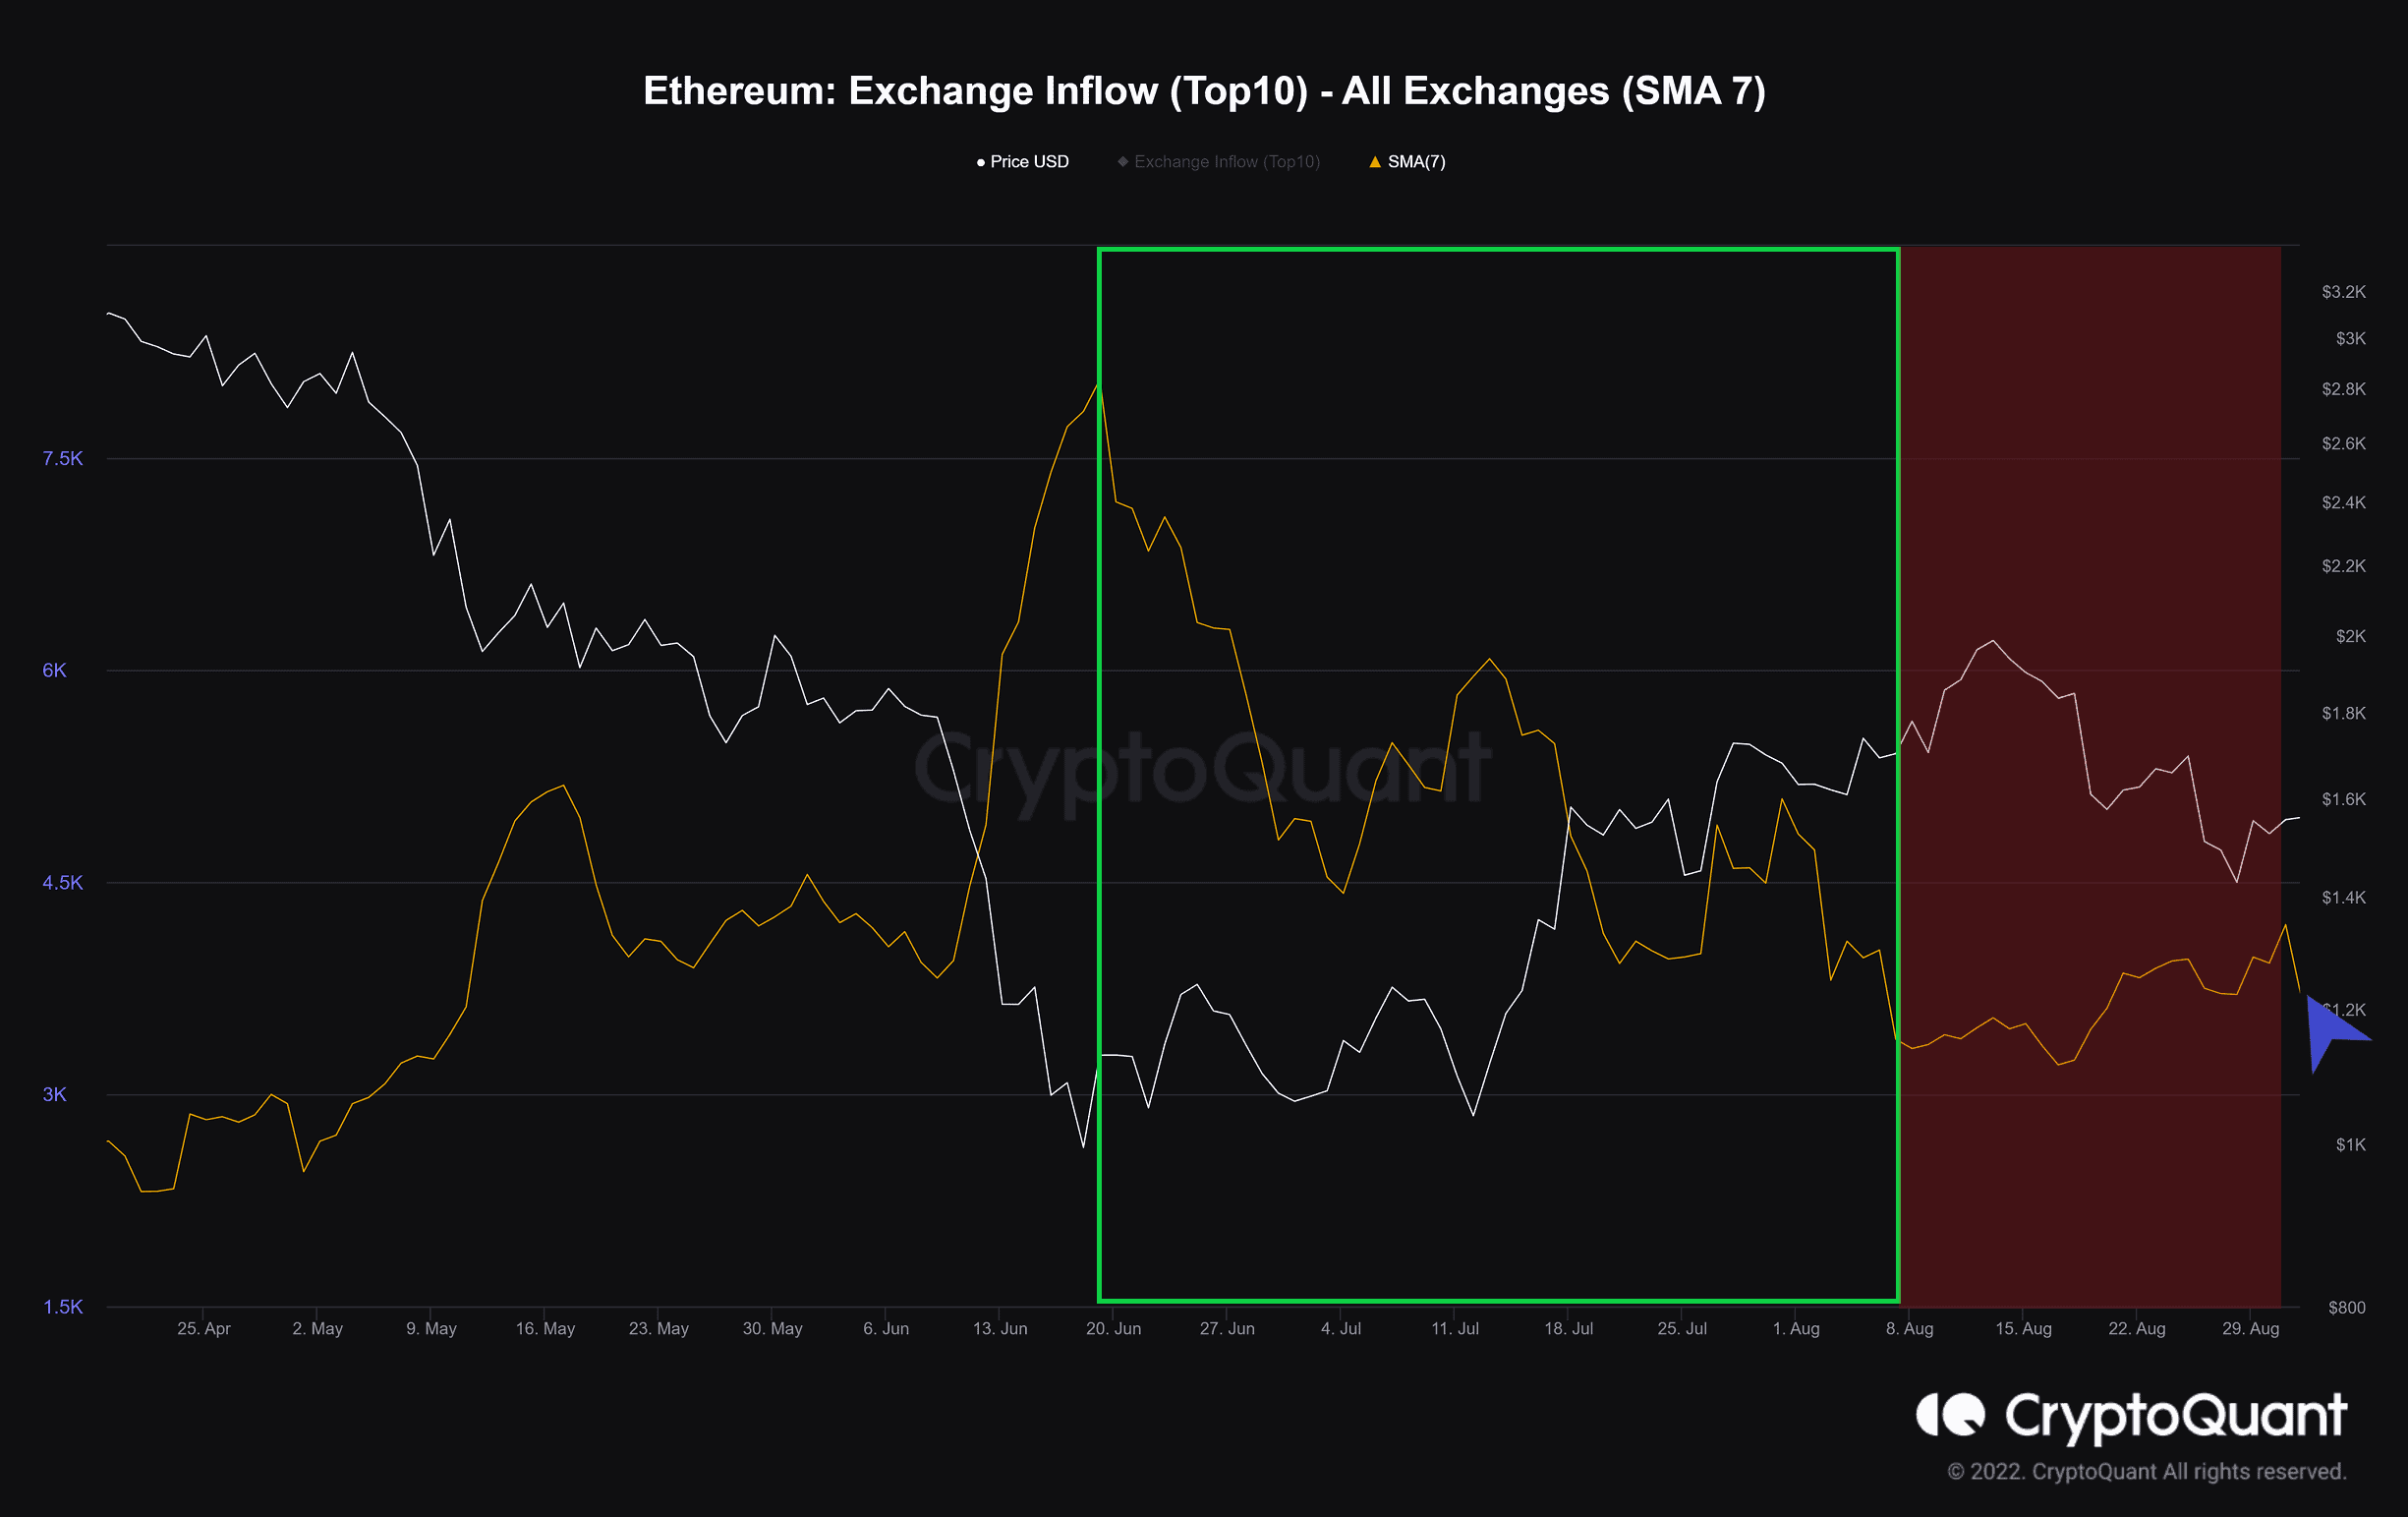
Exchange Inflow (Top10) – (SMA 7)
Definition: The total volume of the top 10 inflowing transactions to all exchanges. A high value indicates that investors who deposited large amounts at once increased.
A decrease in inflow (in green) has accompanied $ETH’s upward trend in June and July to exchange by the top ten transactions, which are referred to as Whales. When the price reached the technical resistance, this index turned. This was probably due to profit taking by some investors.
At present, the slope is pointing downward again, and if it continues, it will likely be followed by price increase.