With Bitcoin attempting to break its period of consolidation as it tries to recover from the mid-May capitulation, it’s time to look at the overall DeFi industry. The mid-May market sell-off damaged the entire industry, and DeFi lost a total of almost 40% in market cap over the past month alone.
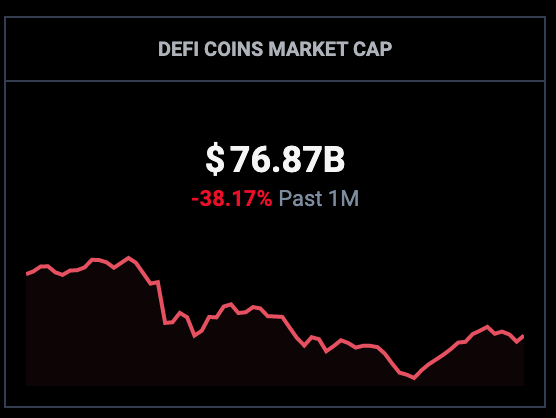
Nevertheless, many of the top DeFi projects are starting to see a phase of consolidation also. This could be a good sign that the bearish trend has passed, and DeFi might begin to make its own recovery over the next fortnight - providing that BTC manages to stay above $40K.
Let us take a look at three key players in the DeFi market: Uniswap, Chainlink and Aave.
Uniswap price analysis
What has been going on?
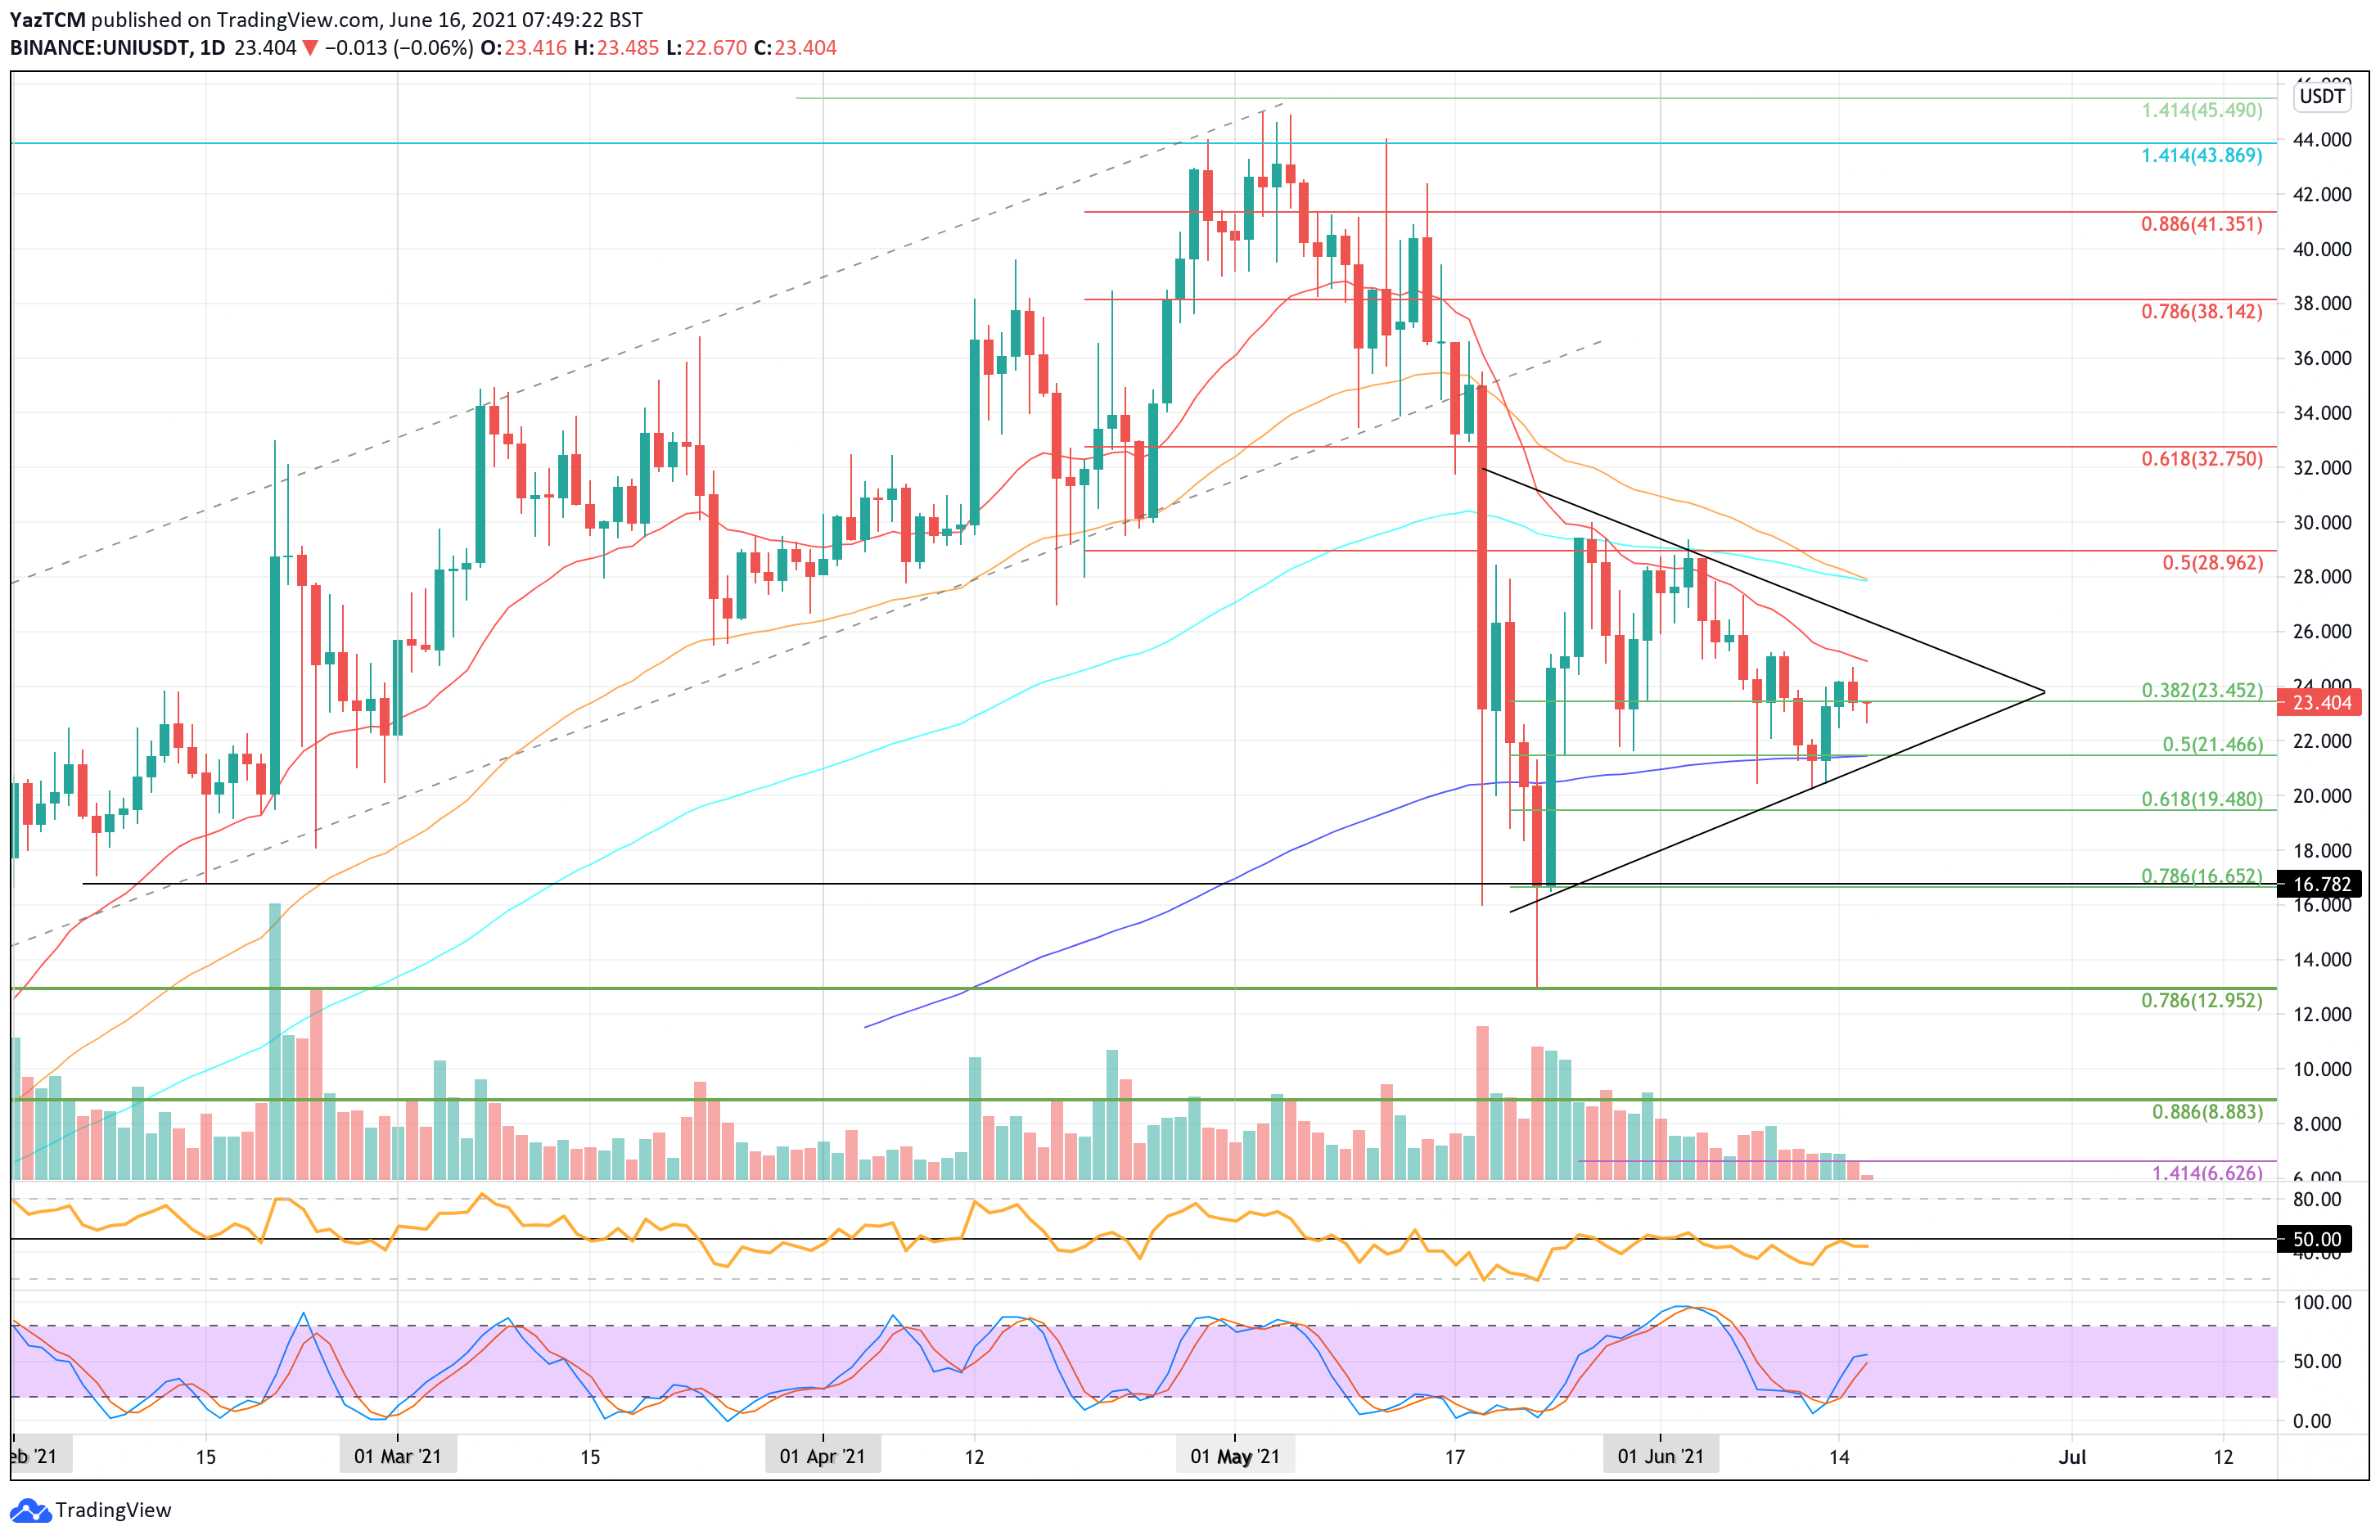
Uniswap is down by a strong 36.6% over the past month of trading as the coin trades at $23.40. Uniswap created a new ATH price in May above $44 and was previously trading inside a rising price channel for a few months. From there, UNI headed lower, and the mid-May market capitulation caused UNI to break toward the downside of the price channel.
After breaking beneath the channel, UNI started to fall aggressively until support was found at $12.95 (.786 Fib Retracement) toward the end of the month. It rebounded from there and ended up closing the May low-day at a price of $16.78.
UNI attempted to rebound in May but failed to break resistance at $29 (bearish .5 Fib Retracement). This resistance was further bolstered by a 100-day MA. It then formed the current consolidation pattern, a symmetrical triangle.
Over the weekend, UNI dropped into the lower boundary of the triangle and found support at $21.47 (.5 Fib Retracement). It has since bounced higher from there as it trades at $23.40.
UNI/USD price short-term prediction: Neutral
UNI is neutral as it trades inside the consolidation pattern. It would need to break resistance at $29 (bearish .5 Fib Retracement) to turn bullish in the short term. On the other side, a closing candle beneath $16.78 would turn the market bearish.
If the sellers push lower, the first level of support lies at $22. This is followed by $21.6 (.5 Fib & lower boundary of the triangle), $20, $19.48 (.618 Fib Retracement) and $16.78.
Where is the resistance toward the upside?
On the other side, the first resistance lies at $24. This is followed by the upper boundary of the triangle at $26, $28 (100-day & 50-day MA), and $29 (bearish .5 Fib & June highs).
Beyond the June highs, resistance lies at $30, $32.75 (bearish .618 Fib Retracement), $34, $36, and $38.15 (bearish .786 Fib Retracement).
Chainlink price analysis
What has been going on?
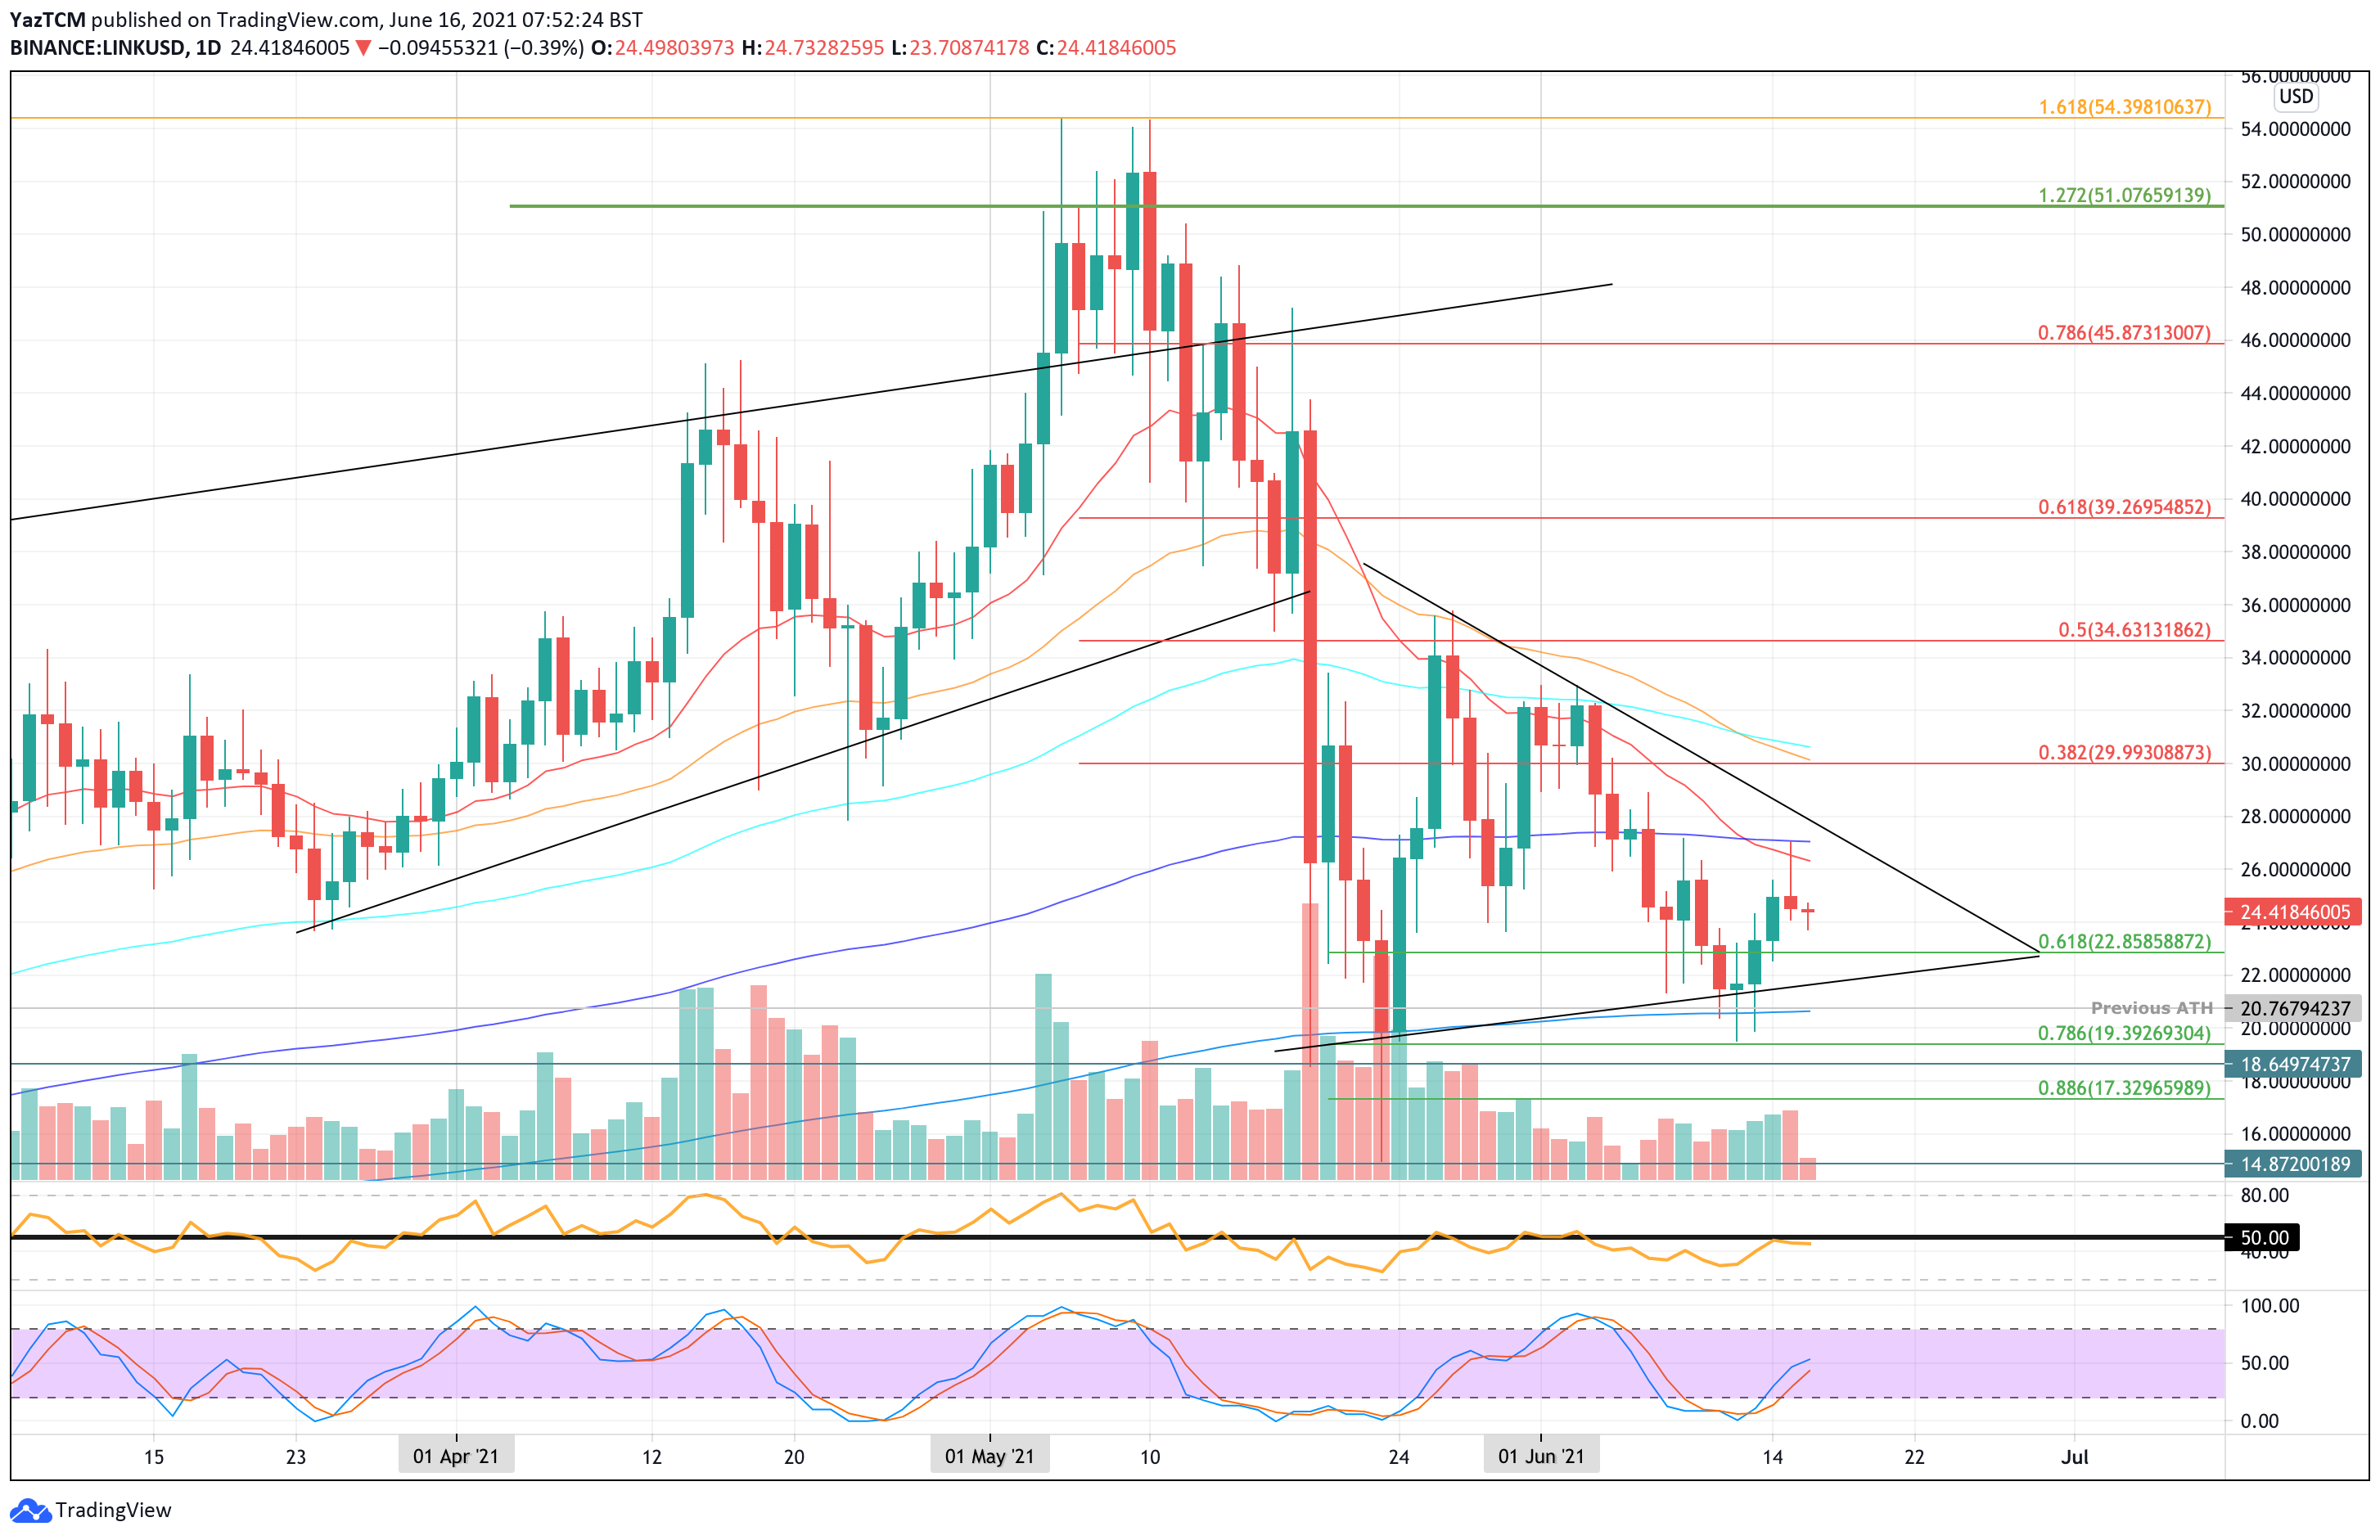
LINK is down by a stronger 41% over the past month of trading. The cryptocurrency is currently trading at a price of around $24.40 and is also trading inside a triangle pattern of its own. The cryptocurrency had dropped from a high of around $54.40 during May and ended up dropping into the support at $20.
From there, LINK attempted to rebound but was unable to overcome resistance at $34 toward the end of May.
In June, LINK failed to break resistance at $32 and formed the upper angle of the triangle. It headed lower from there until support was found at $21 this weekend, provided by the lower boundary of the triangle.
It has since bounced from there but struggled to break resistance at the 200-day MA at $27 yesterday and has since dropped to the current $24.40 level.
LINK/USD price short-term prediction: Neutral
LINK is considered neutral also as it trades inside a consolidation phase. A drop beneath $20 is likely to turn LINK bearish again. On the other side, it would need to break the resistance at $32 (June highs) to turn bullish.
If the sellers push lower, the first support lies at $22 (lower boundary of the triangle). Beneath this, support lies at $20.76, $20, $19.40, and $18.65.
Where is the resistance toward the upside?
On the other side, the first resistance lies at $26 (20-day MA). This is followed by $27 (200-day MA & the triangle’s upper boundary). Above the triangle, resistance lies at $28, $30 (bearish .382 Fib), $32, and $34.60 (bearish .5 Fib).
Aave price analysis
What has been going on?
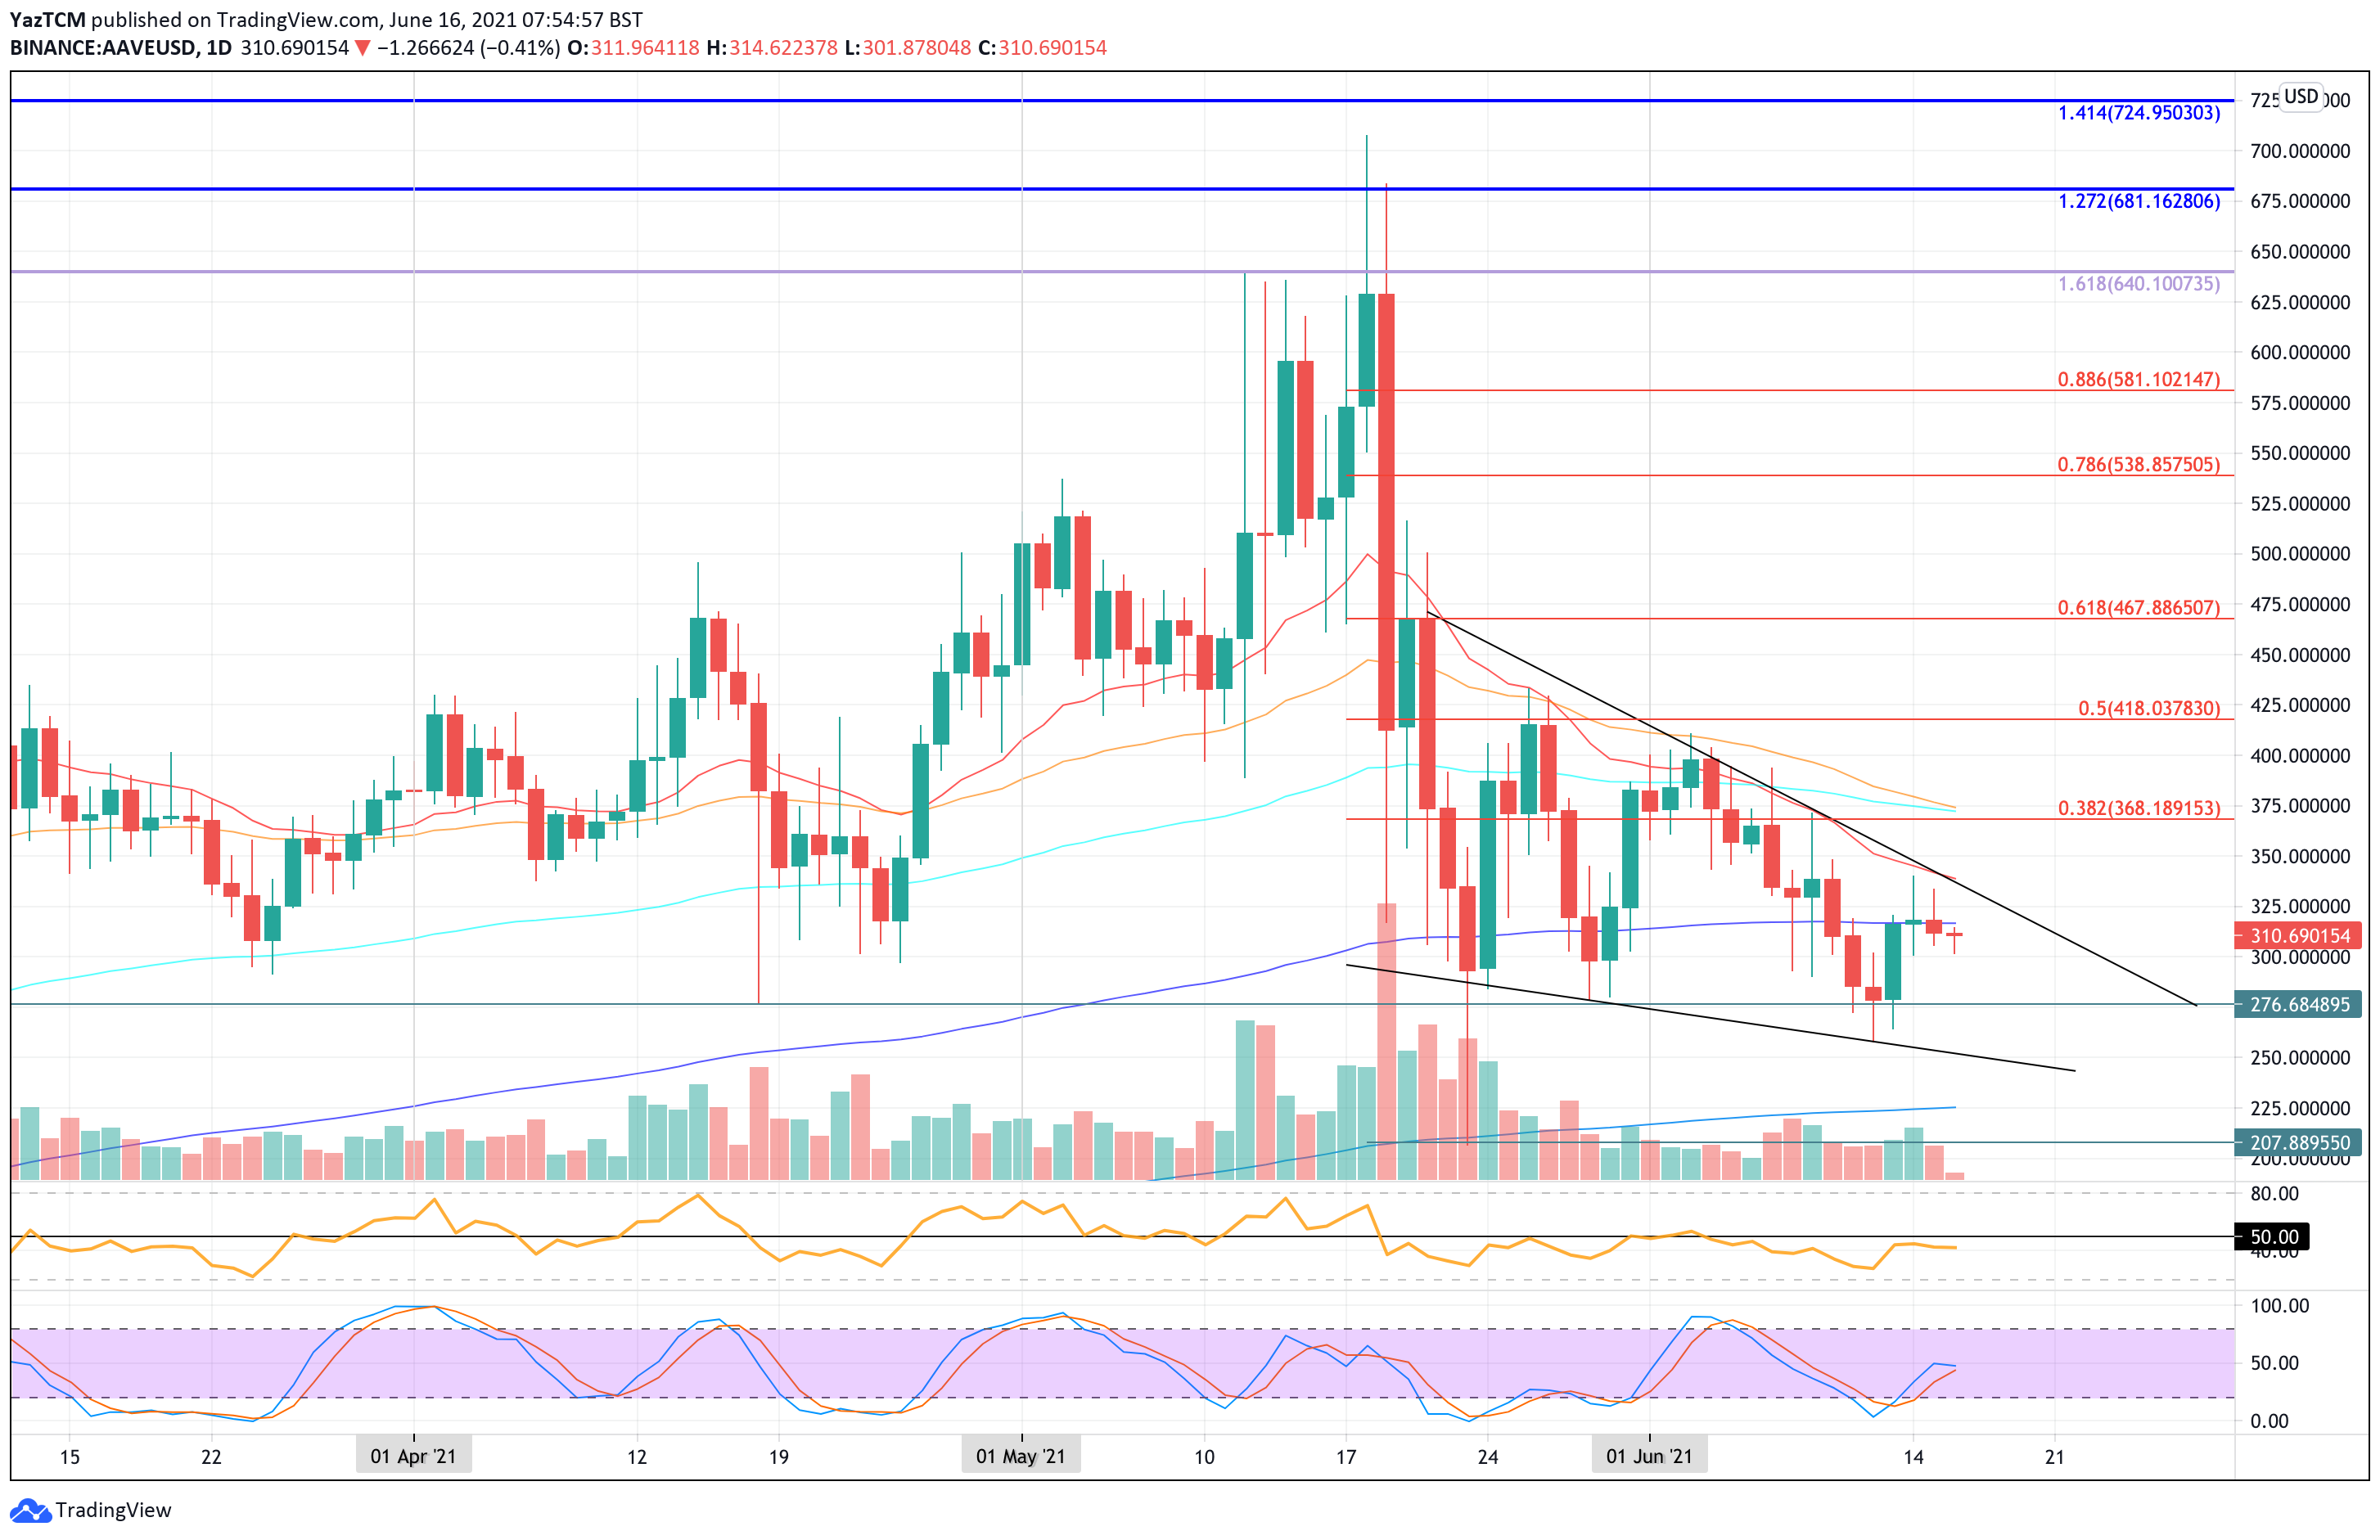
AAVE is also down by a steep 42.9% over the past month of trading as it currently sits at around $311. The cryptocurrency is sitting inside a falling wedge pattern as it battles to break back above the 200-day MA level this week.
AAVE fell from a peak of over $700 in May but managed to find solid support at $208. It has since established firm support at $276 and must defend this level to prevent itself from turning bearish.
AAVE/USD price short-term prediction: Neutral
AAVE is also neutral right now, but a drop beneath $276 would turn the market bearish. IOn the other side, it would need to break above $400 to turn bullish.
If the sellers push lower, the first support lies at $300. This is followed by $276, $250 (lower boundary of the wedge), $225, and $207.
Where is the resistance toward the upside?
On the other side, the first resistance lies at $320 (200-day MA). This is followed by the upper boundary of the wedge at $340 (50-day MA), $370 (bearish .382 Fib _&50-day MA), and $400.