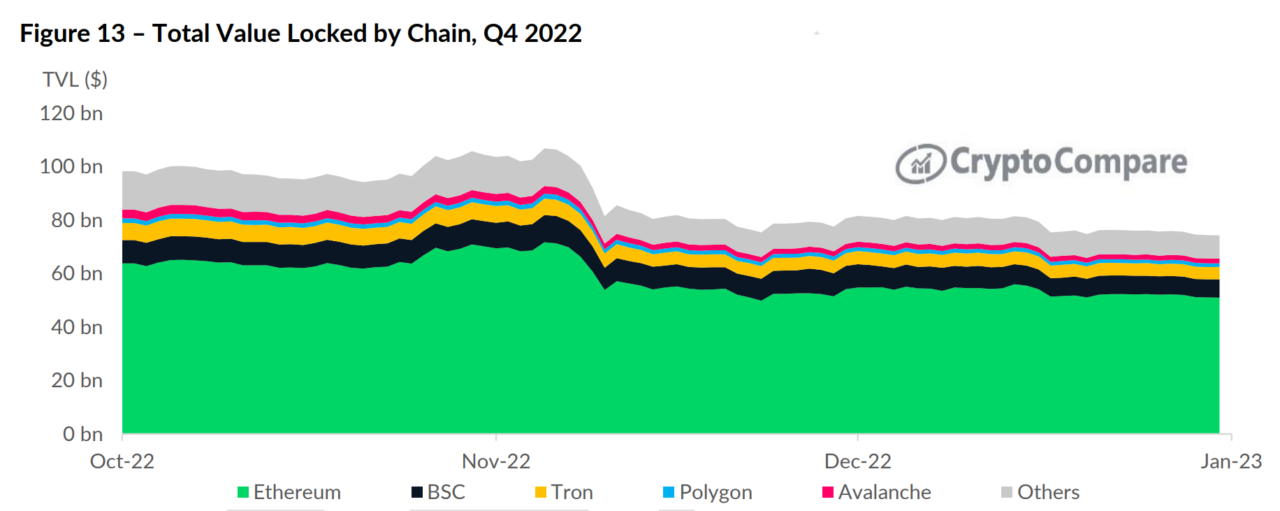
The total value locked (TVL) on decentralized finance protocols fell 24.7% last quarter to $74.3 billion, marking the second-largest quarterly decline for the novel financial services industry, behind only the quarter that saw the Terra ecosystem collapse.
The decline has meant that DeFi recorded its first-ever yearly decline in total value locked, losing 76.4% of the value locked on it since the beginning of 2022. That’s according to CryptoCompare’s 2023 Q1 Outlook report, which points out Ethereum’s dominance in the Defi sector is still 68.7%, with its market share, up from 64.8% in the third quarter of the year.
The total value locked on Ethereum has, nevertheless, plunged 20.2% to $51 billion. It far outperformed Solana’s decentralized finance space, which fell 81.7% to $445 million in the fourth quarter, affected by the collapse of FTX and Alameda Research, both of which were heavily invested in the space.
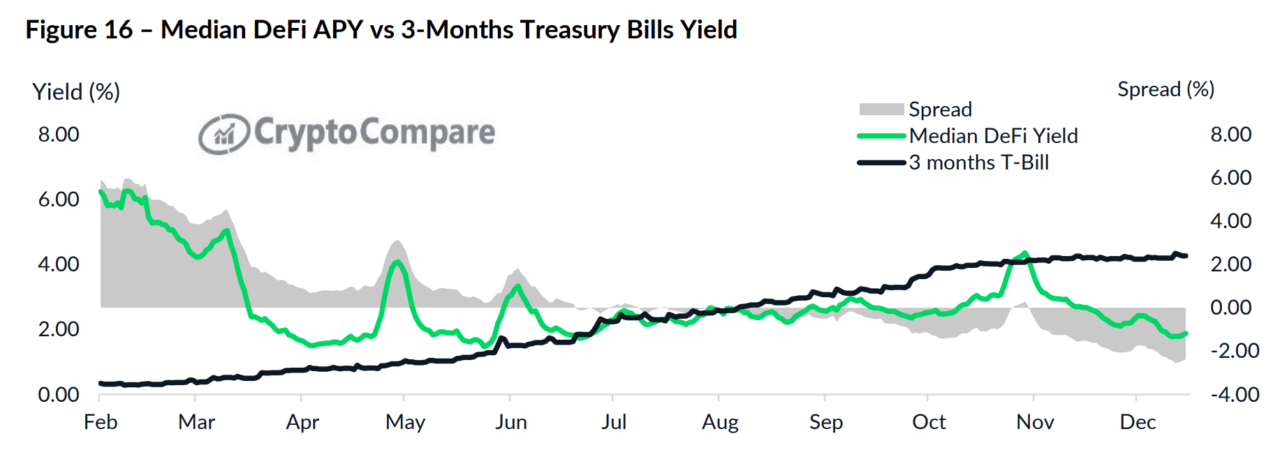
According to CryptoCompare’s report, a prominent factor in the decline of the DeFi space last year was the decline in the annual yield being offered by the various protocols in the space. As these yields have been declining, yields offered through traditional finance assets have been rising as central banks resort to quantitative tightening to rein in inflation.
At the time of writing, bond yields in the U.S. allow users to earn 4.47% on 1-month Treasurys, or 4.82% on 6-month Treasurys. The yield is currently inverted as investors are anticipating a recession, as 10-year T-bills are paying out 3.381%.
Throughout 2022, CryptoCompare wrote, the average yield of all liquidity pools in the DeFi sector dropped from 6.24% to 1.87% by the end of the year.
The report also notes that throughout 2022, digital assets saw a “notable increase in correlation with traditional assets,” with BTC and ETH returning 65.4% and 68.3% in the year, in drops comparable to NASDAQ 100’s 33.6% decline, and with 10-year Treasury bills’ 19% drop.
The firm’s researchers noted that they expect the correlation between digital assets and equities to start declining this year.
As CryptoGlobe reported, Bitcoin has just started trading above its 200-day moving average (MA) for the first time in over a year after the cryptocurrency price rallied over 20% in a week to surpass $21,000.
The 200-day moving average is seen as a key technical indicator by traders and market analysts, as it helps determine the overall long-term market trends. A moving average, according to Investopedia, is an indicator that helps “smooth out price data by creating a constantly updated average price.”
When an asset is above the 200-day moving average, it’s considered to be in an uptrend. Bitcoin’s price started trading above its 200-day moving average at about the same time its Fear & Greed Index rose to “neutral” with a score of 52 for the first time in months, after dropping to 6 – marking a state of “extreme fear” – with the collapse of FTX.
The index, it’s worth noting, is based on emotional behavior in the market. When fear sets in, some investors may see a buying opportunity, while greed may be a sign the market is due for a correction.
Image Credit
Featured Image via Pixabay