Decentralized finance investing is riddled with lots of potholes. Here are several tips on how to avoid them.
DeFi Has A Problem, Pumps And Dumps
Whenever the bull market is in full swing, investing in decentralized finance (DeFi) tokens was similar to shooting fish in a barrel, but now that inflows to the sector reduce in comparison to the market’s heyday, it is quite hard to determine the good trades in the industry.
During the DeFi summer, the protocols managed to attract and convince the liquidity providers by offering three- to four-digit yields and mechanisms like lending through asset collateralization, liquid staking, and token rewards for staking.
The main challenge was that most of these reward offerings were quite unsustainable, and high emissions from some of the protocols made liquidity providers auto-dump their rewards, developing constant sell pressure on a token’s price.
Total value locked (TVL) wars were another challenge faced by DeFi protocols, which had to continuously vie for investor capital to maintain the number of ‘users’ willing to lock their funds within the protocol.
This developed a scenario where mercenary capital from the whales and other cash-flush investors fundamentally airdropped funds to the platforms offering the highest APY rewards for a short period, before ultimately dumping rewards in the open market and shifting the investment funds to the various greener pastures.
For the platforms that Secured series funding from venture capitalists, the same kind of activity happened. VCs pledge funds in exchange for the tokens, and these entities reside in the ranks of the biggest tokenholders in the most lucrative liquidity pools.
The imminent threat of token unlocks from early investors, high reward emissions, and the steady auto-dumping of said rewards led to constant Sell pressure and stood in the way of any investor deciding to make a long-term investment based on the fundamental analysis.
Cumulatively, every single scenario created a vicious cycle where the protocol TVL and the platform’s native token would normally launch, pump, dump, and eventually slip into obscurity.
Rinse, wash, repeat.
The question comes: how does one look beyond the candlestick chart to see whether a DeFi platform is even worth ‘investing’ in?
Is There Revenue?
Here are two market charts.
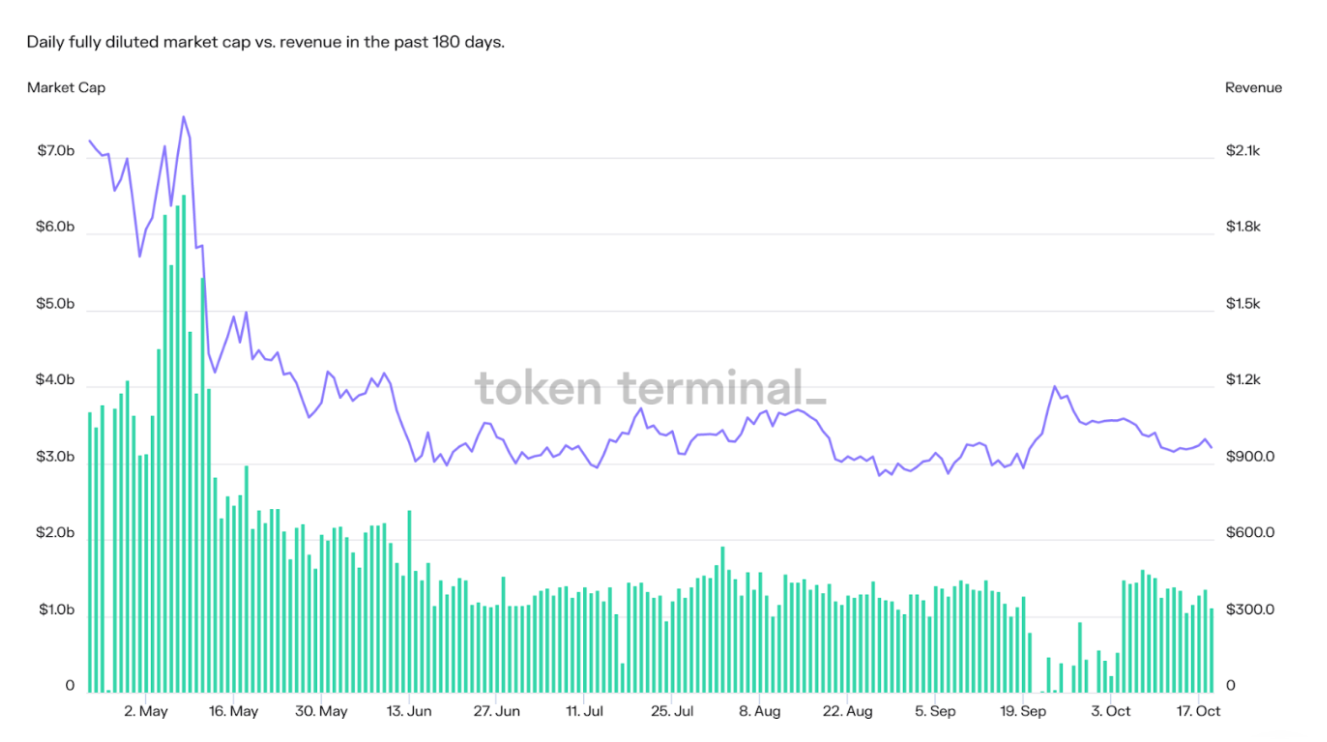
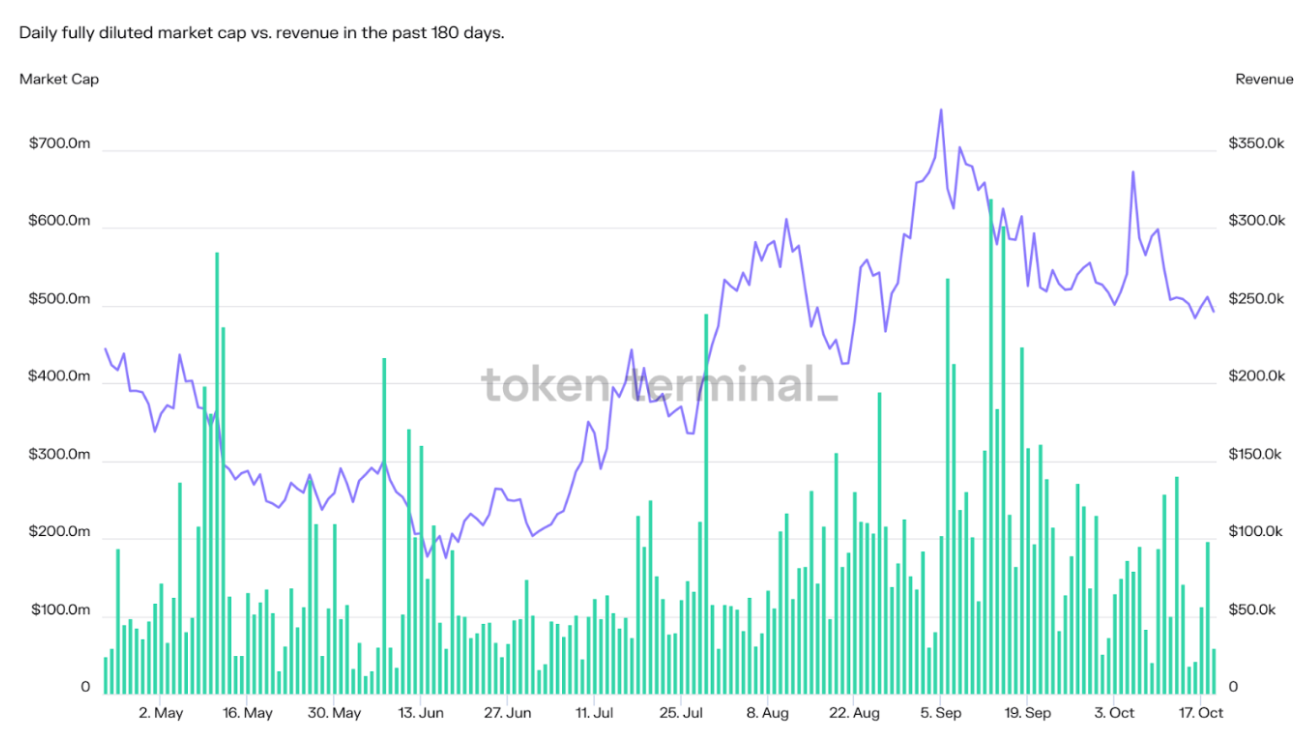
One of them is going up while the other one is going down. Notably, that is the first thing that investors look for, but there is more. In the first chart, you will see that Algorand (ALGO) has a $2.15 billion circulating market capitalization and an entirely diluted market capitalization of $3.06 billion. Nonetheless, its 30-day revenue and annualized revenues are $7,690 and $93,600, respectively. Interesting, isn’t it?
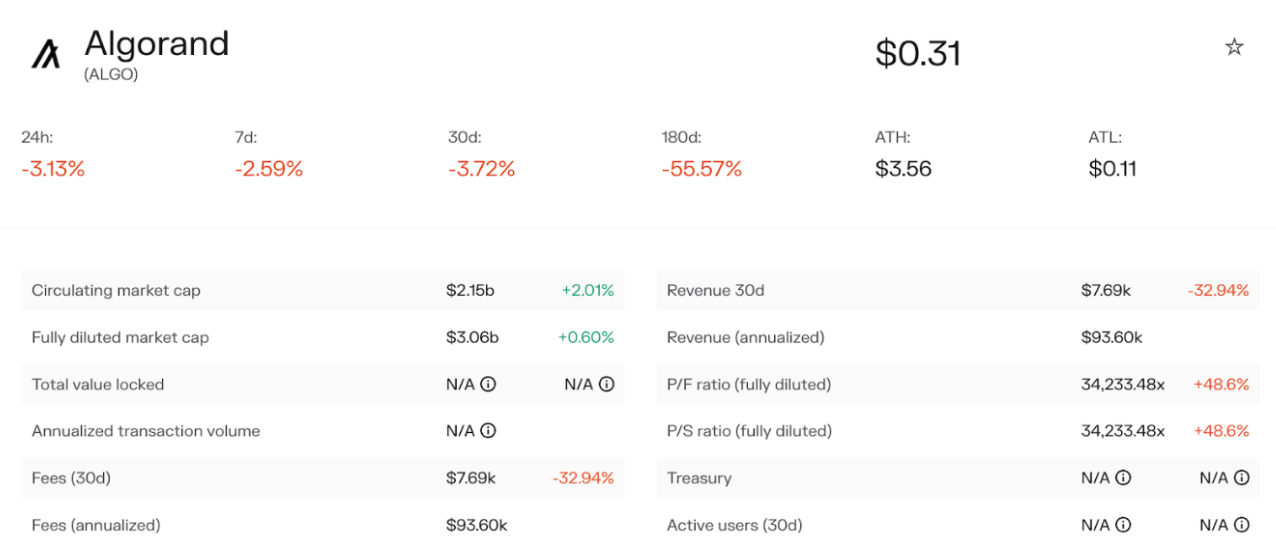
Circling back to the first chart, it is evident that while maintaining a $2.15-billion circulating market cap and simultaneously supporting a wide ecosystem of assorted decentralized applications (dApps), Algorand just managed to produce $336 in revenue on October 19.
Unless there is something wrong with the data or some metrics related to Algorand and its network are not captured by Token Terminal, this is quite shocking. Looking at the chart legend, one will also note that there are no viable token incentives or supply-side fees distributed to liquidity providers and token stakers.
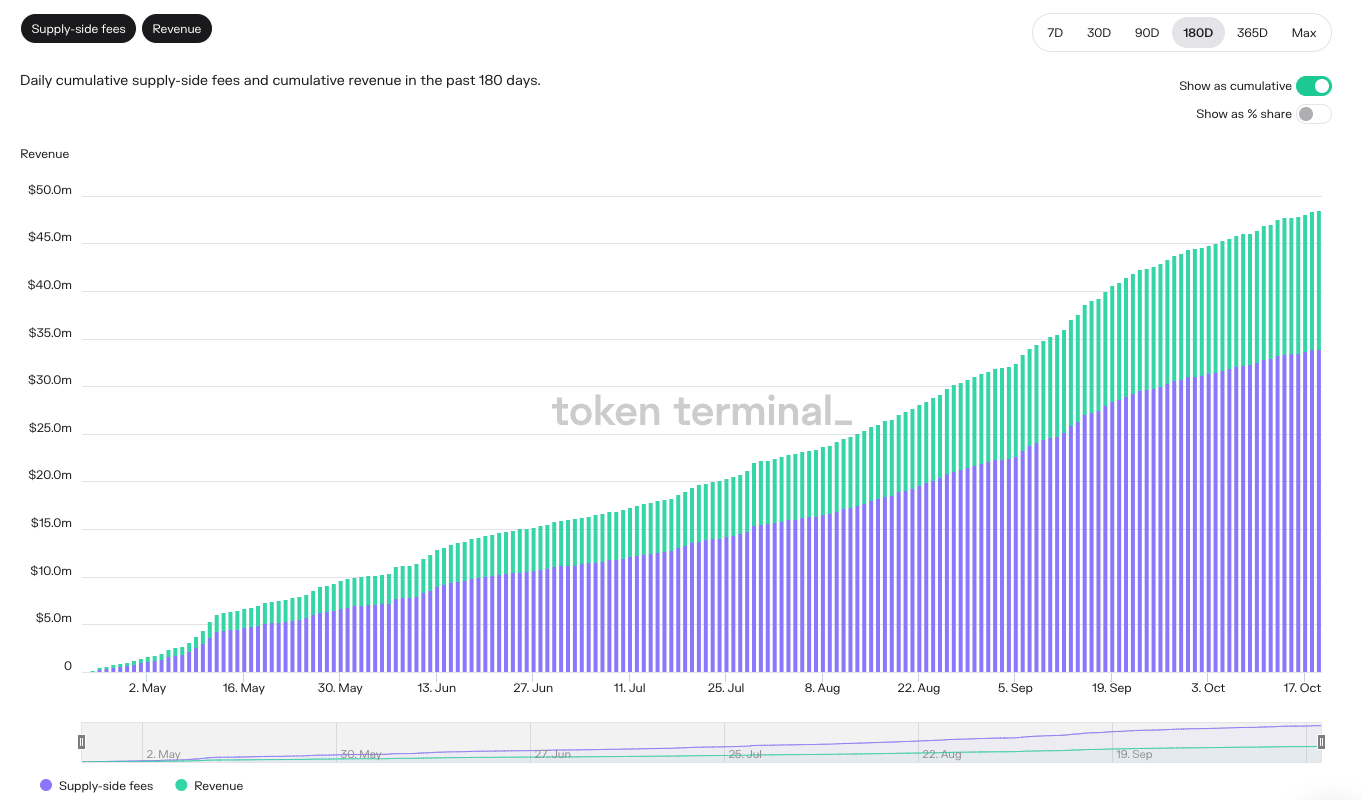
On the other hand, GMX tells a different story. While maintaining a circulating market capitalization of $272 million and an annualized revenue of $28.92 million, GMX’s cumulative supply-side fees have continuously increased to reach $33.9 million since April 24, 2022. The supply-side fees represent the percentage of fees that go to service providers, including liquidity providers.
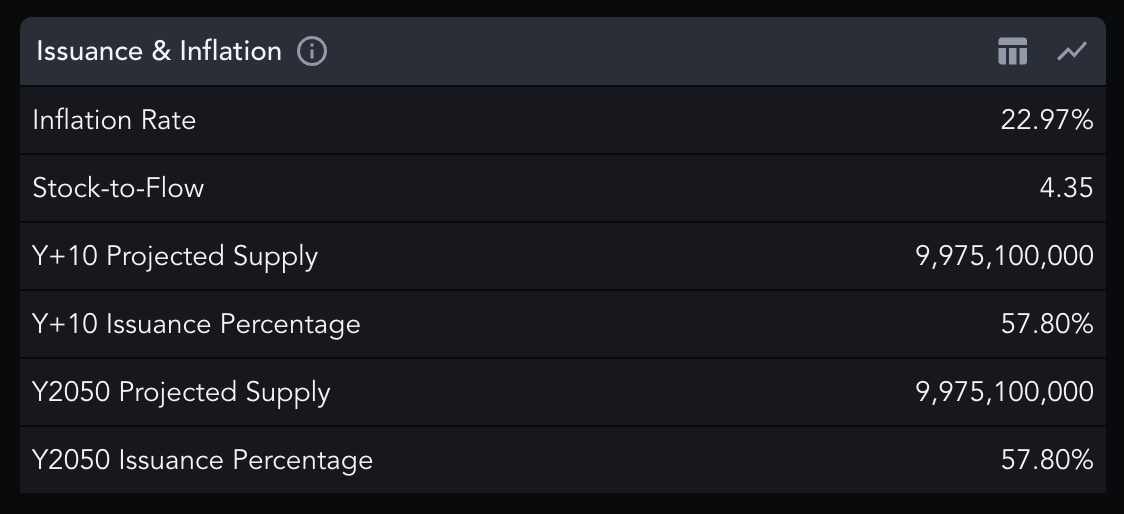
Issuance And Inflation
Before investing in decentralized finance (DeFi) project, it is important to look at the token’s total supply, inflation rate, circulating supply, and issuance rate. The metrics measure the number of tokens currently circulating in the market and the projected increase (issuance) of the tokens in circulation.
When it comes to decentralized finance tokens and altcoins, dilution is something that investors should be worried about, hence the allure of Bitcoin’s supply cap and low inflation.
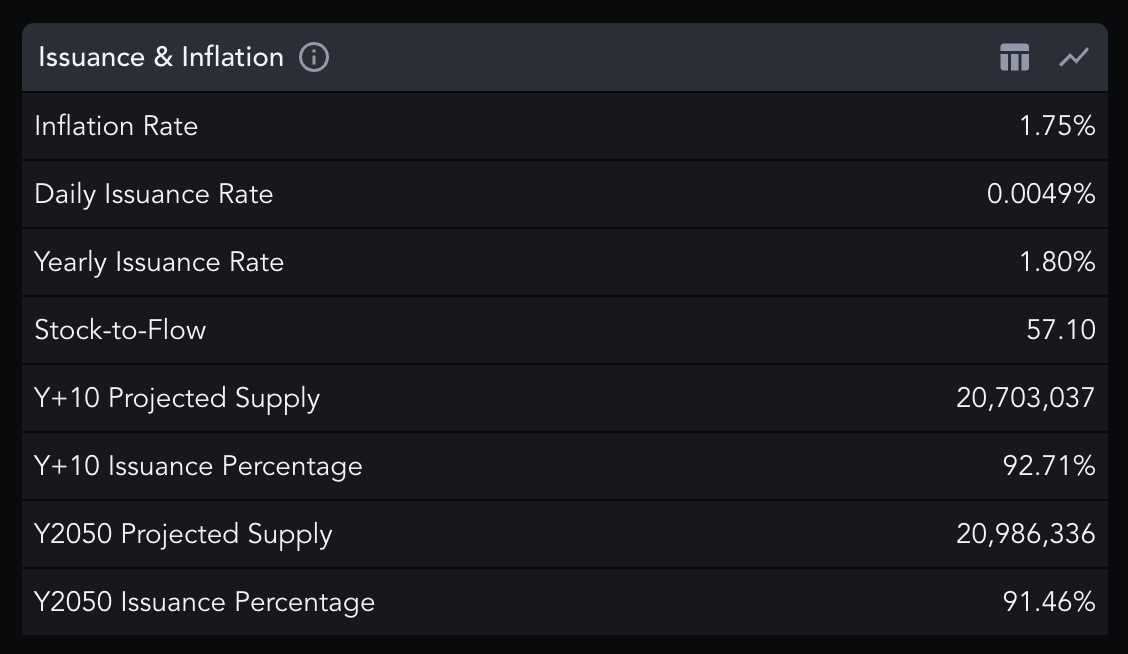
As indicated, compared to BTC, ALGO’s inflation rate and projected total supply are high. ALGO’s total supply is capped at 10 billion, with data indicating that 7 billion tokens are in circulation currently, but given the current revenue that is generated from the fees and the amount shared with the tokenholders, the supply cap, and inflation rate does not inspire a lot of confidence.
Before taking up a position in ALGO, investors need to look for more growth and daily active users of Algorand’s DApp ecosystem, and there needs to be an uptick in revenue and fees.
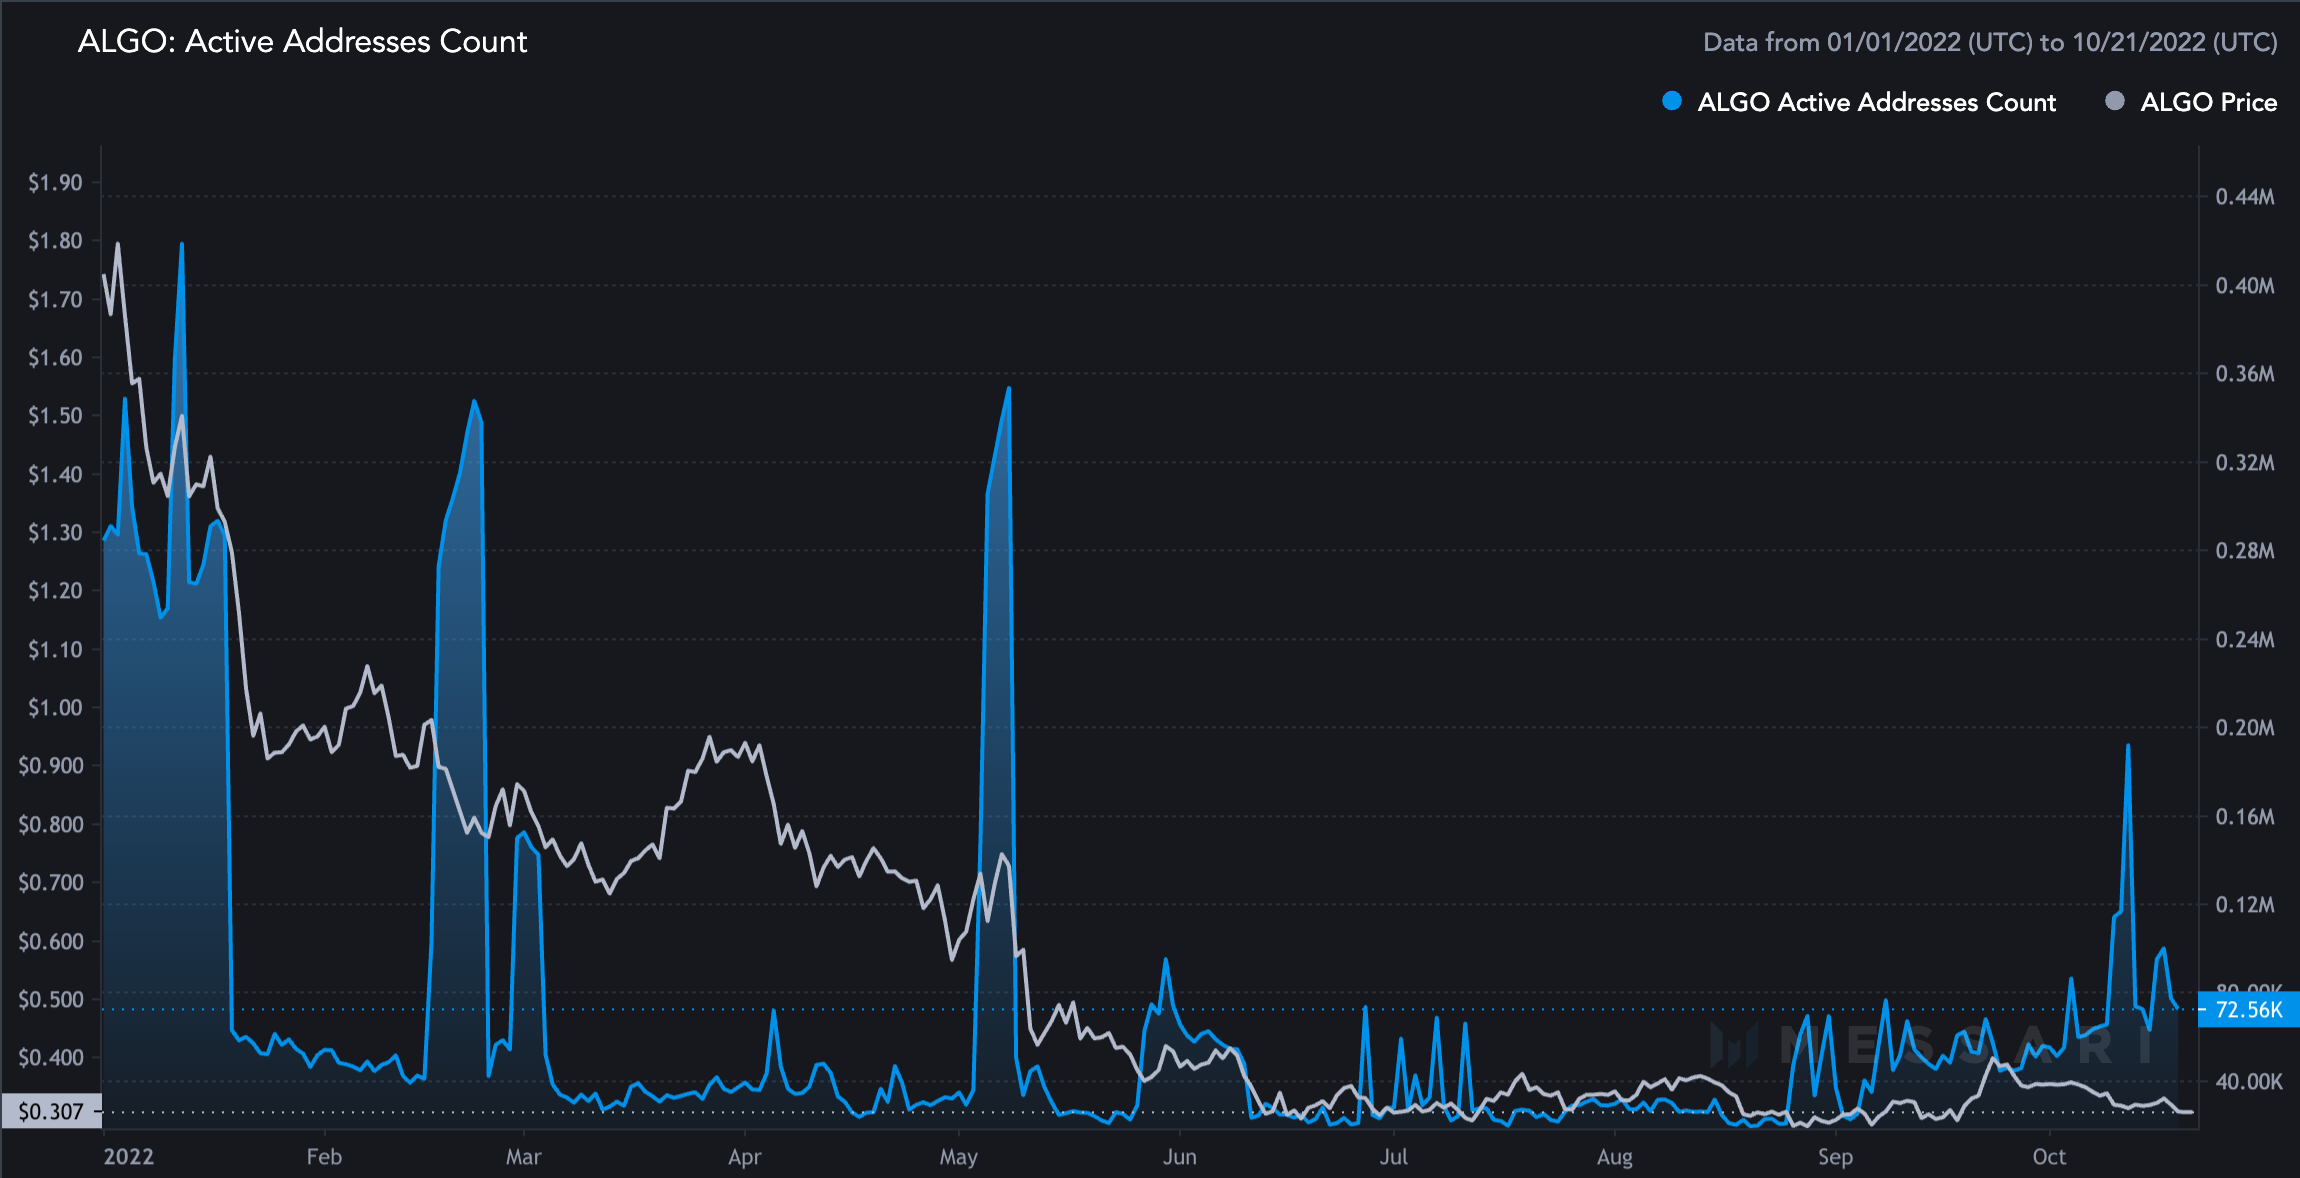
Active Addresses And Daily Active Users
Whether revenues are high or low, two other important metrics to consider are active addresses and daily active users in case the data is available. Algorand has a multi-billion-dollar market cap together with a 10-billion ALGO max supply.
However, low annual revenue and few token incentives present the question of whether the ecosystem’s growth is anemic.
Based on the chart below, it seems like ALGO active addresses are surging, but generally, the growth is flat, and the active address spikes appear to follow price spikes and sell-offs. As of October 14, 2022, there were 72,624 active addresses on Algorand.
Like a majority of the decentralized finance protocols, the Polygon network has also seen a steady drop in daily active users and MATIC’s price. Data acquired from CryptoQuant shows 2,714 active addresses, which is considerably lower compared to the 16,821 seen on May 17, 2021.
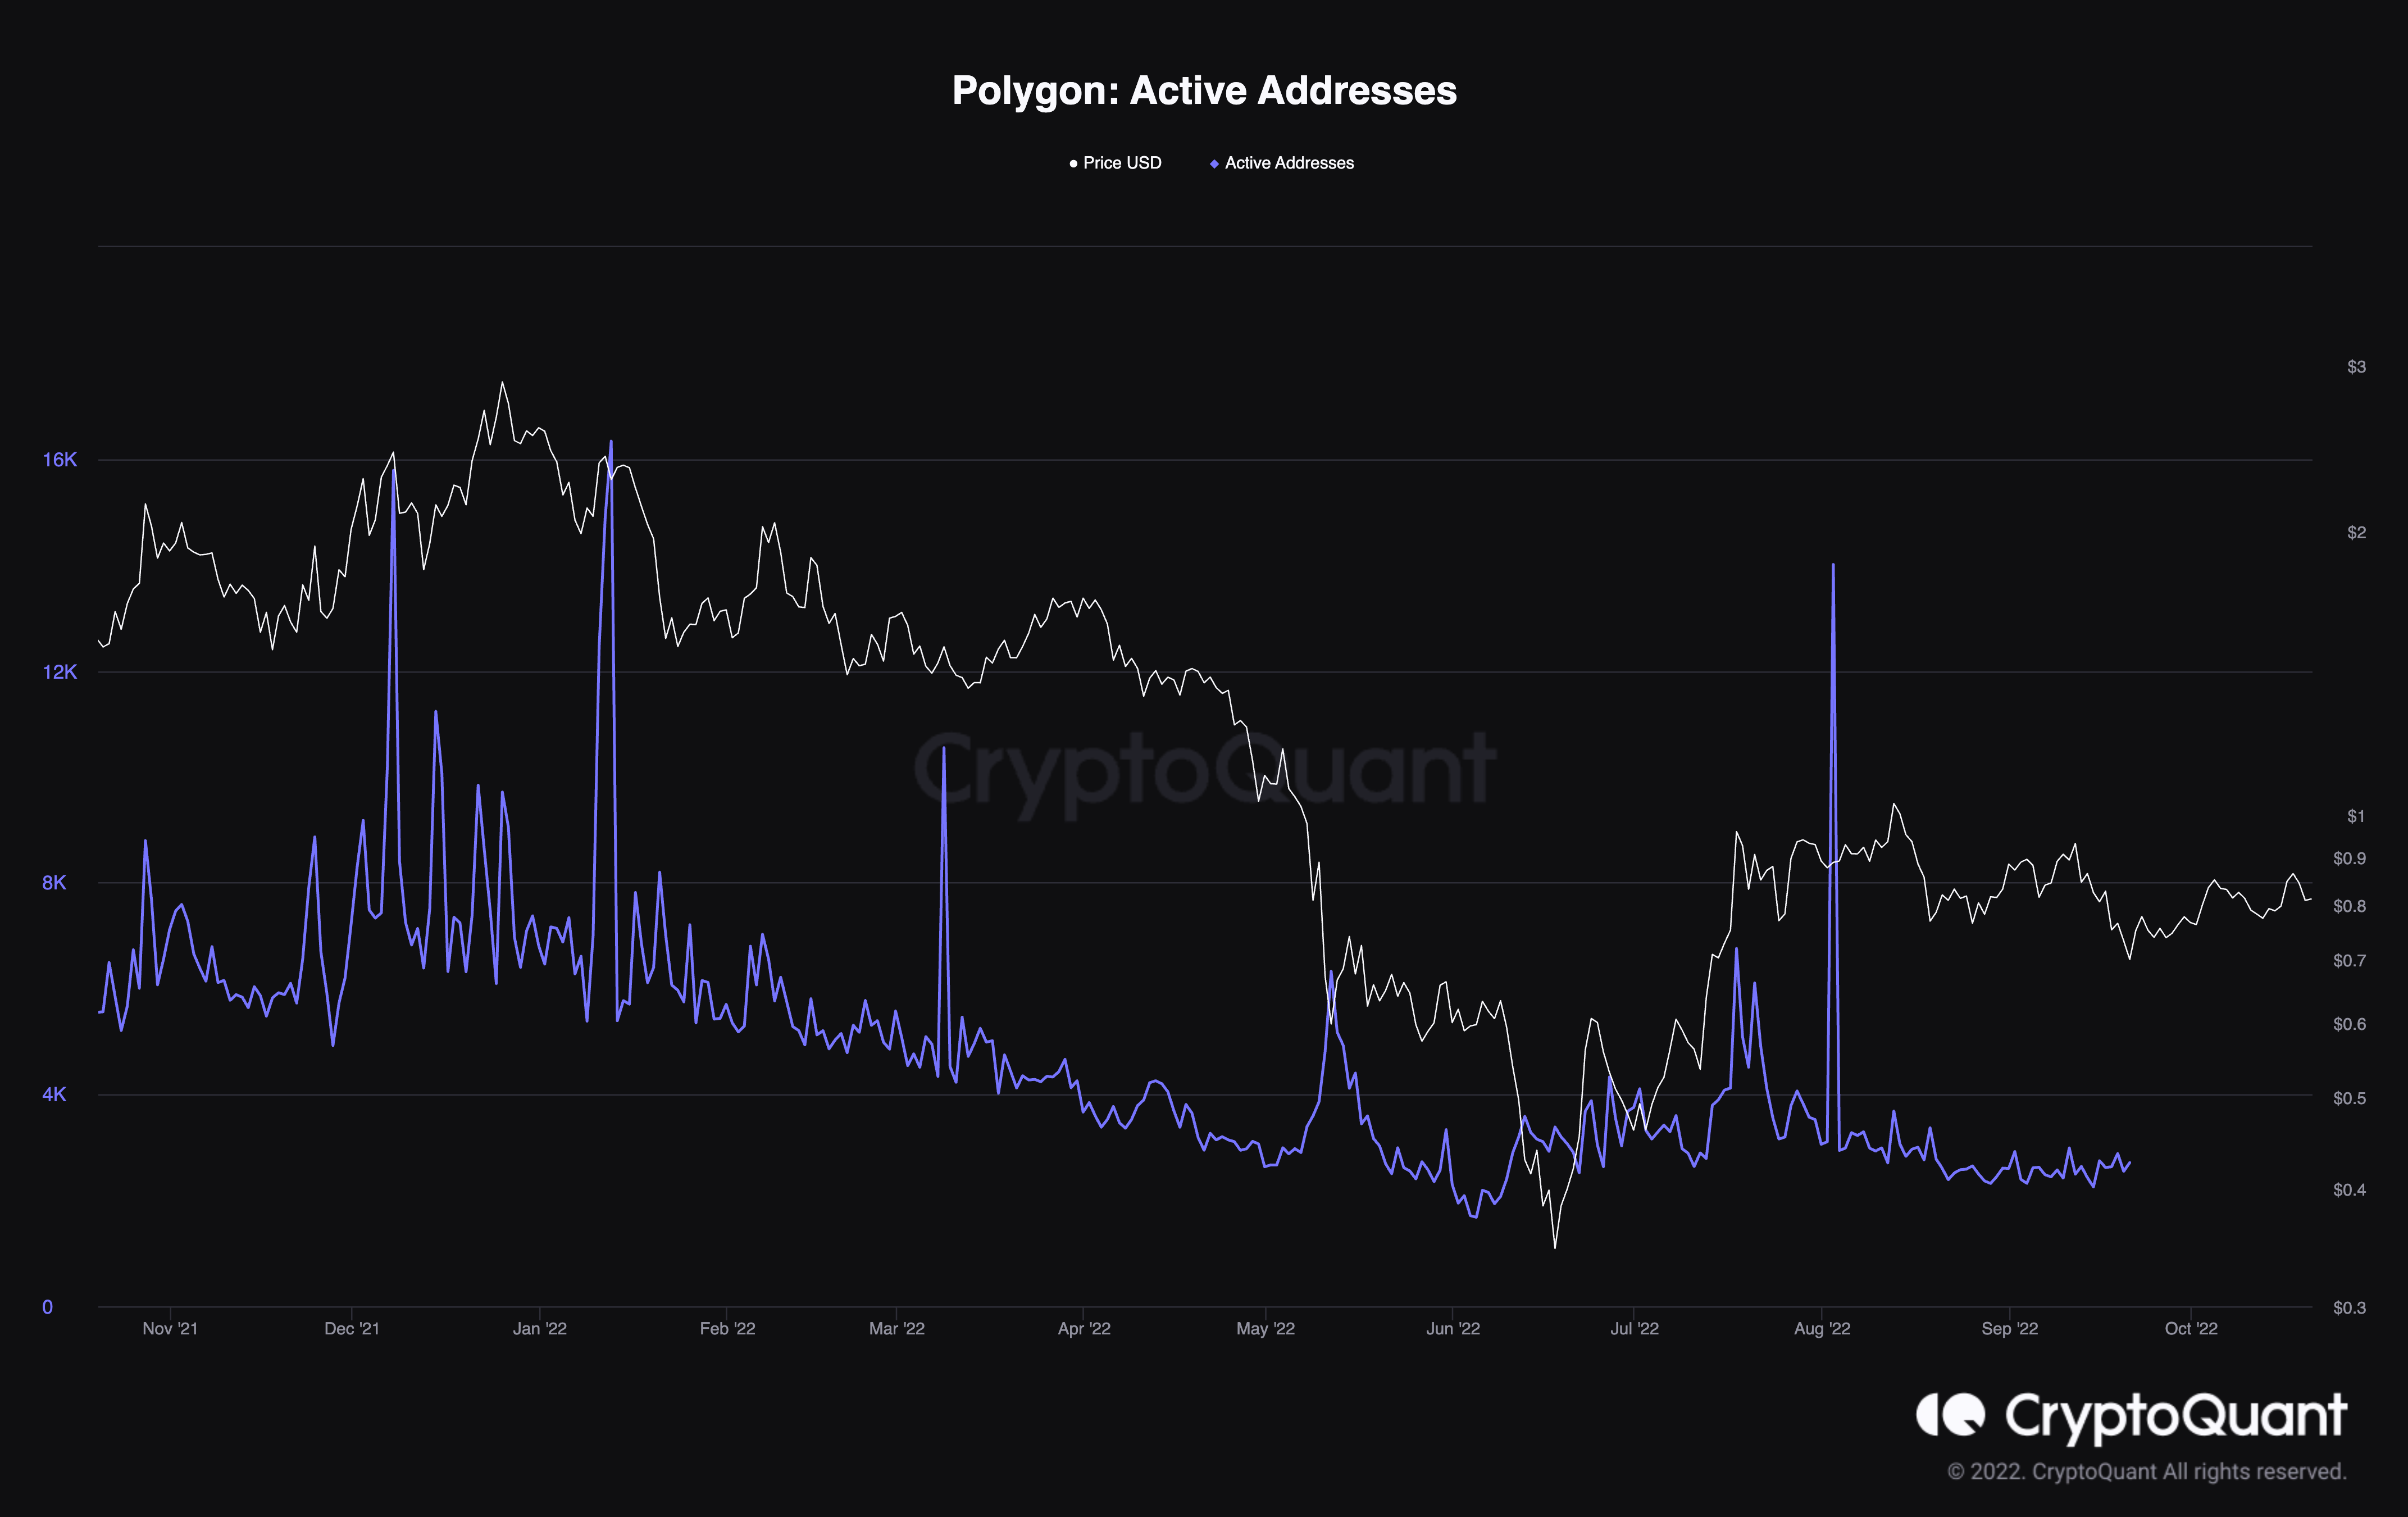
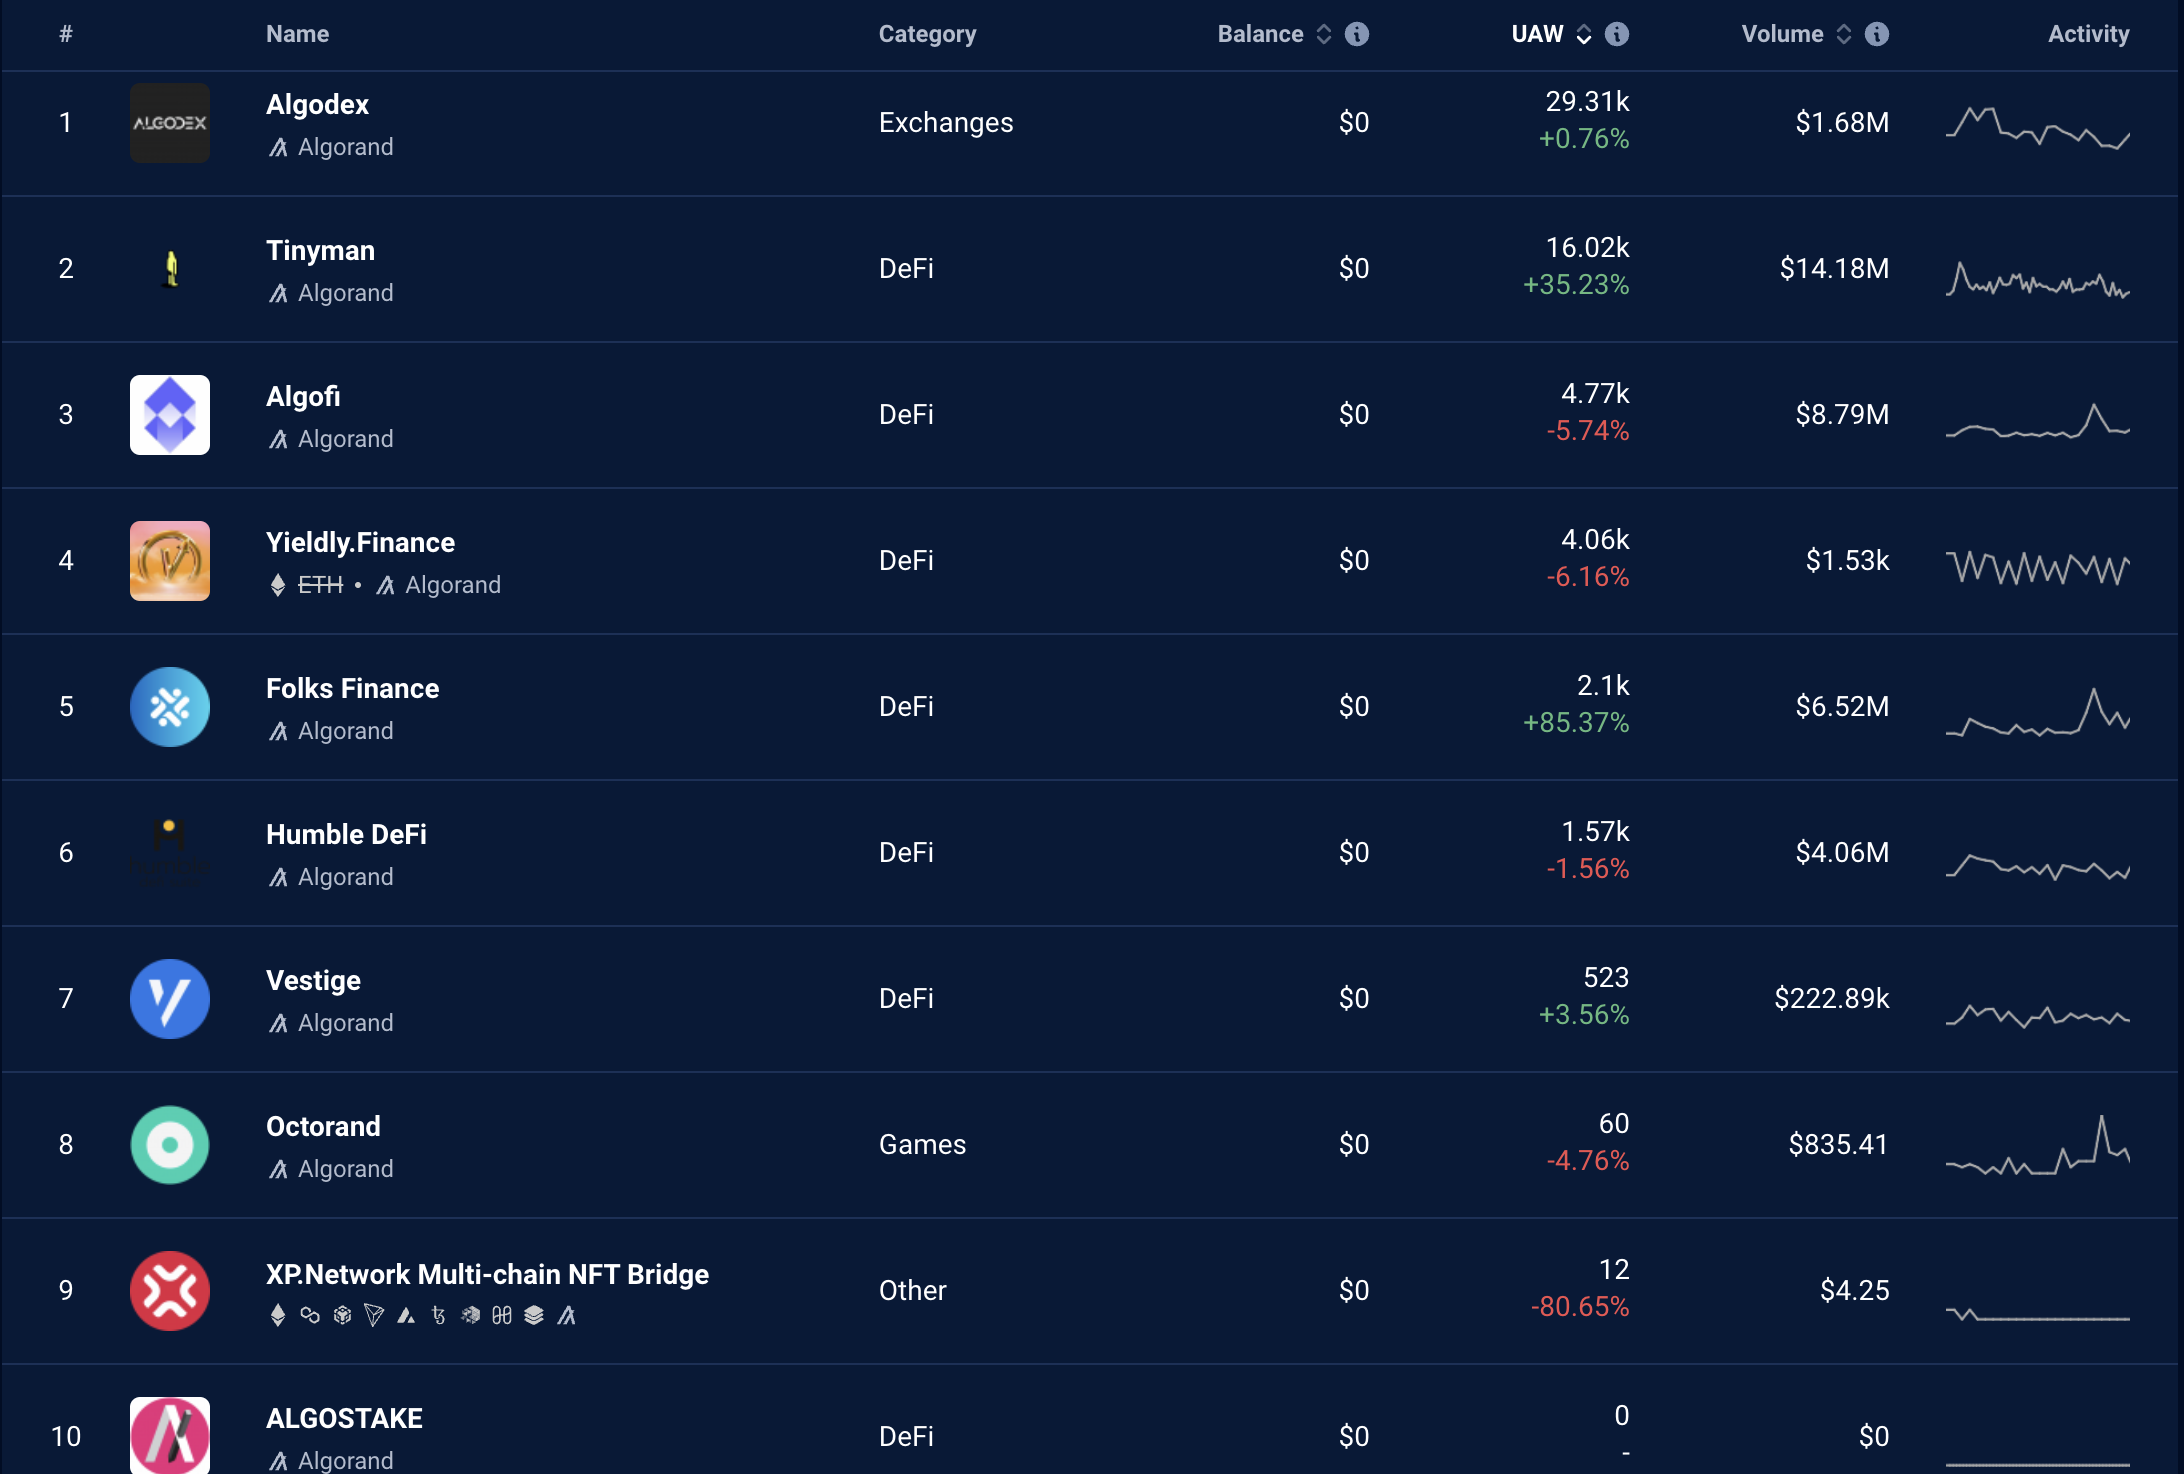
Despite the drop, data from DappRadar represents a good deal of user activity and volume spread across different Polygon decentralized applications.
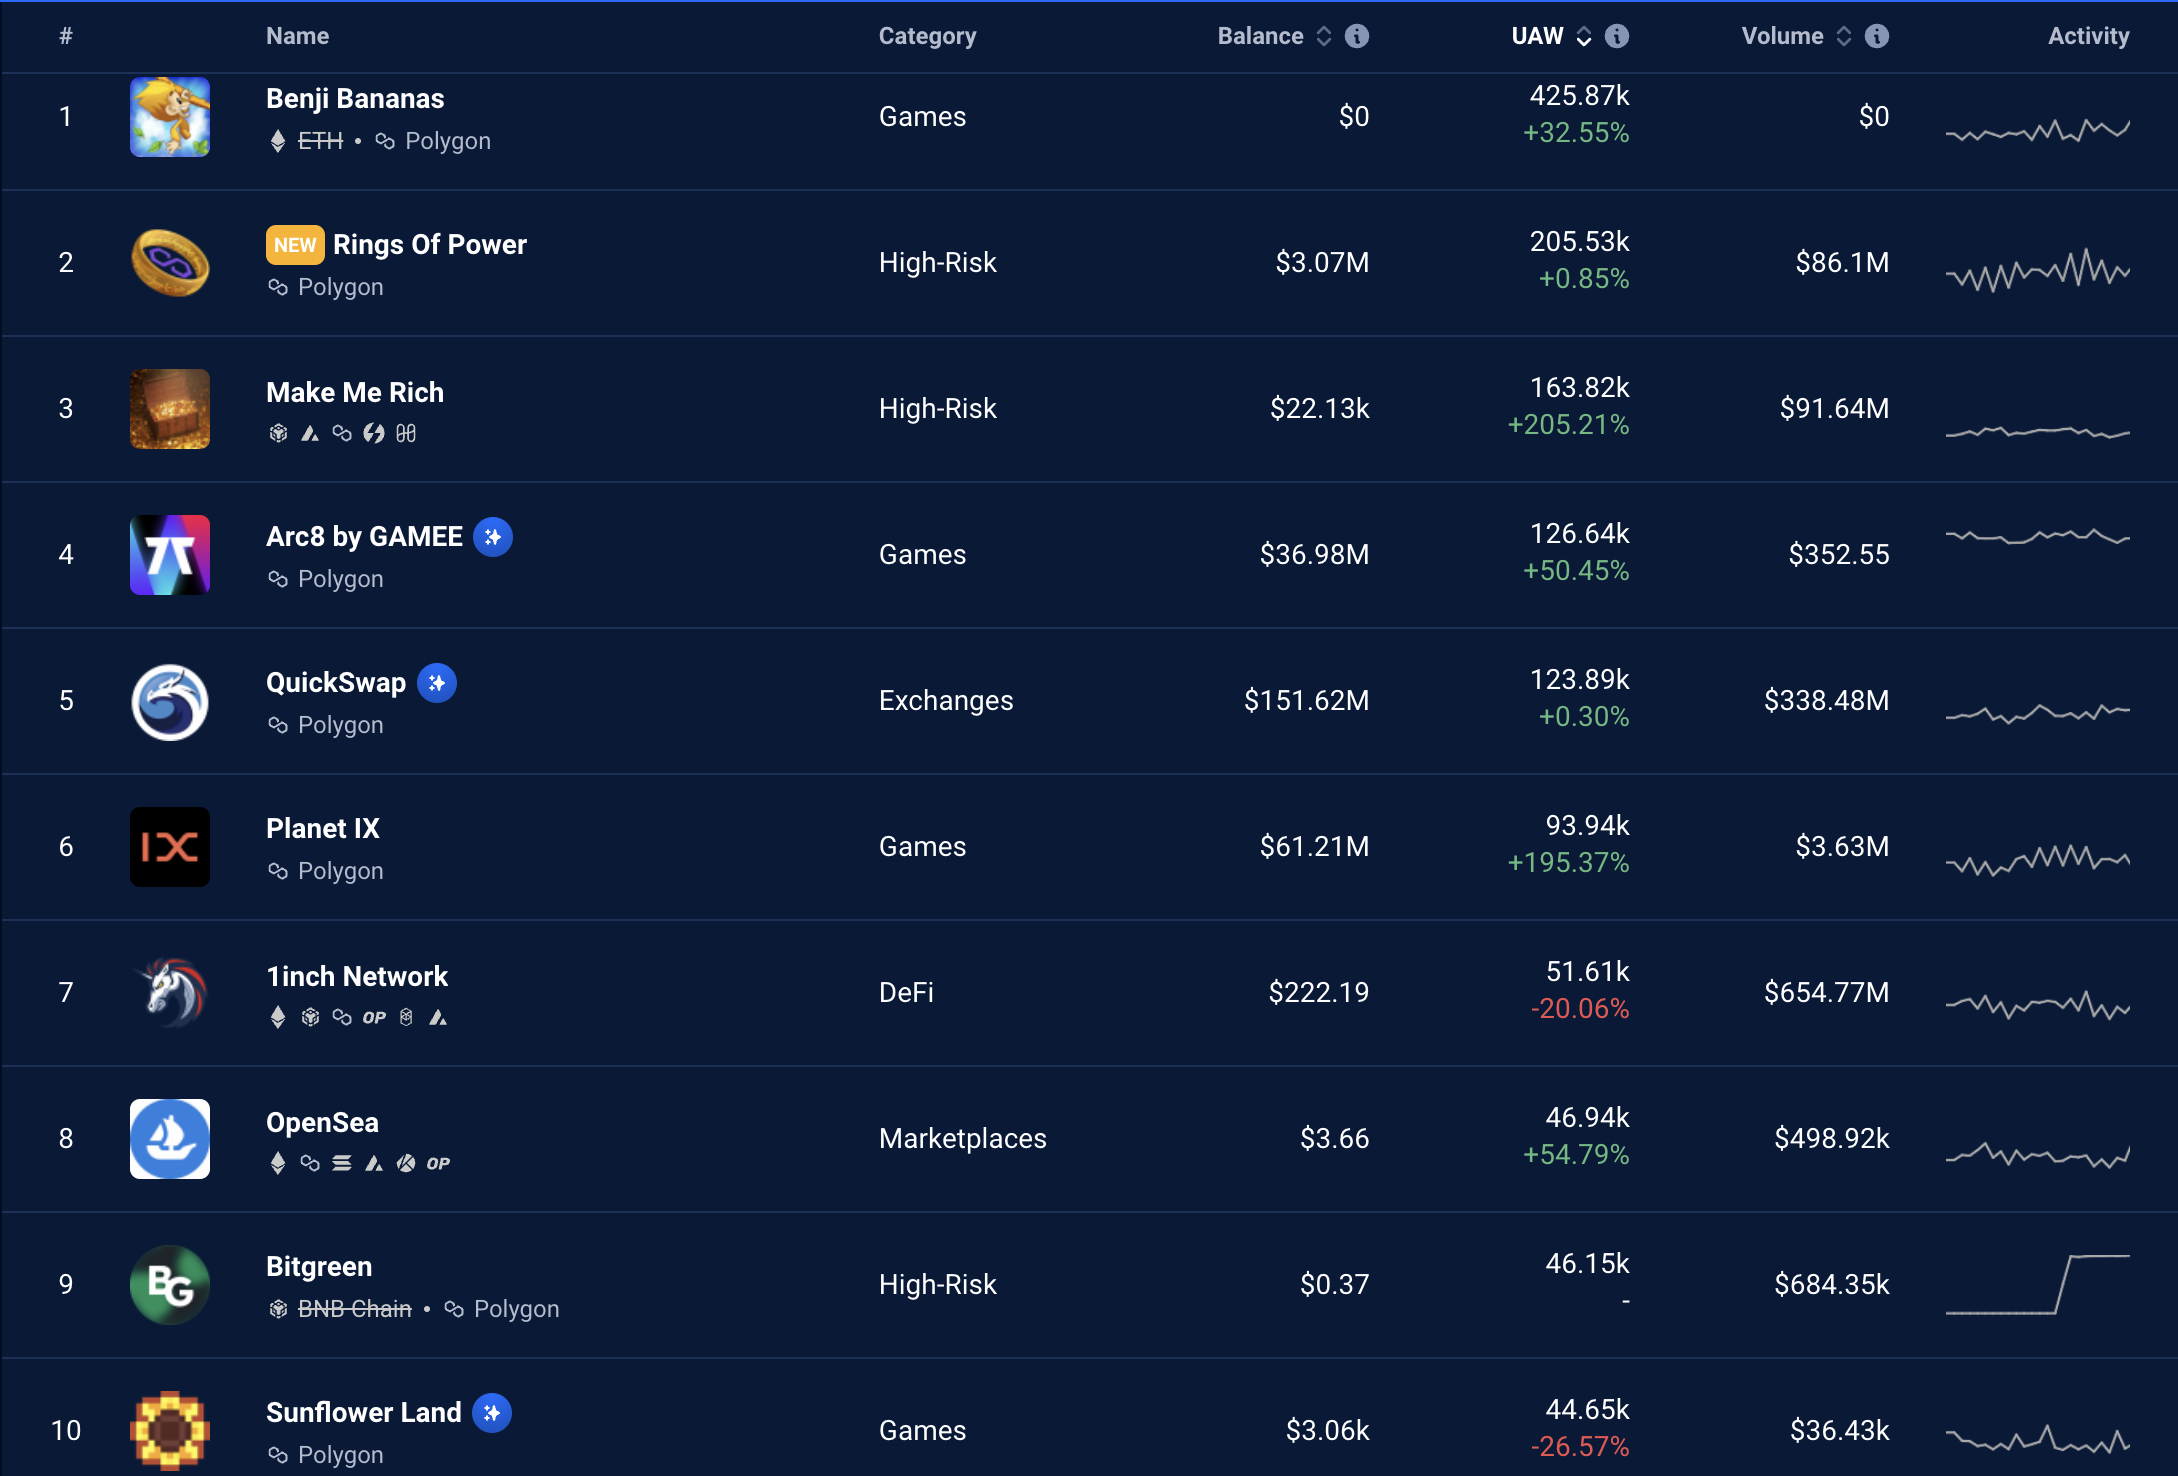
The same cannot be said for the dApps on Algorand.
Currently, the cryptocurrency market is in a bear market, and it complicates trading for most investors. Today, investors should maybe sit on their hands instead of taking kiss-and-a-prayer moon shots at each small breakout that turns out to become bull traps.
Investors may be better served by just sitting on their hands and tracking the data to see when new trends come up, then looking deeper into the fundamentals that may back the sustainability of the new trend.