Key highlights:
- Bitcoin is up by a small 4.4% today as it currently battles with resistance around $35K.
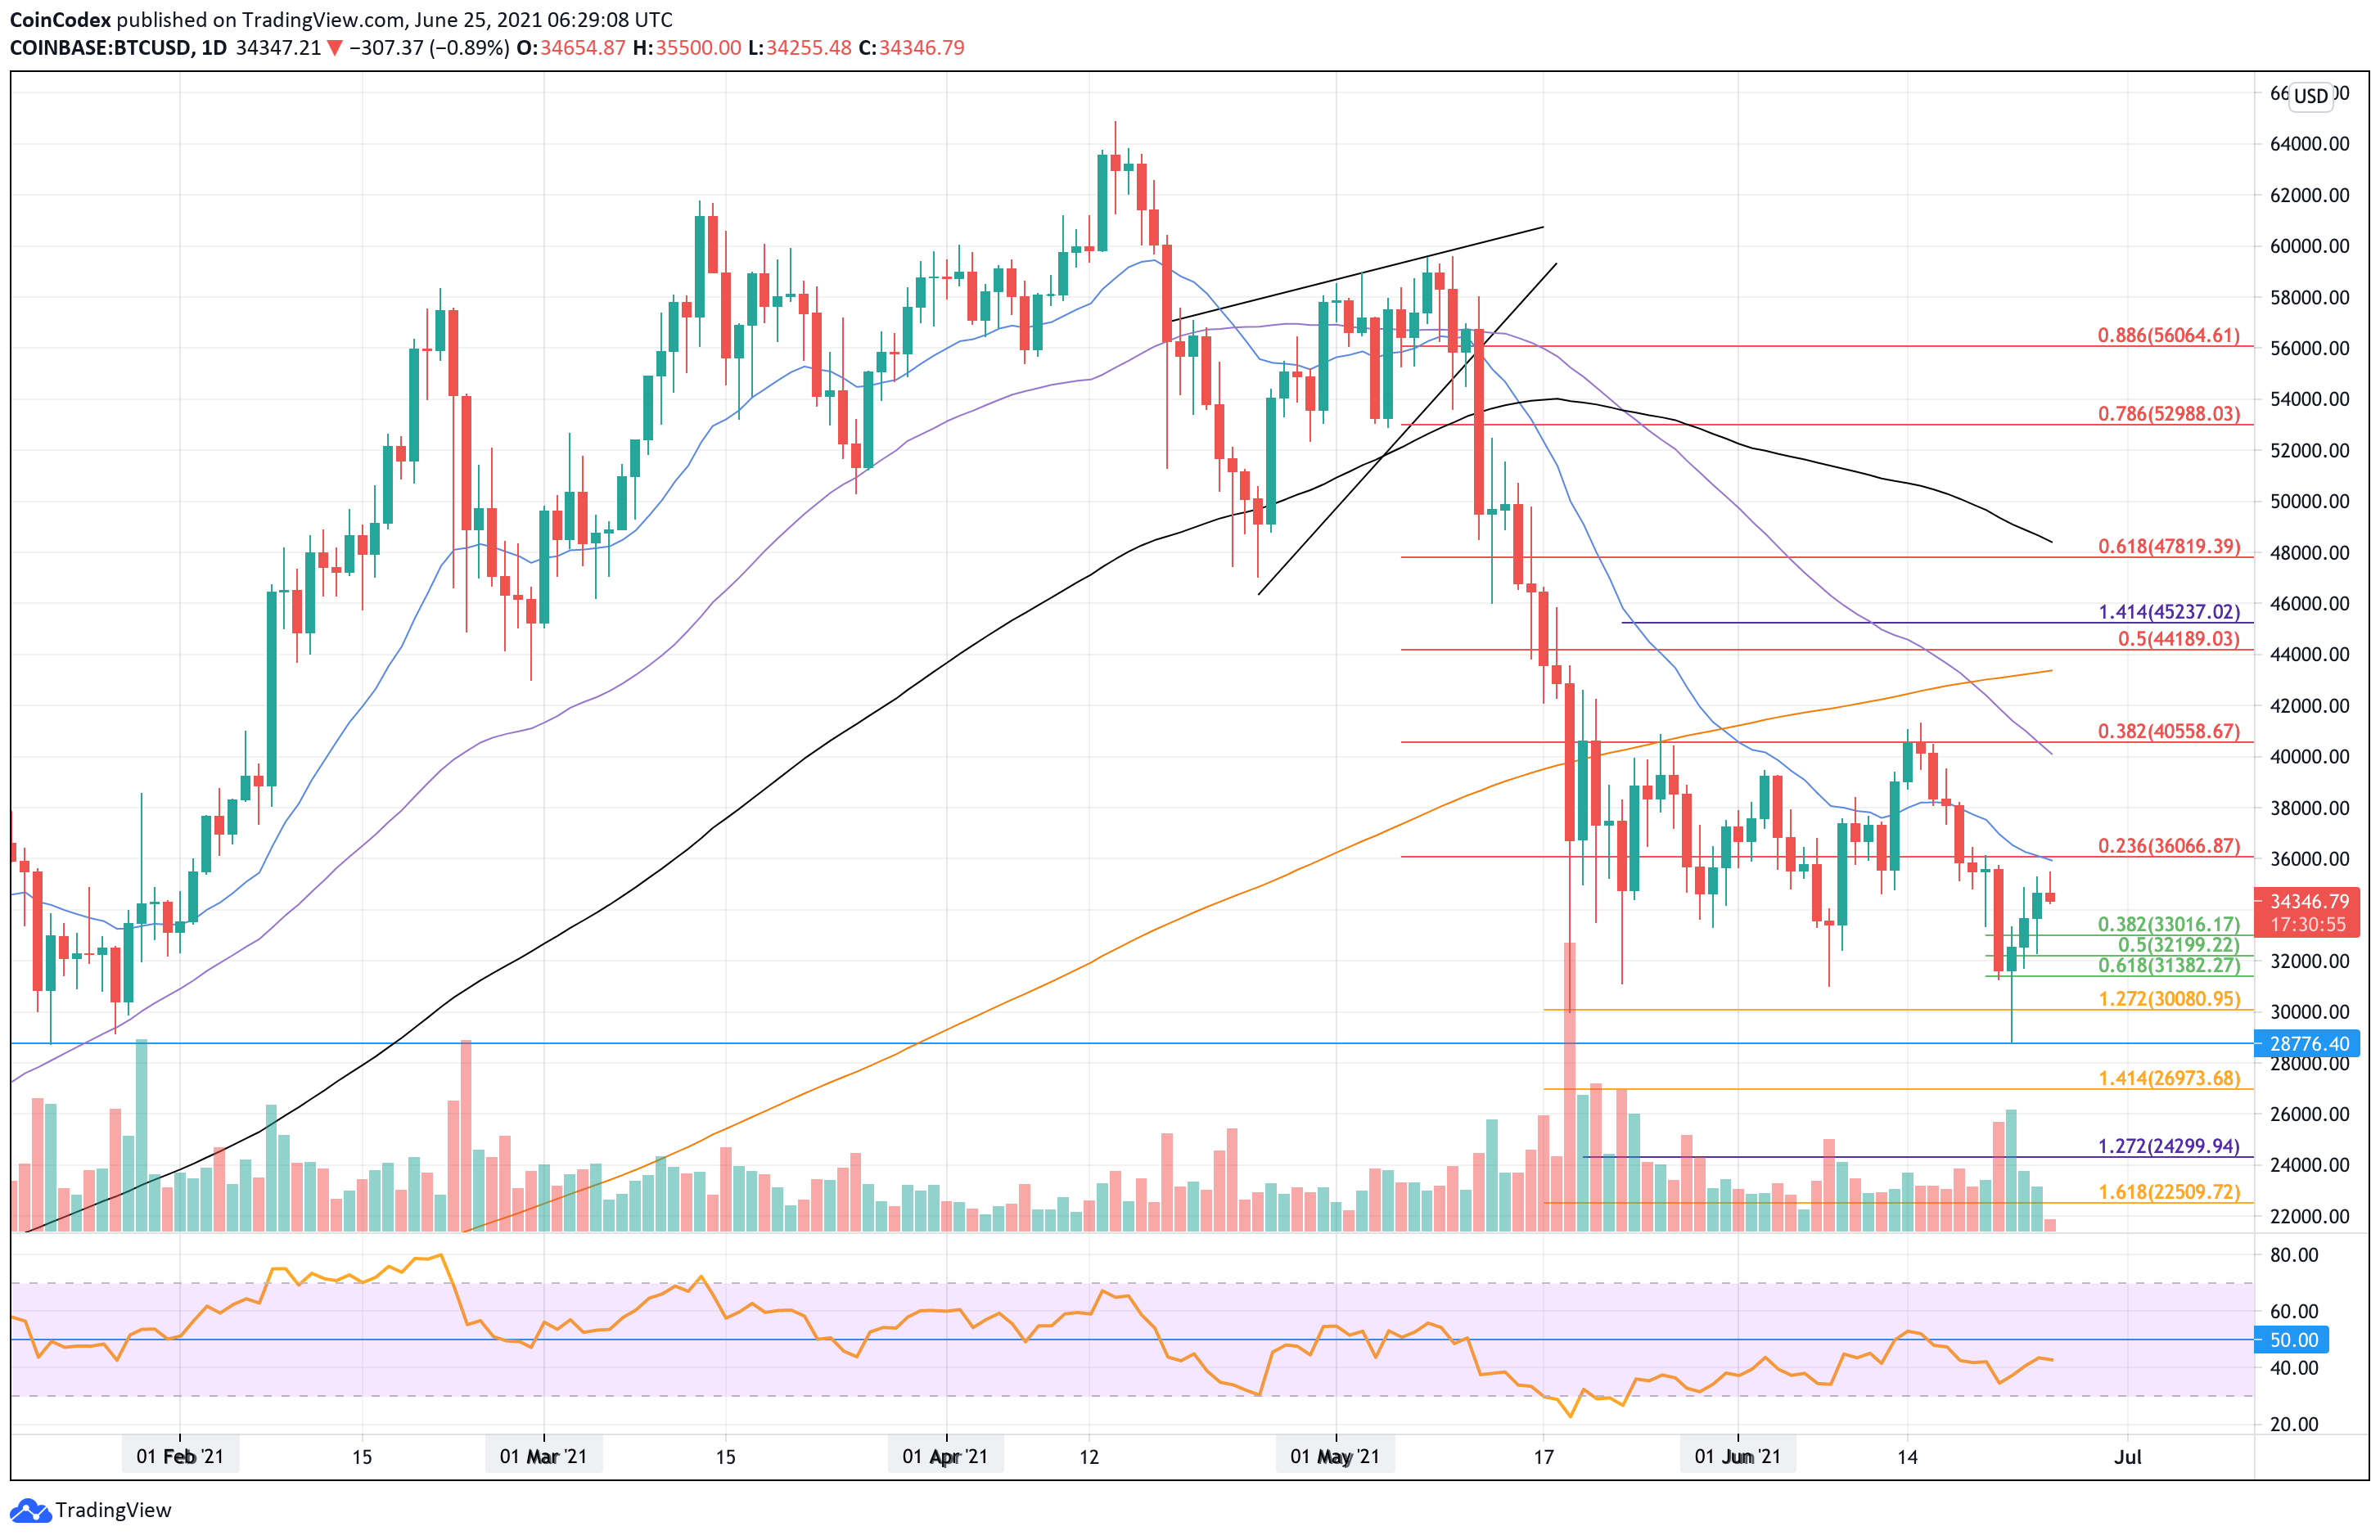
- The number one ranked cryptocurrency put in the first “Three White Soldiers” pattern since the May capitulation - three consecutive bullish candles.
- Despite the rebound, BTC still has very strong resistance ahead at $42K.
Buy Bitcoin on Binance
| Bitcoin price | $34,111 |
|---|---|
| Key Bitcoin resistance levels | $35,000, $36,000, $36,515, $37,500, $38,000 |
| Key Bitcoin support levels | $34,000, $33,000, $32,200, $32,000, $31,155 |
*Price at the time of publication
Bitcoin is up by 4.4% today as the cryptocurrency finds resistance at $35,000. The cryptocurrency had found 4HR support at $31,155 (.886 Fib Retracement) earlier in the week and has since started a short-term rebound toward $35K (bearish .5 Fib Retracement).
Roughly two weeks ago, El Salvidor passed a law that makes Bitcoin legal tender. The president of the country announced that the government would be airdropping $30 worth of BTC to every citizen in the country.
This announcement sent the market into a frenzy as people started to realize that El Salvidor would need to buy over $100 million worth of BTC to be able to send $30 worth to each of its 4.5 million citizens.
Renowned Twitter fundamentalist, Willy Woo, pointed out that the Bitcoin user count would increase by 2.5%, assuming that all of the citizens would take up the offer;
Assuming all 4.5m adults in El Salvador take up this offer, it’s roughly a 2.5% overnight boost to #bitcoin’s global user count. https://t.co/KwkYvb2fEE
— Willy Woo (@woonomic) June 25, 2021
Speaking of Willy Woo, with the strong rebound from $28,000 this week, there is data to show that strong hands are increasingly buying up Bitcoin as the price is going down;
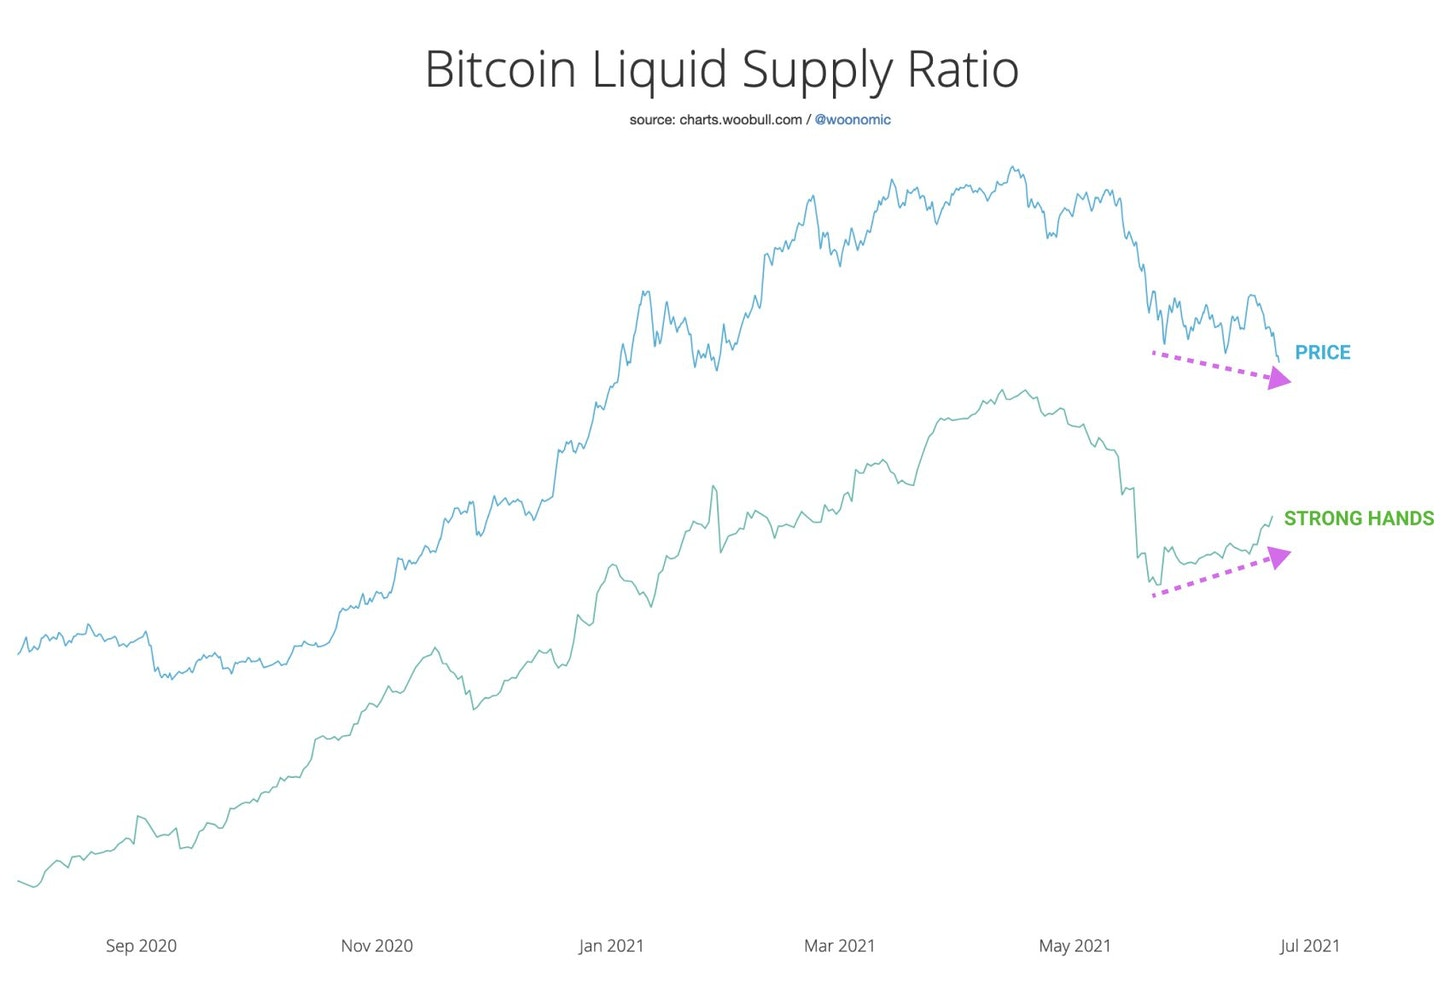
The Bitcoin Liquid Supply Ratio shows the rotation of BTC from weak hands to strong hands. The chart shows that there is a clear bullish divergence in the ratio as the total number of BTC owned by strong hands continues to increase while the price drops.
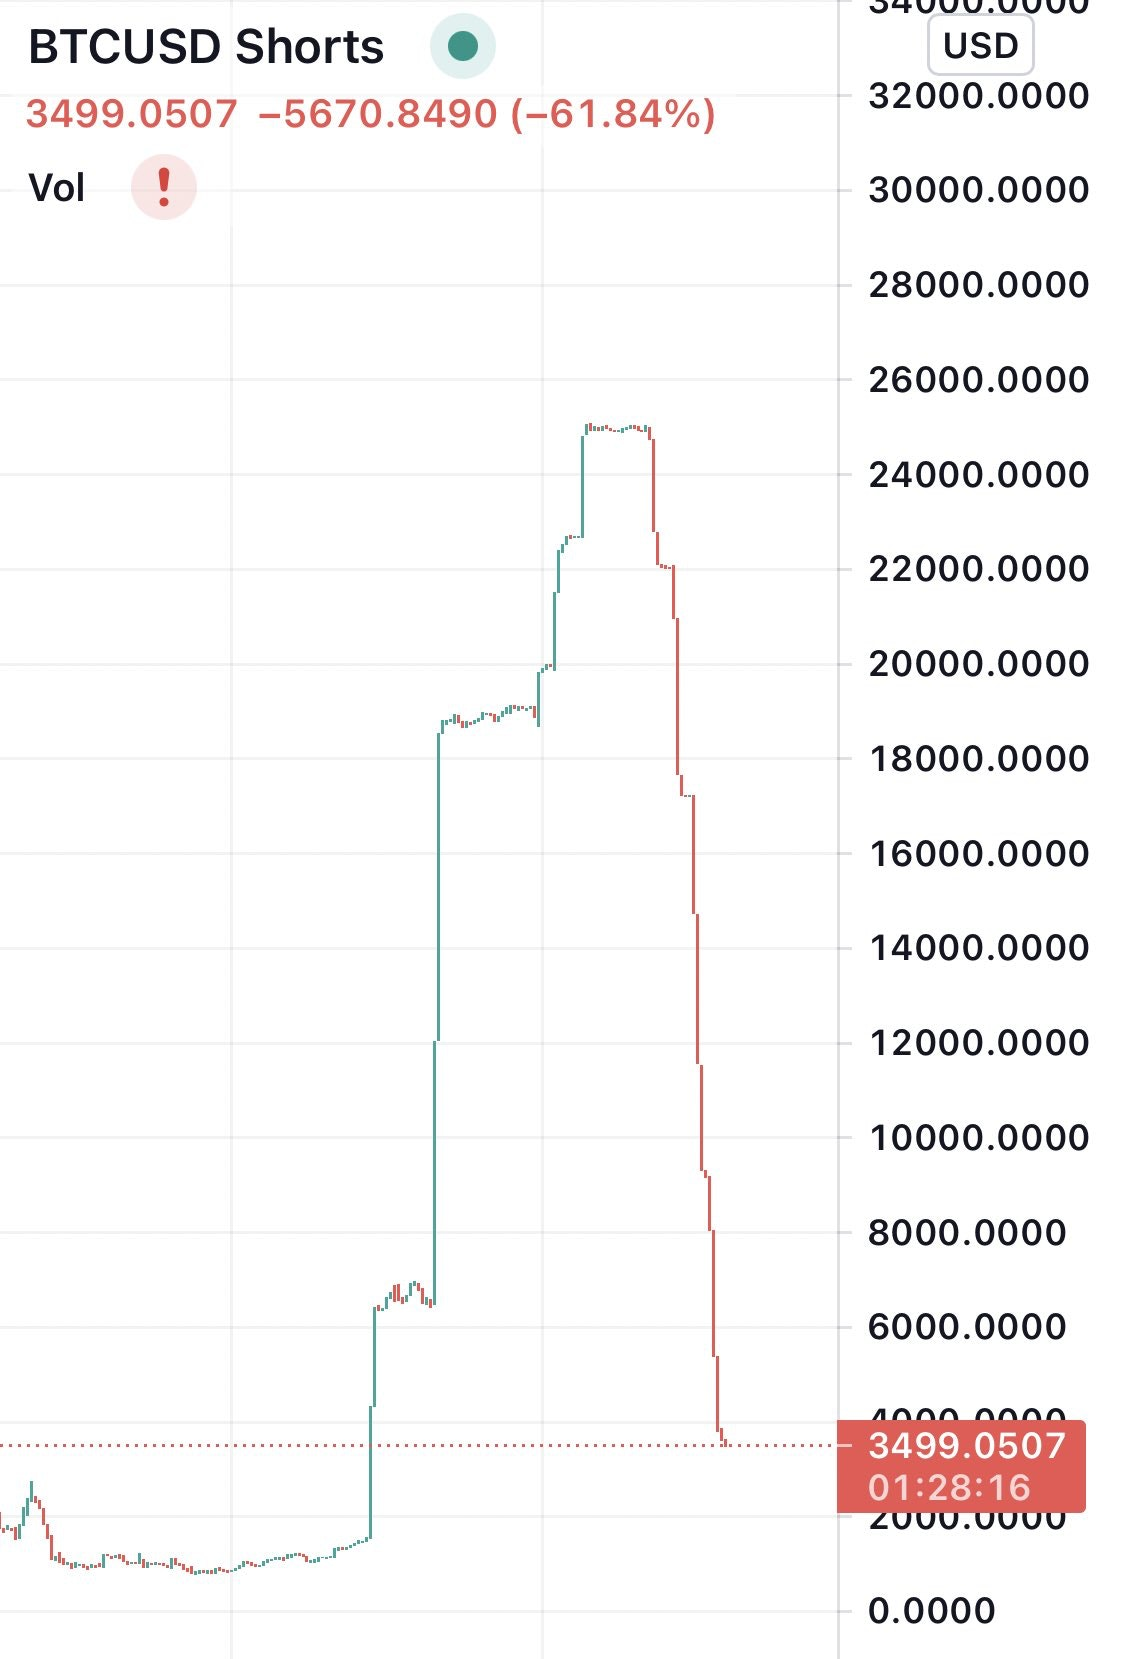
Additionally, it seems that Bitfinex whales have started to cover their short positions on the exchange. Although this is not explicitly bullish, it does show that the bears might be starting to turn neutral and could be worried about being squeezed out of any short positions;
Even with the recent FUD attacks from Elon Musk and the bearish news with China banning all miners, we need to step back and remember that investing in Bitcoin is a long-term endeavor. In fact, there is evidence to suggest that anybody who invested BTC over a 4-year period has never lost any money;
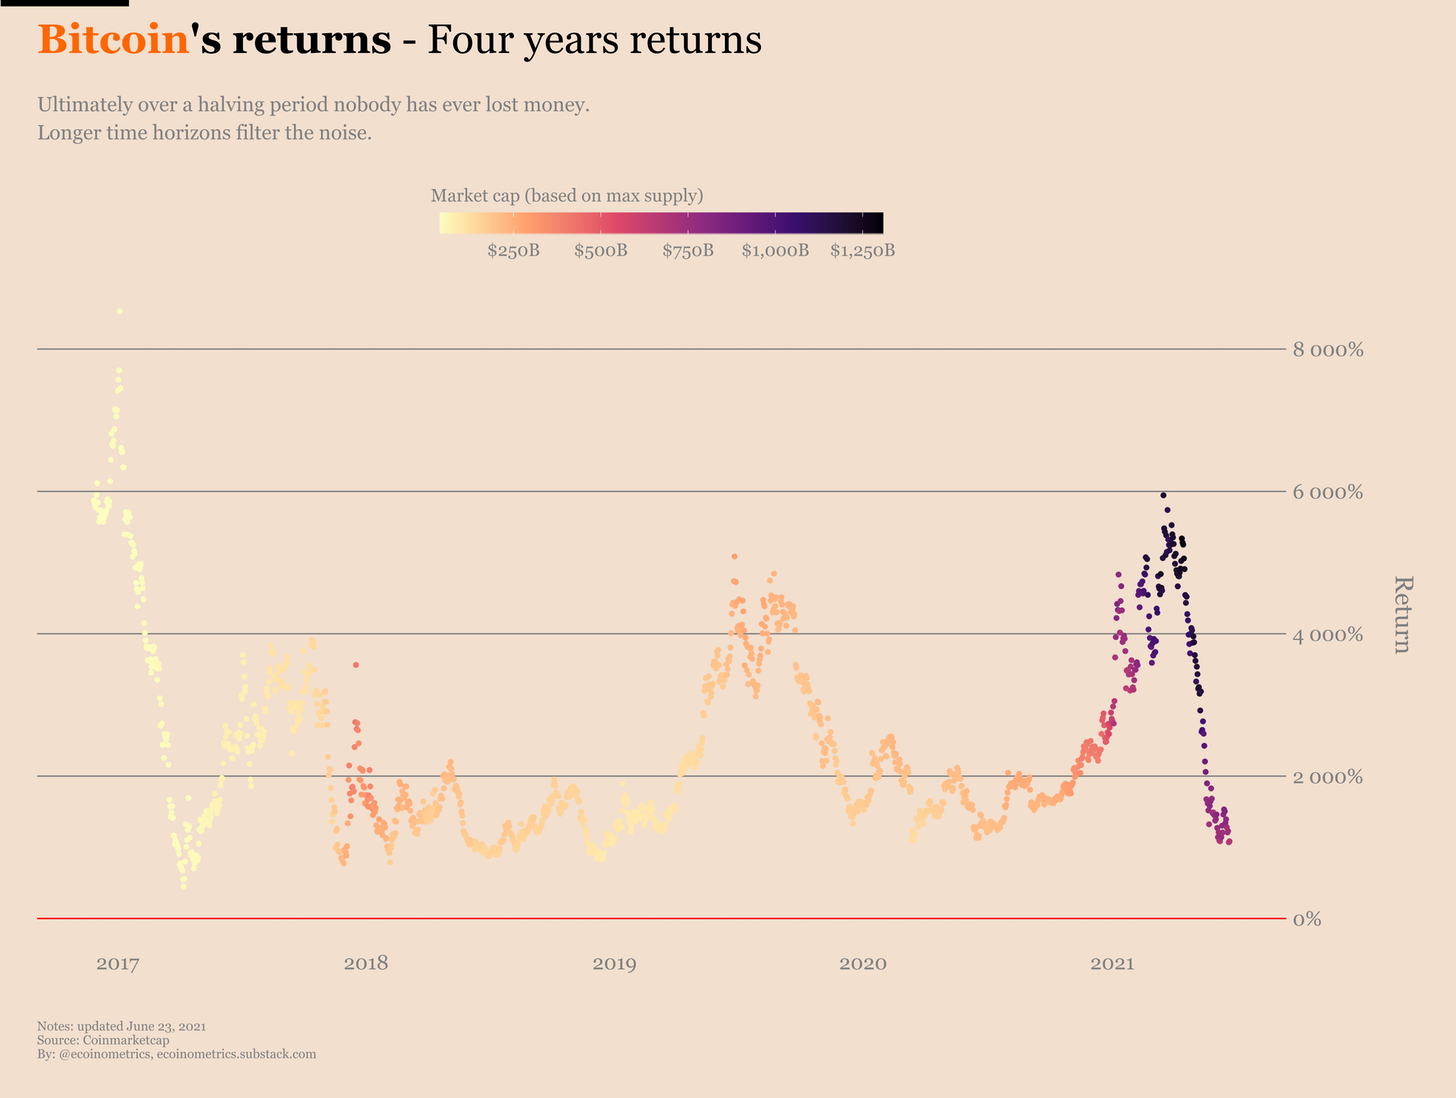
The Bitcoin four-year returns chart shows that those who held BTC for a four-year period always made money well within returns of over 1000%.
Looking at some alternative analysis theories, Keven Svenson thinks the worst is over and that the bottom for the cycle has been hit at $28,800. Svenson brings up the Wyckoff Accumulation schematic and overlays it with the BTC price chart. He believes that we could have already hit the “Spring” part of the accumulation pattern, and BTC might be ready to head toward the bullish “Phase D” in the coming weeks.
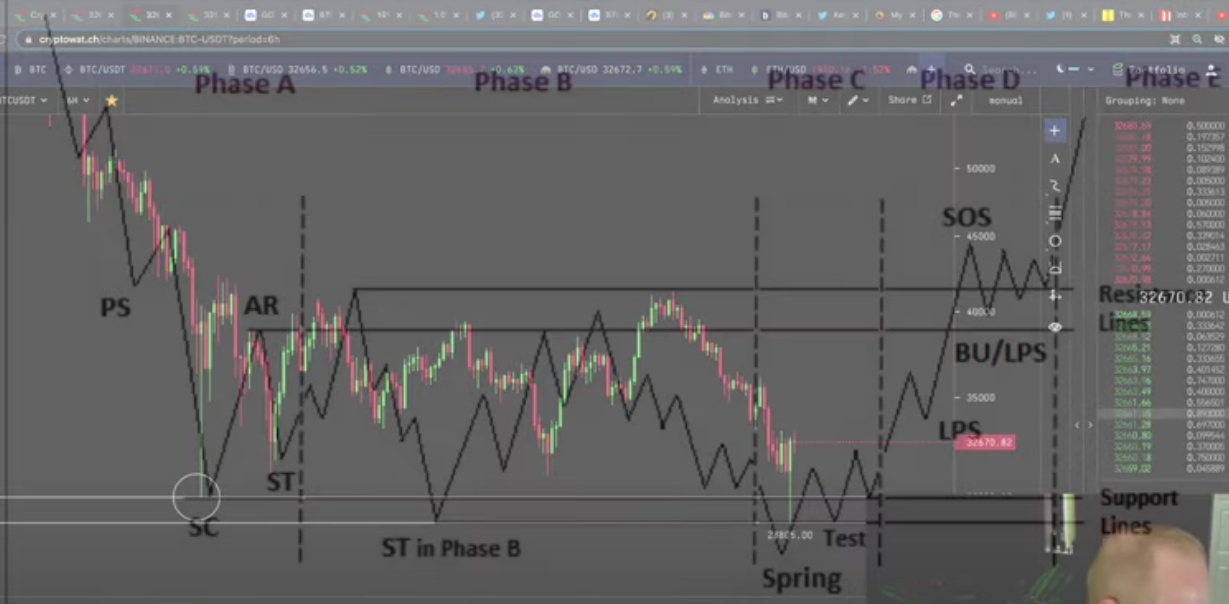
To understand his analysis a little better, take a look at his video here.
On the opposite side of the alternative analysis, both Forflies and Tone Vays have a more bearish sentiment. In a recent joint Livestream, both analysts predict that BTC will still be dropping beneath $28K into the $20-$24K range before the next bull run begins. Regardless of that, Tone Vays still thinks that BTC will hit $100K by the end of the year - which would mean that PlanB’s Stock-to-Flow model would not be invalidated. Check out their Livestream here.
The recent price hike has allowed the market cap of BTC to surge back to $640 billion.
Let us take a quick look at the markets and see where we might be heading.
Bitcoin price analysis
Daily chart
What has been going on?
Taking a look at the daily chart, we can see that BTC printed three consecutive green candles for the first time since the mid-May market capitulation. Although this is not a strong bullish signal, it could be a sign that the worst part of the sell-off is over.
4-hour chart
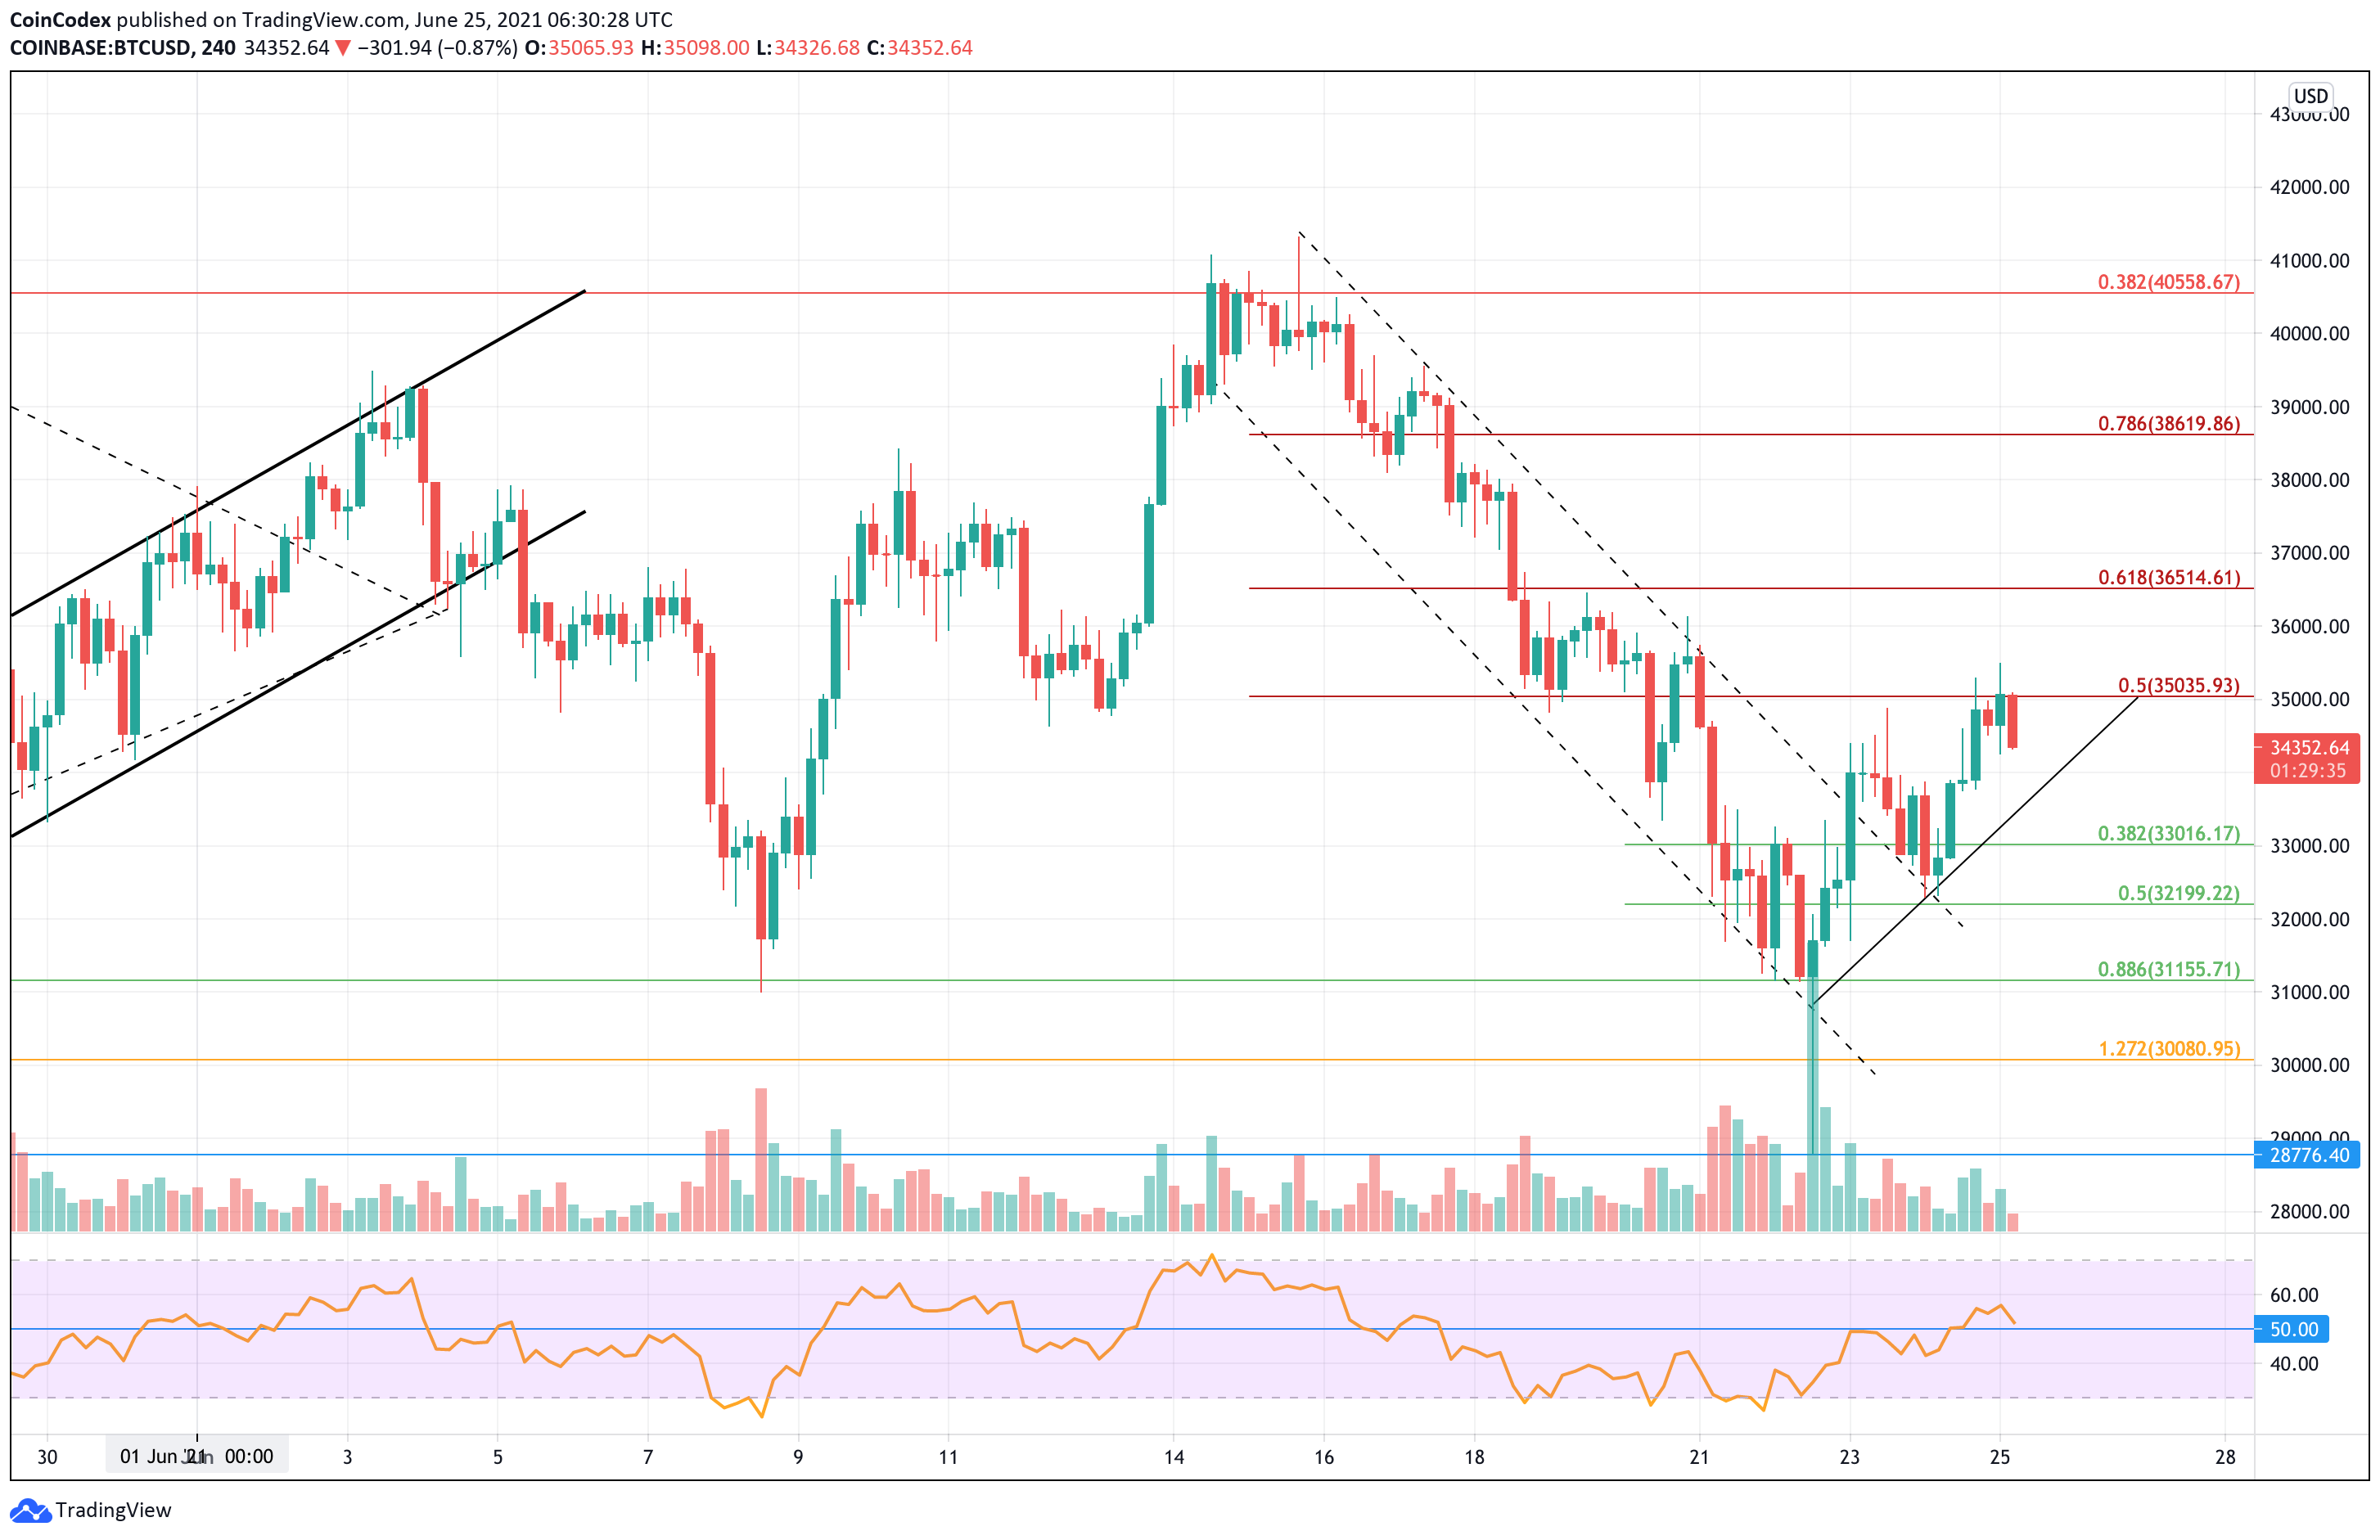
Looking at the 4HR chart, we can clearly see that BTC did not close a 4HR Candle beneath the support at $31,155, provided by a .886 Fib Retracement. It did spike as low as $28,800 but quickly rebounded to close above $31,155.
Since the sharp rebound, BTC has started somewhat of a bullish run higher. It broke above the descending price channel we have been following and eventually broke $34,000 today. After breaking $34,000, BTC continued higher until reaching resistance at $35,000 (bearish .5 Fib Retracement).
Bitcoin price short-term prediction: Neutral
Bitcoin still remains neutral in the short-term and would have to break above resistance at $42,000 to start to turn bullish again. On the other side, a closing daily candle beneath $30,000 would be required to turn the market bearish.
If the sellers do push lower, the first support lies at $34,000 (rising trend line). Beneath this, support lies at $33,000 (short term .382 Fib Retracement), $31,200 (short term .5 Fib Retracement), $32,000, and $31,155 (.886 Fib Retracement).
Added support is found at $30,000 and $28,000.
Where is the resistance toward the upside?
On the other side, the first resistance lies at $35,000 (short term bearish .5 Fib Retracement). This is followed by resistance at $36,000, $36,515 (bearish .618 Fib Retracemetn), $37,000, $38,000, and $38,620 (bearish .786 Fib Retracement).
Above this, added resistance is found at $40,000, $40,558 (long term bearish .382 Fib Retracement), and $42,000.
Keep up-to-date with the latest Bitcoin Price Predictions here.
Previous BTC analysis
At CoinCodex, we regularly publish price analysis articles focused on the top cryptocurrencies. Here's 3 of our most recent articles about the price of Bitcoin:
- Bitcoin's 24-Hour Rollercoaster Might Have Shifted Sentiment Within The Market - Is There Still Hope For The Bull Run? (Neutral)
- BTC Heads Beneath $33,000 As Death Cross Narrative Spooks Market - Will $30,000 Support Hold? (Neutral)
- BTC Breaks Back Beneath $40,000 But Remains Inside Short-Term Rising Price Channel - Will It Hold? (Neutral)
 coincodex.com