Bitcoin Price Prediction: Why Benjamin Cowen Sees Risk Below $54,000
coinedition.com
24 m
Bitcoin price prediction for November 23 stays bearish below $60,000, the round level $BTC lost this week and must reclaim after hitting its lowest price since September 2024.
Bitcoin Price Analysis: Can $BTC Hold the Wedge Floor Near $56,000?
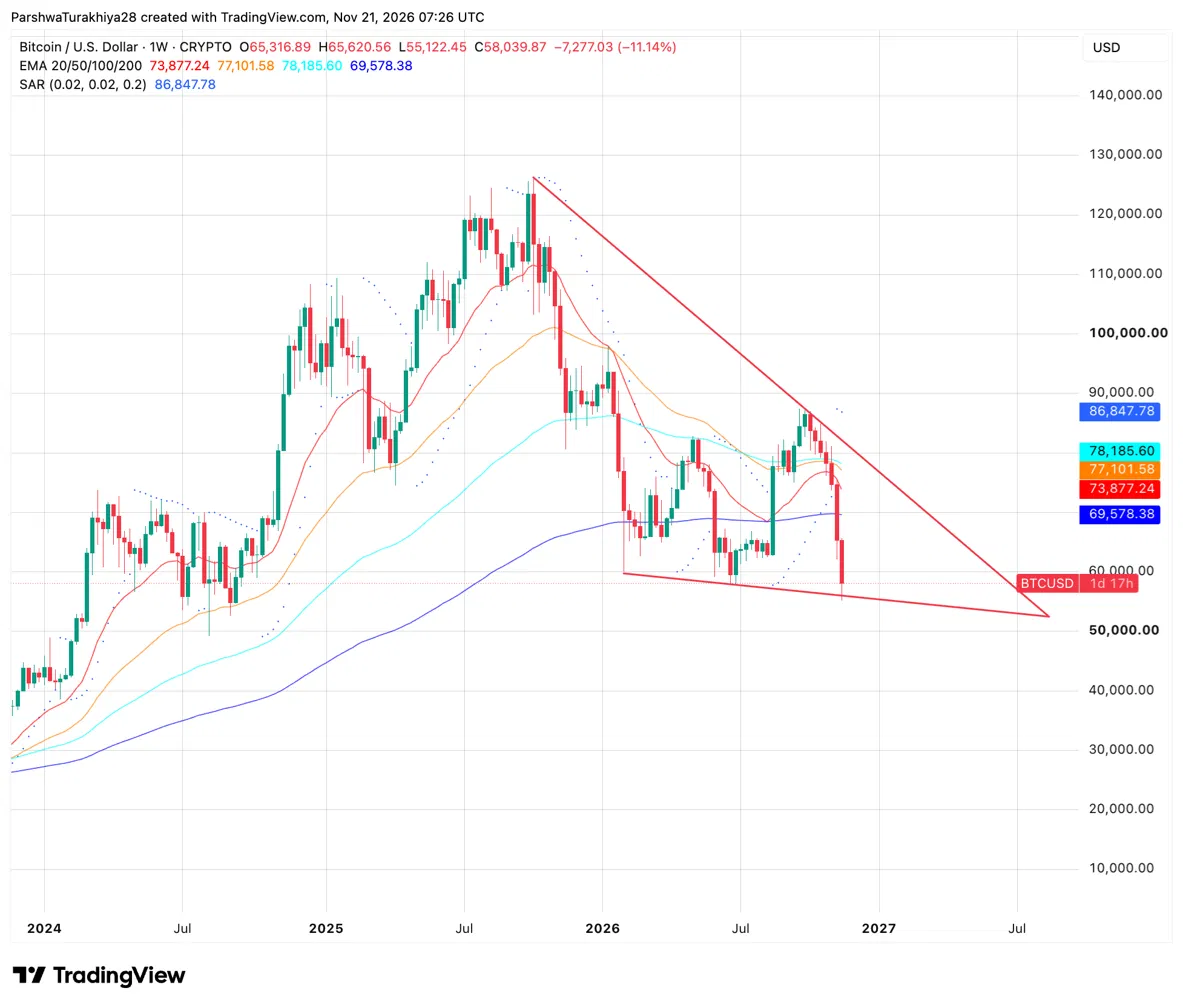
Bitcoin has bounced back above the falling wedge’s lower boundary near $56,000, but the weekly close will determine whether that support holds. $BTC trades around $58,005 after touching $55,122, leaving the weekly candle down roughly 11%.
Know when your coins move
Alerts, real-time prices, and market news — all in one app
Point your phone camera to install
4.8 based on 40K reviews in the App Store and Google Play
The wedge has narrowed since the October 2025 peak above $126,000, with its upper boundary now near $82,000. Bitcoin remains about 54% below that peak and 33% below September’s high near $87,000.
All four weekly EMAs sit above price. The nearest is the 200-week at $69,578, while the others range from $73,877 to $78,186. Parabolic SAR also remains bearish at $86,848, showing that the rebound has not changed the broader downtrend.
The weekly candle closes at midnight UTC on November 23. A finish above $56,000 would keep wedge support intact, while a close below it would weaken the pattern.
Bitcoin Daily Chart: Is RSI Oversold Enough for a Bounce?
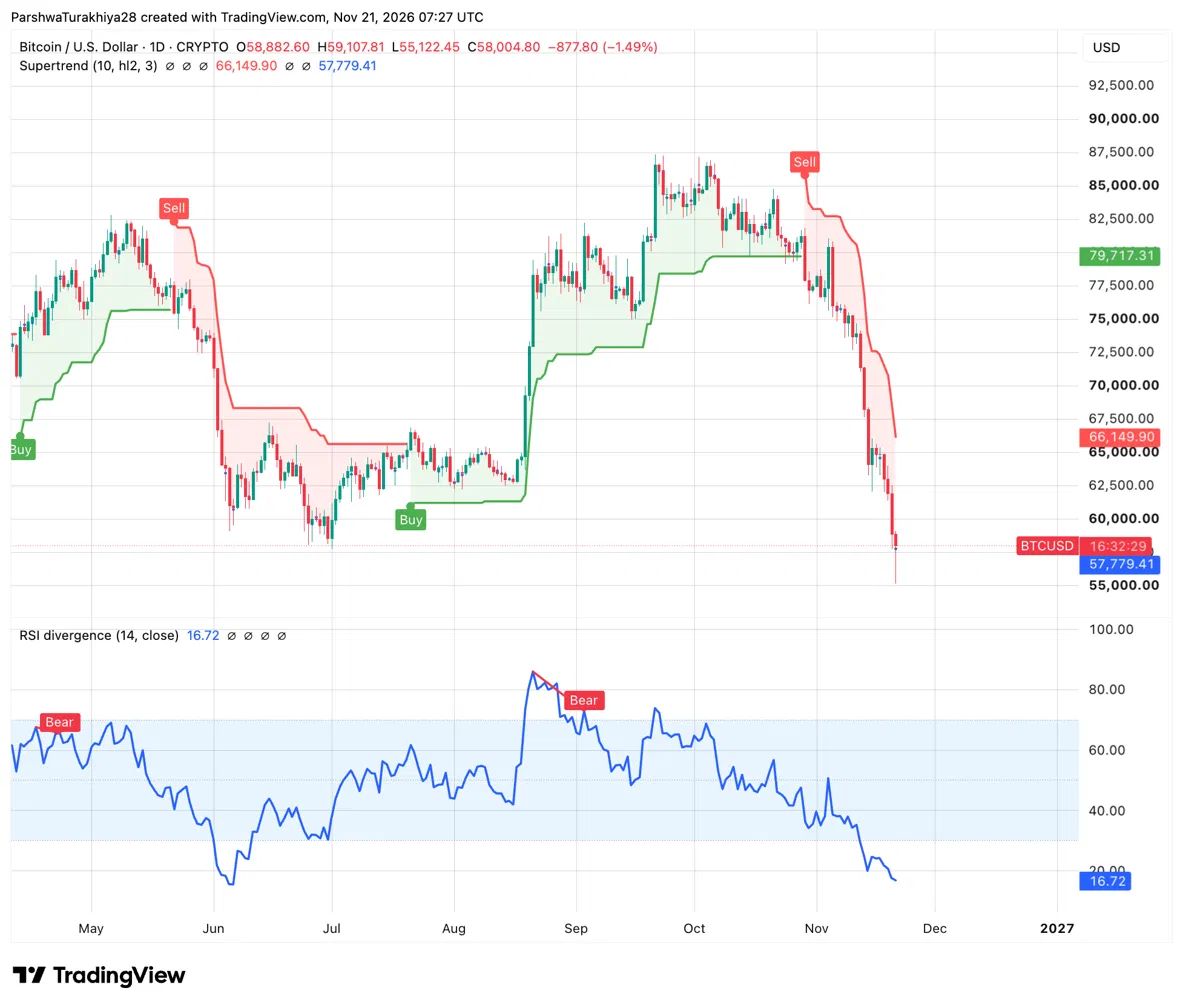
Bitcoin’s RSI has dropped to 16.72, leaving room for a relief bounce, although an oversold reading does not confirm a bottom. RSI last reached similar levels in early June, around the $57,800 low, before price recovered.
$BTC has already bounced roughly 5% from Saturday’s $55,122 low to $58,005. That puts it just above June’s $57,800 support, with $60,000 the first major recovery level.
Supertrend remains bearish at $66,150, well above price. Buyers therefore have considerable ground to recover before the daily trend improves.
For November 23, $55,122-$60,000 looks like the more likely trading range. Holding $57,800 would help buyers attempt another move toward $60,000, while a daily close below $55,122 could bring $54,000 into view.
$BTC Support and Resistance Levels, November 23, 2026
Type
Price
Why it matters
Resistance
$60,000
Round level, lost this week
Resistance
$65,317
This week’s open, beside the daily Supertrend at $66,150
Resistance
$69,578
200-week EMA
Support
$57,800
June low
Support
$55,122
This week’s low, near the wedge floor
Support
$54,000
Round level, just above Cowen’s realized price, which he puts under $54,000
Bitcoin Falls Below $57,000 as Real Yields Rise and Stocks Slide
Bitcoin fell below $57,000 late on Friday, US time, its lowest level since September 2024, CoinDesk’s analyst reported, and it is down 28% for the quarter.
The Nasdaq fell more than 4% on Friday to its lowest since April, and gold dropped to its lowest since September 2025. Analysts cited by CoinDesk point to rising real yields, meaning US Treasury yields after inflation, which make assets that pay no yield, such as Bitcoin and gold, less attractive.
The selling was also led by AI-linked stocks, with Nvidia and Micron down 14%, AMD down 13.25% and Anthropic (NASDAQ:ANT) down 8%.
Meanwhile, Citigroup warned on Friday that US rates look “unsustainably high” and expects the Federal Reserve to hike once more in December, hold in early 2027 and cut later that year.
$BTC has traded with stocks this week, so Monday’s US open is the next test for the $55,122 low.
Liquidations Reach $2.40B as Leveraged Longs Get Wiped Out
Coinglass data cited by CoinDesk show $2.40B of crypto futures liquidated in 24 hours. A liquidation is the forced closing of a leveraged position when a trader no longer has enough collateral.
Bitcoin futures accounted for more than $1B and Ether futures for $545M, and the largest single liquidation was a $51.71M long, or bullish, Bitcoin bet. CoinDesk says most traders were positioned for a bull market and did not expect $BTC to fall back below $60,000.
Forced selling at this scale tends to fade once the most stretched longs are gone, but a fall below $55,122 could start another cascade.
Benjamin Cowen Says Bear Markets Usually Break the Realized Price
While this time may feel different, in bear markets Bitcoin normally:
-Drops in Q4 of a midterm year -Drops after the 1st rate hike in a rate hiking cycle -Drops after a rate hike in Sep. of a midterm year -Drops below the realized price (currently <$54k) -Drops to the balanced…
— Benjamin Cowen (@benjamincowen) November 20, 2026
Benjamin Cowen (@benjamincowen) points to more downside for Bitcoin, based on patterns he says repeat in bear markets.
The fourth quarter of a US midterm election year is usually weak for Bitcoin.
Prices tend to fall after the first rate hike of a hiking cycle, and after a hike in September of a midterm year.
Bear markets usually push Bitcoin below its realized price, the average price at which every coin last moved, which Cowen puts under $54,000.
The next stop is typically the balanced price, another on-chain valuation level that Cowen says is much lower.
A bottom usually forms once his on-chain risk metric falls below 0.1, and it now reads 0.167.
Moreover, trader Peter Brandt (@PeterLBrandt) separately noted that every prior Bitcoin bull-market phase has ended with a correction of at least 75% from its peak.
Bitcoin Price Prediction Scenarios for November 23
Bullish Case, Target: $60,000
$BTC holds the June low near $57,800, closes above $60,000, about 3% above today’s price, and then targets the $65,317 weekly open and the Supertrend at $66,150, about 13% higher. Oversold RSI and the flush of leveraged longs would fit a bounce, and so would steadier stocks on Monday.
$BTC closes below $55,122.45, about 5% below today’s price. That would put $54,000 in play, about 7% lower, and then $50,000, about 14% lower. Another leg down in AI stocks and a further rise in real yields would fit this path.
Bitcoin Price Prediction FAQs
What is the Bitcoin price prediction for November 23?
$BTC stays bearish below $60,000 and could trade between $55,122 and that level if this week’s low holds. A daily close below $55,122 would put $54,000 in play.
Why is Bitcoin falling?
CoinDesk links the fall to rising real yields and a more hawkish Federal Reserve, with tech stocks and gold also selling off. $BTC is down 28% for the quarter and about 54% below its October 2025 peak above $126,000.
What is the key support level for Bitcoin?
$55,122, this week’s low, is the key support. The June low near $57,800 sits just under today’s price, and the realized price Cowen cites is under $54,000.
Is Bitcoin oversold?
Yes, RSI reads 16.72 on the daily chart, well below the 30 level that marks oversold. A similar reading in early June came near the $57,800 low, and $BTC recovered, though oversold readings do not guarantee a bounce.

 coinedition.com