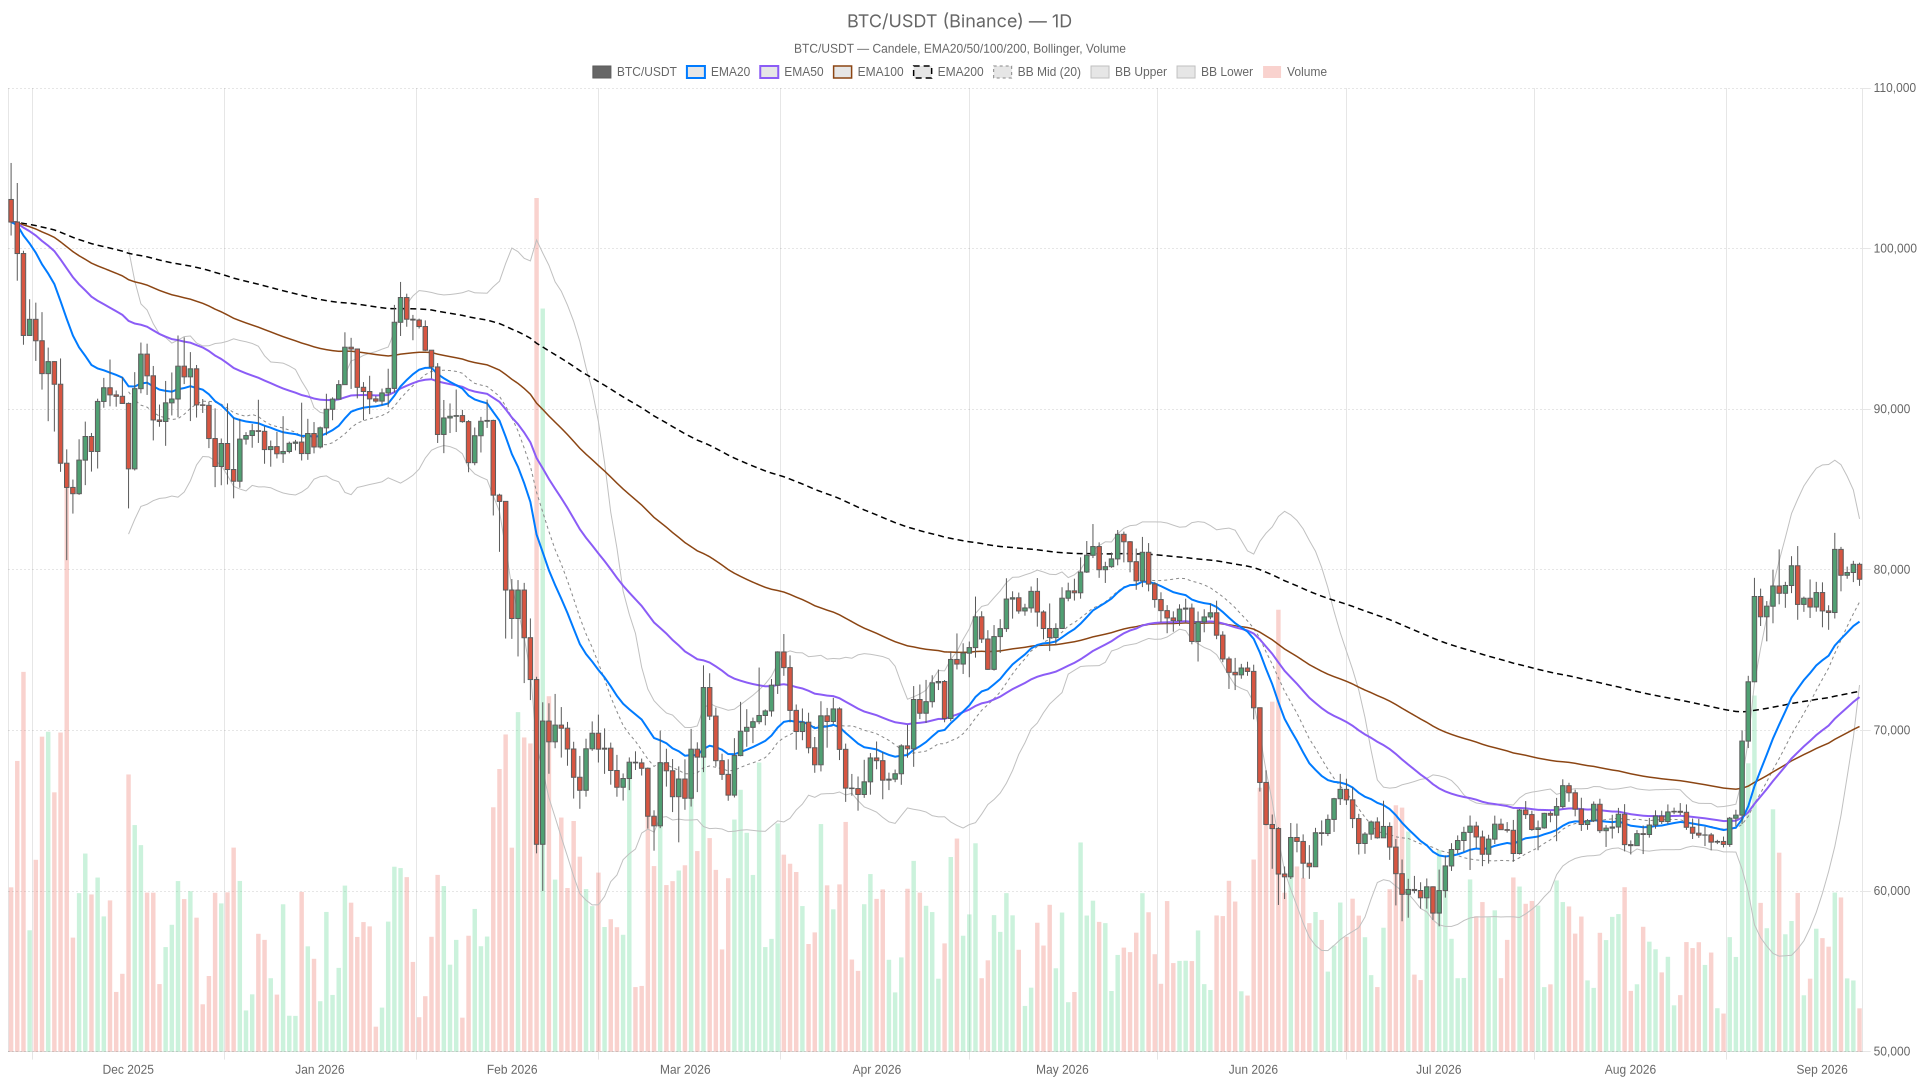
Daily Chart: $BTC Still Rides the Uptrend, But Momentum Is Fading
The daily EMA stack — price above the 20, 50, and 200 — is the clearest bullish signal on the board. It says the broader trend has not broken. RSI14 at 63.91 backs that up: firm and leaning bullish without being stretched into overbought territory. CNBC noted Bitcoin was heading for its third straight winning week even as macro pressures mount, capturing a market still bullish on the bigger picture but losing steam underneath. That leaves room for further upside if buyers step back in.
However, the MACD tells a more nuanced story. The MACD line at 3092.6 sits below its signal line at 3333.75, and the histogram is negative at -241.15. That is a classic sign of decelerating momentum — price is still elevated, but the thrust behind the move is fading, not accelerating.
The Bollinger Bands reinforce that read. Price is trading closer to the midline at $77,997.46 than to the upper band at $83,170.84. This means there is no immediate overextension to worry about, but also no explosive breakout underway. The lower band near $72,824.08 lines up almost perfectly with the EMA50/EMA200 cluster, which builds a strong technical floor if this pulls back further.
Daily ATR14 at 2,364 points to a moderate volatility regime — enough to move markets meaningfully day to day, but not the kind of expansion that signals panic. The daily pivot levels frame the immediate battle: pivot at $79,619.74, resistance at $80,238.39, and support at $78,795.50. Price is currently trading right around that pivot, which is why the next move through either level matters more than usual.
1H and 15m: Short-Term Weakness Creeping Into the Structure
On the 1H chart, price has dropped below both its EMA20 at $79,696.39 and EMA50 at $79,754.20, though it remains above the EMA200 at $79,234.36. That represents a pullback inside the trend rather than a breakdown of it, at least for now. RSI14 at 40.31 leans bearish on this timeframe, and the MACD histogram at -64.08 confirms sellers currently hold the intraday edge.
Moreover, price is hugging the lower Bollinger Band at $79,257.72, which shows real selling pressure rather than just drift. The 15-minute chart provides the bearish case its cleanest confirmation: the EMA20 at $79,504.93, EMA50 at $79,659.73, and EMA200 at $79,833.14 are stacked in a fully inverted, bearish order.
RSI14 at 42.08 and a MACD line above its signal agree with that assessment. That said, the histogram has ticked up to a marginally positive 4.57, a small hint that the selling pressure may be losing some of its own steam. The 15m pivot range is extremely tight — pivot at $79,416.67, resistance at $79,419.22, support at $79,411.59 — which simply reflects the current consolidation rather than a directional commitment.
Where This Goes From Here
The bullish scenario hinges on the daily trend absorbing this intraday weakness rather than being dragged down by it. If buyers reclaim the 1H EMA cluster around $79,696–$79,754 and push through daily resistance at $80,238.39, that would open the path toward the upper daily Bollinger Band near $83,170.84.
Renewed institutional demand — Strategy’s $370 million purchase being the most recent example — could provide exactly the kind of floor needed to support that move. This scenario gets invalidated if price cannot reclaim those short-term EMAs and the daily MACD histogram keeps deepening into negative territory instead of turning back up.
The bearish scenario plays out if daily support at $78,795.50 fails to hold. A clean break below that pivot, confirmed by the 15m and 1H charts staying in their current bearish alignment, could send price toward the lower daily Bollinger Band around $72,824.08. That level conveniently overlaps with the EMA50/EMA200 support zone.
This is also the scenario Fortune’s four-year cycle argument leans on, suggesting this rally could be running out of road. The bearish case would be invalidated by a daily close back above the EMA20 at $76,775.32 with the MACD histogram flipping positive again — signaling the broader uptrend has reasserted itself.
Reading the Room
However, sentiment is worth watching closely here: the Fear & Greed Index reads 71, firmly in “Greed” territory, even as short-term momentum indicators are cooling. That combination — high conviction on the surface, fading thrust underneath — is often how late-stage trend moves start to wobble. It is not a signal on its own, but it is a flag worth holding onto.
Elsewhere, on-chain activity has cooled sharply too. DEX fee data shows daily declines across the board, with volumes on major venues down by double digits in a single day — a move that lines up with the broader 3.12% drop in total crypto market cap. That is evidence of retreating risk appetite market-wide, not just a Bitcoin-specific move.
Volatility, measured through ATR, remains moderate rather than extreme on both the daily and hourly charts. This suggests a controlled pullback rather than a disorderly one — for now. Anyone tracking the Bitcoin price today should treat the daily structure as the primary reference point and the 1H/15m weakness as a warning to watch rather than a reason to panic.
The next few sessions, particularly how price behaves around the $78,795 and $80,238 daily pivot levels, should go a long way toward settling which of these two scenarios is actually unfolding.
FAQ
What is Bitcoin’s current price?
As of September 7, 2026, Bitcoin trades at $79,414.14, hovering near its daily pivot level of $79,619.74. The price remains above all three key daily EMAs — the EMA20 at $76,775.32, EMA50 at $72,072.26, and EMA200 at $72,431.07 — keeping the broader uptrend intact.
Is Bitcoin’s uptrend still intact?
Yes, on the daily timeframe. Price remains above the EMA20, EMA50, and EMA200, with RSI14 at 63.91 in bullish territory. However, the MACD histogram has turned negative at -241.15, suggesting momentum is decelerating even as the structural trend holds.
What are the key support and resistance levels?
The critical daily support sits at $78,795.50, with a deeper floor near $72,824.08 where the lower Bollinger Band converges with the EMA50/EMA200 cluster. On the resistance side, $80,238.39 is the immediate hurdle, followed by the upper Bollinger Band at $83,170.84.
What is driving institutional demand for Bitcoin?
Strategy, led by Michael Saylor, restarted its Bitcoin buying program with a $370 million purchase in late August 2026, as reported by Bloomberg. This signals that large-scale accumulation has not disappeared despite cooling short-term momentum.
Disclaimer: This article is for informational purposes only and does not constitute financial advice, an investment recommendation, or a solicitation to buy or sell any financial instrument or cryptocurrency. The analysis provided is not indicative of future results. Investing in crypto assets and financial markets carries a high risk of capital loss. Always do your own research (DYOR) and consult a qualified financial advisor before making any decision.
Article produced with the assistance of artificial intelligence and reviewed by the editorial team.

 en.cryptonomist.ch