
 coinedition.com

Bitcoin is approaching a decisive technical zone after retreating from last week’s three-month high of $81,455 and returning toward the $78,000 region. The pullback has placed the $80,000-$81,000 range at the center of the market.
The immediate outcome depends on several measurable forces rather than price momentum alone. Technical indicators are improving, but Binance whale inflows have climbed sharply, while U.S. economic data could influence broader risk appetite. Together, those factors explain why traders are watching targets above $100,000 and $70,000 below.
Bitcoin’s $81K Resistance Defines the Path Toward $100K or $70K
Technical analyst Ash Crypto described Bitcoin’s weekly market structure as neutral, indicating that neither buyers nor sellers currently hold clear control. However, several momentum indicators have strengthened during the latest recovery.
In particular, the MACD has turned bullish, the RSI has moved above 50, and stochastic RSI momentum has also improved. Meanwhile, buyers have continued defending the $77,000-$78,000 area after the recent pullback.
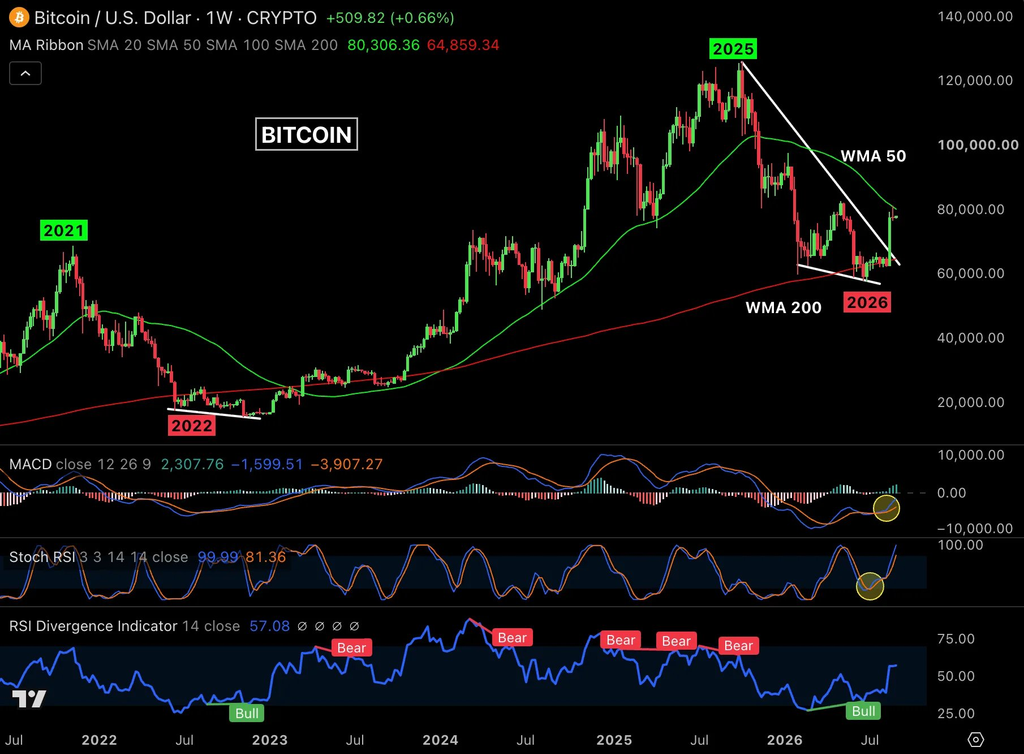
Nonetheless, the larger obstacle remains the 50-week moving average near $81,000. A sustained weekly move above that level would break an important technical barrier and place $90,000 back within the next major price zone.
From there, $100,000 would become the broader upside level identified by the current structure. However, another rejection near $81,000 would keep the market below its key moving-average resistance.
In that case, $75,000 represents the next notable support area, followed by approximately $69,000 if selling pressure extends further.
$5.5B Binance Whale Inflows and US Jobs Data Test the Breakout
On-chain flows introduce another variable. CryptoQuant analyst BorisD reported that 30-day Binance whale inflows rose from roughly $3.47 billion to $5.5 billion during Bitcoin’s rally.
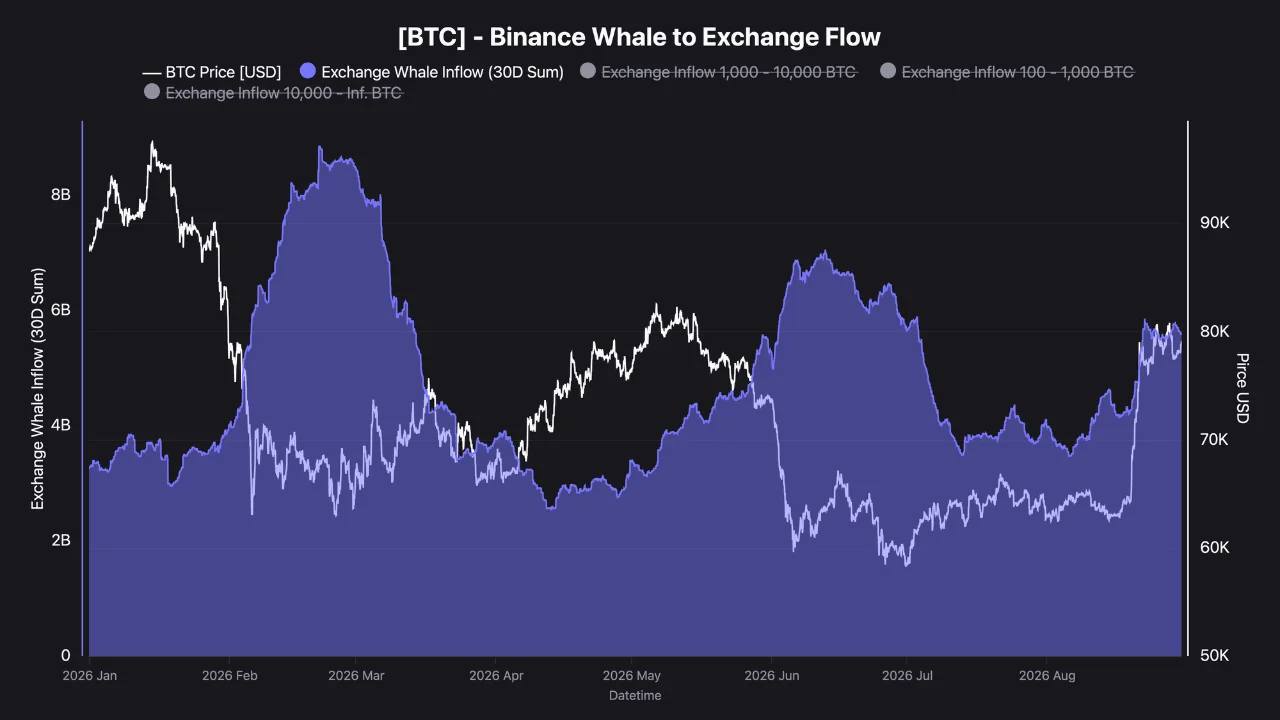
However, the analyst cautioned that exchange deposits do not automatically represent incoming selling. Large holders may instead be using Bitcoin as collateral for leveraged positions.
U.S. spot Bitcoin ETFs recorded $201.9 million in net outflows on Aug. 28, ending a nine-day inflow streak. Even so, the latest reversal remains small compared with longer-term flows. Data places cumulative ETF net inflows near $54.63 billion, meaning long-term institutional participation remains substantial despite the latest daily reversal.
Alongside shifting on-chain and ETF activity, macroeconomic data will provide another important test for the market. The ISM Manufacturing PMI is due September 1, followed by the August U.S. employment report Friday at 8:30 a.m. ET.
Economists expect payrolls to increase by about 45,000. As markets closely track economic data for Federal Reserve policy signals, the releases could influence Bitcoin’s next test of the $81,000 resistance.
Stronger-than-expected readings could reinforce expectations for tighter monetary policy, while softer data could alter those expectations. Either outcome would add another factor around Bitcoin’s $81,000 resistance and lower support levels.
Related: Bitcoin and XRP Face>