Although it decreases the amount of easily accessible liquidity that could support a sustained rally, it does not automatically push Bitcoin lower. This explains why Bitcoin and the S&P 500 appear to be diverging.
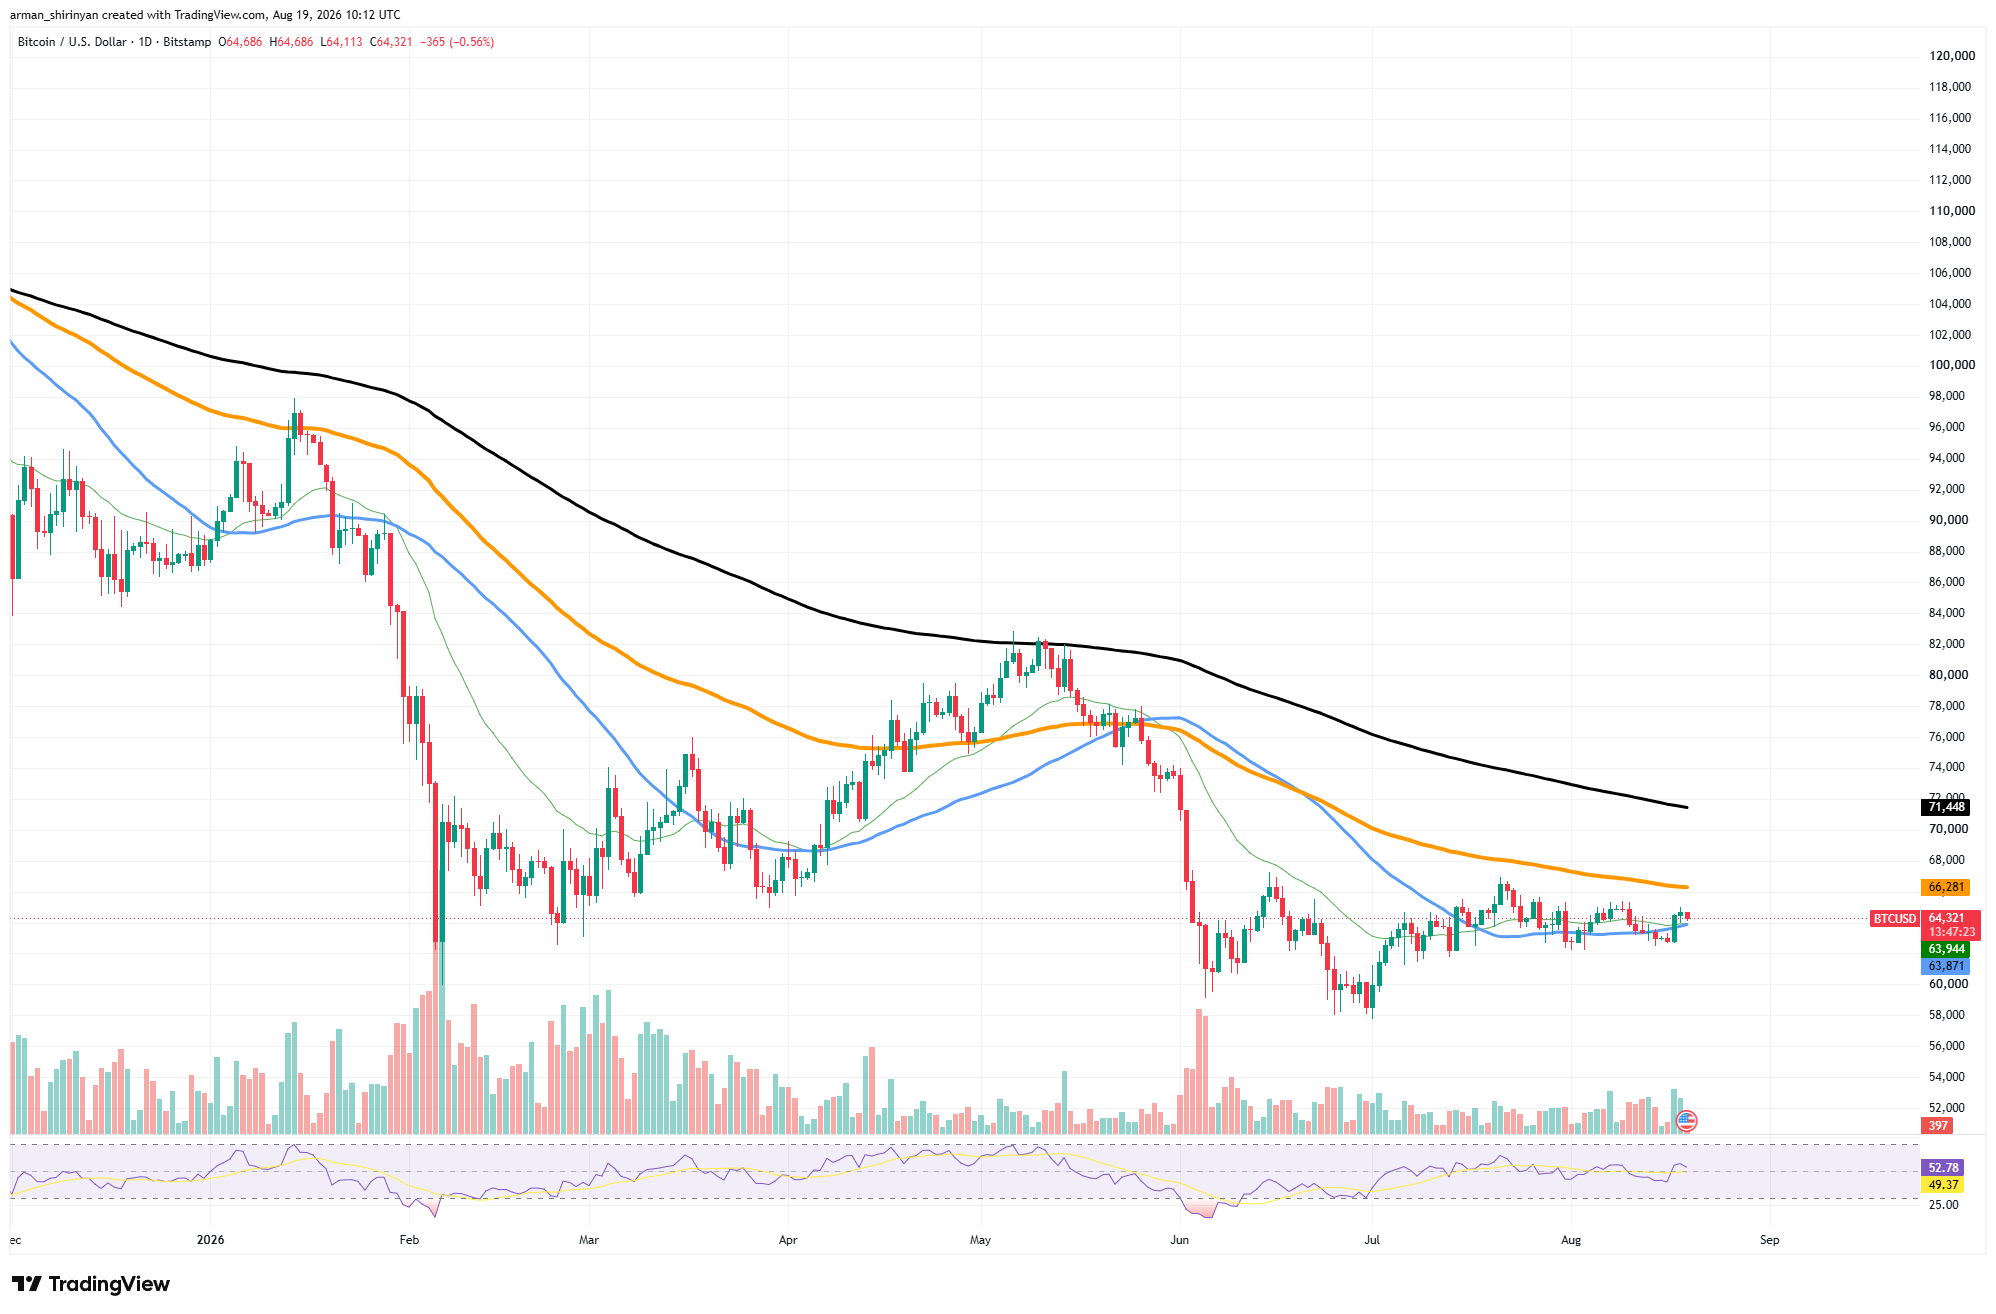
As investors anticipate future monetary easing, lower interest rates, and better financial conditions, equities may rise. Liquidity has historically had a significant impact on cryptocurrency as well, but when ecosystem capital is also declining, expectations might not be enough. That issue is reflected in the Bitcoin chart. For the majority of July and August, Bitcoin fluctuated between $62,000 and $66,000.
Some signs of improvement
It is currently trading close to $64,360. The RSI near 53 indicates a slight improvement in momentum, while the short-term moving averages around $63,900 have stabilized. However, Bitcoin is still well below long-term resistance at $71,450 and below the more significant moving average at $66,300.
Although the market has ceased to collapse, a convincing expansion phase has not yet been established. The weakness is especially noticeable when compared to stocks. The S&P 500 has been rising since June, but Bitcoin has mostly moved sideways since recovering from below $60,000. This does not imply that Bitcoin cannot break higher without an immediate stablecoin expansion.
Leverage can momentarily increase demand, existing capital can rotate, and institutional flows can increase buying pressure. However, there would be less liquidity to support such a move.
Traders should keep an eye on whether stablecoin supply starts to increase once more in conjunction with a breakout above $66,000–$67,000 if Bitcoin is to develop a more sustained rally. Until then, the price of cryptocurrencies has stabilized, but there has been little indication of the new liquidity typically linked to a sustained market advance.

 u.today