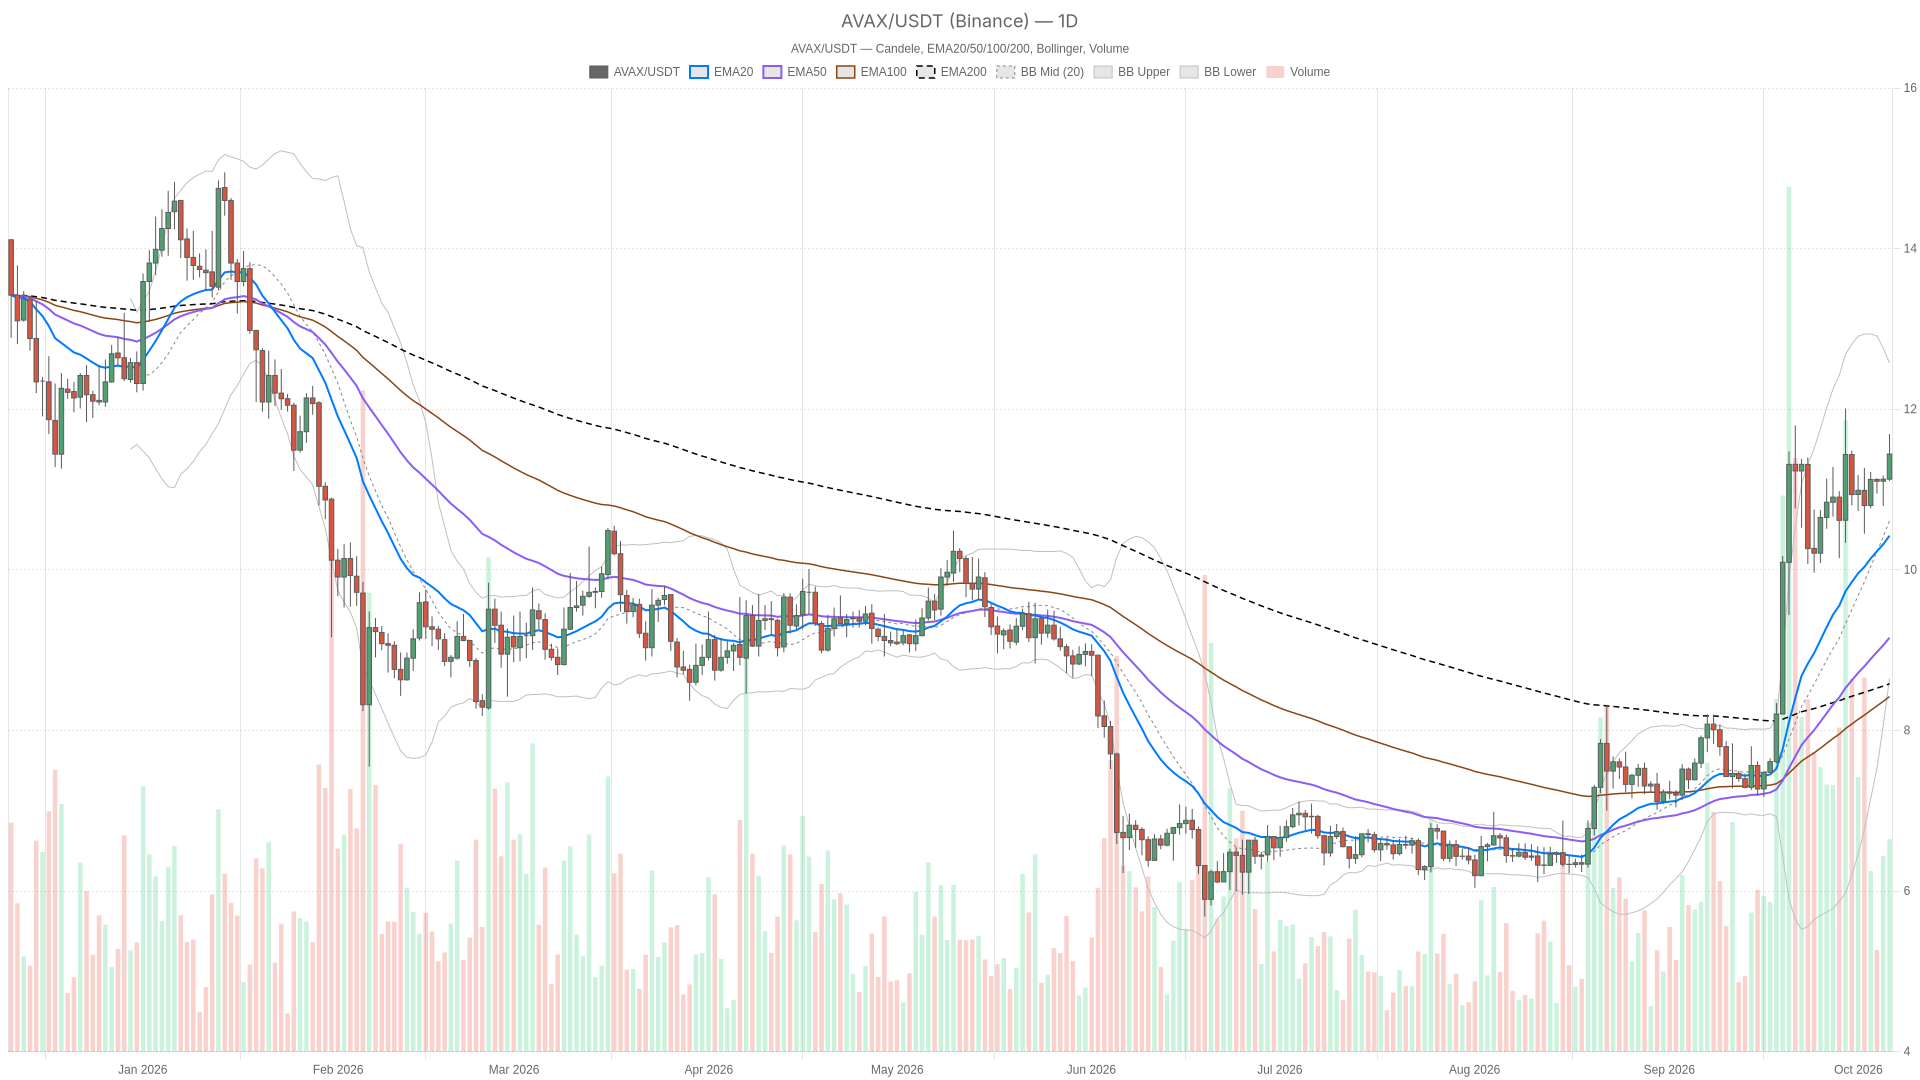
The dominant force remains a daily uptrend that is structurally intact. Price sits above the EMA20, EMA50 and EMA200, all in bullish order. However, the momentum underneath is quietly losing steam. On the hourly chart, RSI is deep in overbought territory and still climbing. This setup can power through resistance on fresh demand or snap back once short-term buyers run out of room. The tension between a strong daily trend and a stretched hourly reading is the real story here.
Broad Market Cools While Avalanche Chain Activity Jumps
The broader crypto market is cooling, with total market capitalization down 2.54% to $2.94 trillion over the past 24 hours, according to CoinGecko. Bitcoin dominance stands at 58.79%. The Fear & Greed Index reads 73 in Greed territory, sourced from Alternative.me. Risk appetite remains positive even as the broader market cap contracts — a mild inconsistency.
On the Avalanche chain, DEX trading volume across the top venues totaled about $130.25 million in the last 24 hours. This is chain-wide trading volume, not fees and not specific to $AVAX. The one-day picture looks uniformly strong. Uniswap V3 rose 163.73%, Blackhole CLMM gained 152.27%, Joe V2.2 climbed 118.06%, Pharaoh DLMM added 116.56% and Pharaoh V3 rose 97.12%. The seven-day trend, however, is mixed. Joe V2.2 is down 61.17% and Blackhole CLMM fell 41.14%, while Pharaoh DLMM is up 147.08% and Uniswap V3 rose 17.75%. One strong day does not erase a split weekly picture.
Avalanche price holds above every EMA across three timeframes
$AVAX holds above the EMA20, EMA50 and EMA200 on every major timeframe, all stacked in bullish order. On the daily chart, price at $11.44 sits above the EMA20 ($10.32), EMA50 ($9.06) and EMA200 ($8.55). The system flags the daily regime as bullish. The hourly chart confirms this: price at $11.43 is above its EMA20 ($11.23), EMA50 ($11.12) and EMA200 ($10.98). The 15-minute chart shows the same structure — price above its EMA20 ($11.41), EMA50 ($11.30) and EMA200 ($11.12), with bullish order intact.
Still, both the hourly and 15-minute live price at $11.43 sit slightly below their last completed candle’s close of $11.52. This is a short pullback within the candle, not a break in trend. The EMA alignment across all three timeframes has not changed. When three timeframes show the same bullish EMA stacking, the broader structure appears sound, even if the most recent price action has cooled.
Daily MACD Histogram Fades While Hourly RSI Nears Overbought
The daily RSI at 65.24 is strong but not accelerating, holding flat over its last three closed readings of 65.3, 65.0 and 65.2. The hourly RSI at 76.85 is a different story — it sits in overbought territory and has climbed steadily over three readings (68.0, 73.5, 76.9). This kind of move needs fresh buying to justify itself, or it tends to cool off. The 15-minute RSI at 59.24 is directionally mixed (61.6, 58.1, 59.2) and offers little directional clarity.
The MACD picture adds further tension. On the daily chart, the histogram is negative at -0.0494 and has been widening over the last three readings (-0.0159, -0.0338, -0.0494). Momentum is fading even as price trades near its highs — a gap worth watching. The hourly histogram tells the opposite story: positive at 0.0304, rising and widening (0.0222, 0.0252, 0.0304). Short-term momentum is building in the direction of the move. The 15-minute histogram is positive but small at 0.0145, falling and narrowing (0.0221, 0.0174, 0.0145), consistent with the minor pullback noted above.
Meanwhile, the daily Bollinger Bands stretch from $8.06 to $12.76 with a midline at $10.41. Price sits comfortably in the upper half with room above. The hourly bands are tighter, from $10.82 to $11.54 with a midline at $11.18. The live price at $11.43 sits close to the upper band — a stretched reading on the smaller timeframe. Daily ATR is $0.67, hourly ATR is $0.13, and 15-minute ATR is $0.088. Volatility is calmer the closer you zoom in.
Key Levels and What Would Confirm or Break the Trend
$AVAX at $11.44 is already above daily R1 at $11.27, so the next resistance is the daily Bollinger upper band at $12.76. Below, support stacks at daily R1 ($11.27), the daily pivot ($11.03), daily S1 ($10.89), the Bollinger midline ($10.41) and the daily EMA20 ($10.32).
On the hourly chart, resistance layers at the Bollinger upper band ($11.54), the hourly pivot ($11.55) and hourly R1 ($11.66). Support sits at hourly S1 ($11.41), the hourly EMA20 ($11.23), the Bollinger midline ($11.18) and the hourly EMA50 ($11.12).
A bullish scenario hinges on an hourly close above hourly R1 at $11.66. That would open room toward the daily Bollinger upper band at $12.76. This case is invalidated by a daily close back below daily R1 at $11.27.
Conversely, a bearish scenario hinges on an hourly close below hourly S1 at $11.41. That would expose the hourly EMA50 at $11.12 and bring the daily pivot at $11.03 back into play. This case is invalidated by an hourly close back above the hourly pivot at $11.55.
The overbought hourly RSI at 76.85 raises the odds of a short, sharp pullback inside an otherwise intact uptrend. The likeliest false signal would be treating a dip toward the hourly EMA20 at $11.23 as a trend reversal. On its own, that would not break the daily structure where price remains above all three EMAs. However, if such dips pair with daily closes below daily R1, the broader bullish read would need revisiting.
FAQ
What is the current $AVAX price?
As of October 6, 2026, $AVAX trades near $11.44 on Binance, with the last completed daily candle closing at $11.13.
Is Avalanche bullish or bearish on the daily chart?
The daily chart shows a bullish regime: price sits above the EMA20, EMA50 and EMA200, with the averages in bullish order, and RSI at 65.24. Still, the daily MACD histogram is negative and widening, pointing to fading momentum even as price holds near its highs.
Is $AVAX overbought right now?
The hourly RSI at 76.85 is in overbought territory and has been rising over its last three readings. The daily RSI at 65.24 and the 15-minute RSI at 59.24 are not in overbought territory.
What are the key resistance levels for Avalanche?
On the hourly chart, resistance sits at the Bollinger upper band ($11.54), the hourly pivot ($11.55) and hourly R1 ($11.66). On the daily chart, with price already above daily R1 ($11.27), the next resistance is the daily Bollinger upper band at $12.76.
Disclaimer: This article is for informational purposes only and does not constitute financial advice, an investment recommendation, or a solicitation to buy or sell any financial instrument or cryptocurrency. The analysis provided is not indicative of future results. Investing in crypto assets and financial markets carries a high risk of capital loss. Always do your own research (DYOR) and consult a qualified financial advisor before making any decision.
Article produced with the assistance of artificial intelligence and reviewed by the editorial team.

 en.cryptonomist.ch