Bitcoin Price Prediction: Bessent Says CLARITY Act At The One-Yard Line as BTC Eyes a Break Above $67,000
coinedition.com
22 July 2026 13:01, UTC
Bitcoin trades at $65,937 on July 22, pulling back after Treasury Secretary Scott Bessent called the CLARITY Act a one-yard line situation and sent $BTC above $67,000 and Coinbase up 12.6% in a single session. Six straight days of ETF inflows and a monthly chart signal that preceded the 2019 and 2022 bottoms are keeping bulls firmly in control of the narrative.
$BTC Price Today: Pressing Against Resistance That Has Capped Every Rally Since June
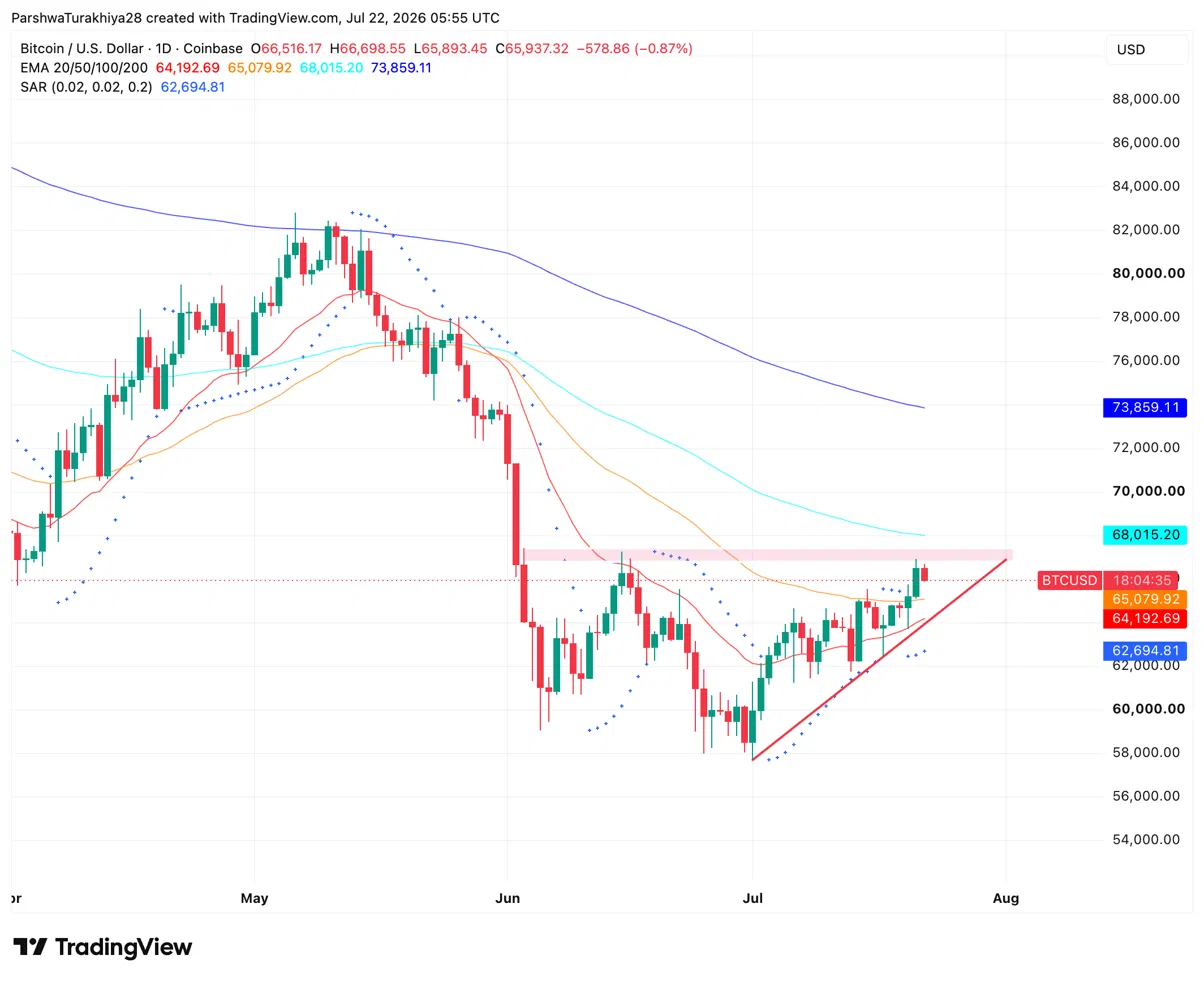
$BTC 1D Price Action (Source: TradingView)
Bitcoin at $65,937 is sitting immediately below a horizontal resistance band between $66,000 and $67,000 that has rejected every breakout attempt since the June breakdown. An ascending trendline from the late June low near $57,500 has guided the recovery, with price riding its upper boundary into this resistance zone. The Parabolic SAR at $62,694 remains bullish below price, keeping the short-term trend intact.
Know when your coins move
Alerts, real-time prices, and market news — all in one app
4.8 based on 40K reviews in the App Store and Google Play
The 20-day EMA at $64,192 and the 50-day EMA at $65,079 have both been reclaimed and now serve as the support stack below. The 100-day EMA at $68,015 is the next level above the current resistance band. The 200-day EMA at $73,859 is the longer-term target. FRNT Financial’s Stephane Ouellette described the $60,000 to $67,000 range as the trading boundary since June and argued the path of least resistance is higher as the AI trade slows and interest rate concerns ease.
What Are The Key Support And Resistance Levels For $BTC Today?
Type
Price
Level
Support
$65,079
50-Day EMA (reclaimed)
Support
$64,192
20-Day EMA (reclaimed)
Support
$62,694
Parabolic SAR (trend floor)
Resistance
$66,000 – $67,000
Horizontal band — capped every rally since June
Resistance
$68,015
100-Day EMA (next target above)
Resistance
$69,340
Short-Term Holder Realized Price — rejected every rally since November
Resistance
$73,859
200-Day EMA (longer-term target)
Bessent’s One-Yard Line Comment: Most Senior Executive Branch Endorsement Yet
Scott Bessent said lawmakers are at the one-yard line on the CLARITY Act and urged Congress to pass the bill before the August 7 recess. Bitcoin rose more than 2% toward $67,000 within hours. Coinbase shares climbed as much as 12.6% on the same session. This is the most senior executive branch endorsement the CLARITY Act has received.
The comment shifts the narrative from whether the CLARITY Act can pass to whether the Senate can close the remaining disputes before the recess clock runs out. The August 7 recess deadline is 15 working sessions away. Passage before that date would be the most significant US crypto regulatory event since the SEC dropped its lawsuit against Coinbase.
The market reaction was immediate and multi-asset: $BTC, Coinbase shares, and the broader crypto market all moved within the same session. Coinbase’s 12.6% single-session gain on a legislative comment signals how heavily the exchange’s valuation is tied to regulatory outcome — and by extension, how much institutional equity positioning is contingent on the bill’s passage.
Bitcoin ETF Inflows: $203M in One Day, $930M in Six Days
Fund
July 21 Inflow
BlackRock IBIT
$163.89M
Fidelity FBTC
$23.11M
Ark and 21Shares
$9.69M
Total (July 21)
$203.14M
Six-Day Total
$930.39M
Total Net Assets (All Funds)
$80.94B
Cumulative Net Inflows
$51.78B
July 21’s $203.14M was the strongest single session of the six-day streak and the highest daily inflow since the post-CPI surge. BlackRock’s IBIT accounted for $163.89M — 80.7% of the day’s total — a concentration that reflects the fund’s dominant position in institutional $BTC ETF allocation.
Tagus Capital noted the return of institutional interest stands in sharp contrast to the record redemptions seen earlier in the summer, marking a clear shift in institutional positioning.
The Monthly Chart Trifecta: Three Signals That Have Preceded Every Major Bitcoin Bottom
BITCOIN: MACRO BOTTOM
While on-chain metrics like MVRV and CVDD (Cumulative Value-Days Destroyed) suggest a potential cycle bottom between $40,000 and $50,000, Bitcoin’s technical chart paints a different picture.
Historically, major cycle bottoms have been marked by a precise… https://t.co/SxJ0w635qE pic.twitter.com/pTD9Jsspvk
— Ali Charts (@alicharts) July 21, 2026
Analyst Ali Charts identified three conditions that have appeared at the start of every major $BTC cycle recovery since 2015: monthly RSI at approximately 43.65, the Chande Momentum Oscillator at roughly -71, and price testing the 50-month moving average. Last month’s correction to $58,000 triggered all three simultaneously.
Historical Instances of the Trifecta
Period
$BTC Price at Signal
Move That Followed
March 2015
~$235
+8,300% expansion
January 2019
~$3,333
+1,911% rally
December 2022
~$16,270
+675% move
Ali Charts noted that on-chain metrics including MVRV and CVDD could still pull price back into the $40,000 to $50,000 range, but described current levels as a historically dominant accumulation zone with a favorable risk-to-reward profile for spot buyers. The trifecta is a signal of conditions, not a guarantee of outcome — all three prior instances resolved to the upside, but the timing of the initial move varied from weeks to months after the signal fired.
Bitcoin's biggest test isn't here yet.
Since November, every rebound has been rejected at the Short-Term Holder Realized Price. With $BTC back near $66,000, all eyes are now on $69,340.
If history repeats, that's where the bulls will have to prove themselves. pic.twitter.com/LGYd6rF9wS
— Ali Charts (@alicharts) July 21, 2026
The same analyst flagged $69,340 as the Short-Term Holder Realized Price — the level where every $BTC rally since November 2025 has stalled. Clearing and holding $69,340 is the specific condition needed to break the pattern of lower highs that has defined 2026.
Bitcoin Price Prediction: Upside and Downside Targets
Upside case: $BTC clears the $66,000 to $67,000 resistance band, the CLARITY Act passes before August 7, ETF inflows extend into a third consecutive positive week, and price targets the 100-day EMA at $68,015 and the Short-Term Holder Realized Price at $69,340 as the monthly trifecta signal plays out.
Downside case: The resistance band holds, $BTC slips back below the 50-day EMA at $65,079, and the rally fades toward the 20-day at $64,192 as the CLARITY Act stalls past the recess deadline and the range-bound structure reasserts itself through August.

 coinedition.com