
The cryptocurrency market is closely examining its structural footing following a sharp correction from recent all-time highs. After a powerful multi-week expansion that propelled the digital currency past key milestones, the asset encountered aggressive overhead resistance.
For market participants assessing bitcoin news today, the primary focus centers on the daily candlestick chart structure. After breaching the psychological $80,000 mark and posting local highs near $83,000, the daily Bitcoin price underwent a clear multi-day retracement. The premier digital asset is hovering at $77,371, registering a modest intraday green candle (+0.80%) as buyers attempt to stabilize the market at a historically significant technical crossroads.
Bitcoin Daily Chart Analysis: Understanding the Moving Average Breakdown
- The Price Action: $BTC/USD hit an apex near $83,000 before breaking down beneath its short-term moving average, bottoming locally at a low of $76,440.
- The Technical Catalyst: A bearish crossover of the short-term Moving Average (MA 9) below the longer-term Moving Average (MA 21), signaling a momentum shift on the daily timeframe.
- The Macro Context: Over $800 million in bullish derivatives positions were liquidated as a strengthening US Dollar Index (DXY), rising 30-year Treasury yields, and unresolved geopolitical tensions in the Middle East chilled risk appetite.
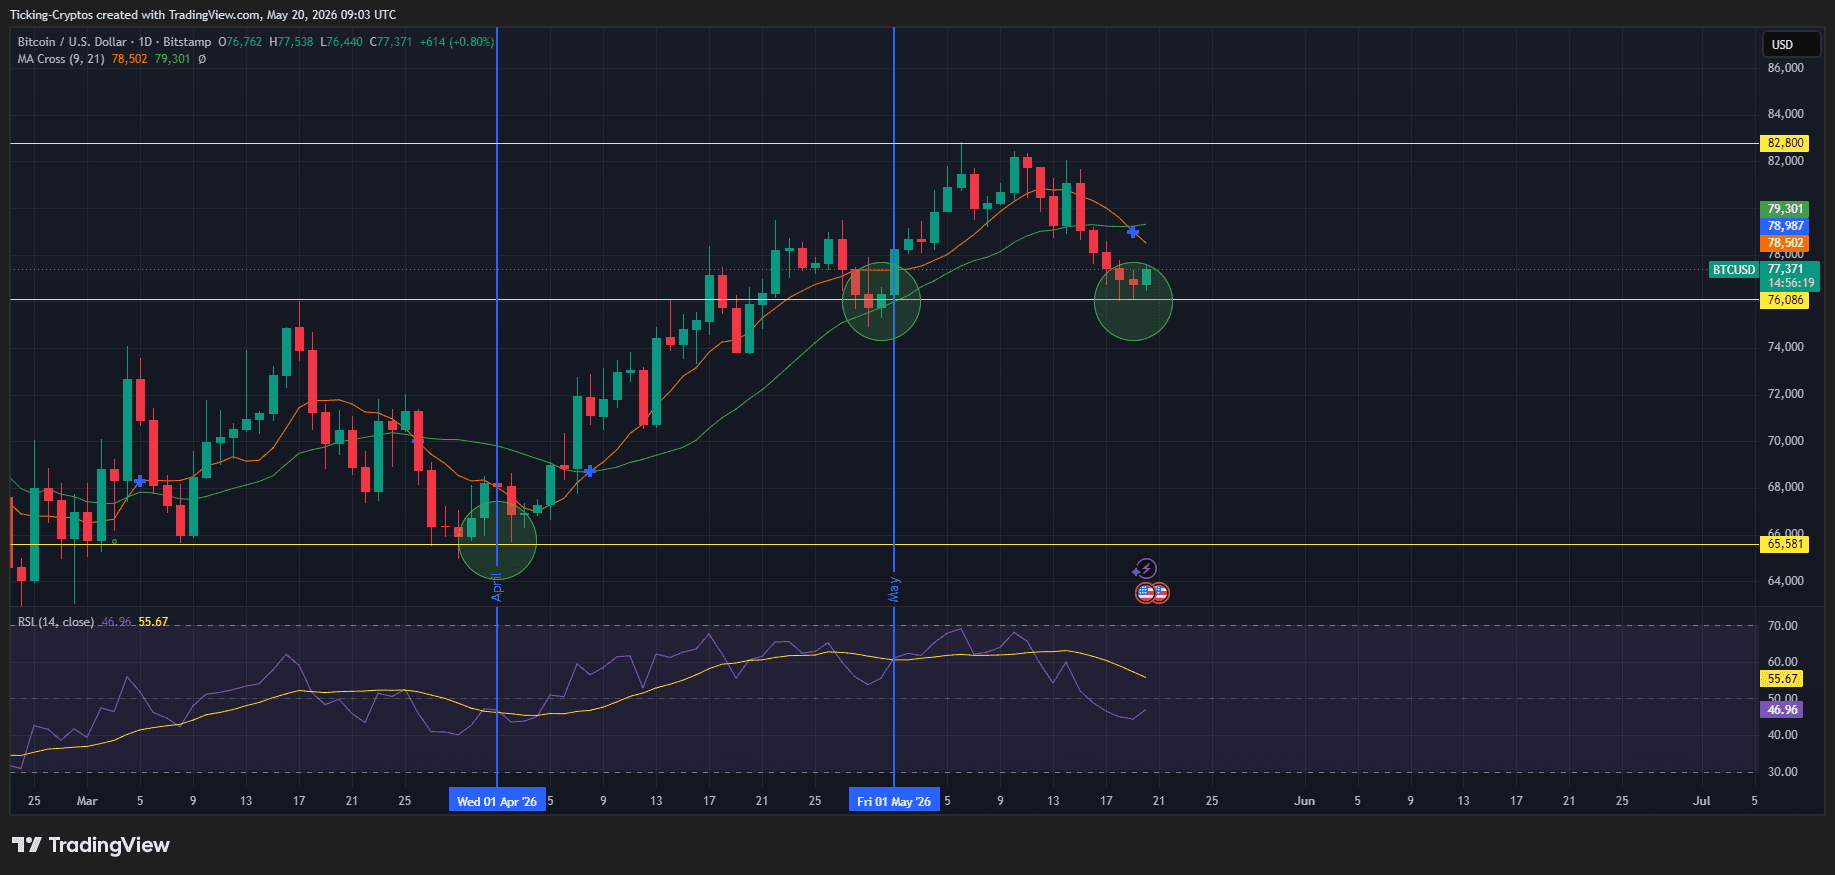
The daily chart reveals that Bitcoin has slipped beneath its 9-day Moving Average (orange line at $78,502) and its 21-day Moving Average (green line at $79,301). This layout defines the current retraction as a structural shift: the moving averages have transitioned from dynamic support levels into immediate overhead resistance hurdles.
$BTC Technical Analysis: Historical Consolidation Zones from April to May
Analyzing the asset's trajectory over the past two months showcases a clear technical rhythm marked by three critical consolidation zones highlighted by green circles on the daily chart:
1. The Early April Foundation
In early April, Bitcoin established a definitive macro floor inside the $65,581 demand zone. This area saw massive accumulation, forming a "higher low" structure that laid the groundwork for the subsequent impulse wave.
2. The Early May Launchpad
As April turned into May, Bitcoin aggressively broke upward, using the daily moving averages as a launchpad. A brief consolidation near the mid-$70,000 zone flipped prior resistance into support, sparking the parabolic run that ultimately targeted the major liquidity pocket above $80,000.
3. The Current Mid-May Rejection
After peaking at the $82,800 horizontal resistance line, buyers exhausted their momentum. The daily candles printed a series of lower highs, forcing a breakdown beneath the moving averages. The current consolidation loop near $77,371 mimics past consolidation structures, determining whether bulls can engineer another structural rebound.
Why Is Bitcoin Dropping?
Supporting this structural view is the Relative Strength Index (RSI 14), which sits at a cool 46.96. This reading confirms that the extreme overbought conditions present during the run to $83,000 have been completely erased. The indicator has dipped below the 50-median line, confirming that short-term sellers hold the operational edge, though the asset is far from technically oversold.
This technical cooldown coordinates perfectly with shifted institutional sentiment. Spot Bitcoin ETFs saw over $1 billion in net weekly outflows for the first time since January, as macro traders cut risk profiles due to soaring bond yields and shifting timelines regarding Federal Reserve interest rate paths. Simultaneously, high liquidations on derivative platforms forced over-leveraged longs to unwind, compounding the spot price decline.
Bitcoin Support Levels to Watch: Technical Targets for Bulls and Bears
As Bitcoin fights to reclaim its bullish posture, two distinct scenarios present themselves on the daily timeframe:
- The Bullish Recovery Case: To nullify the immediate bearish momentum, buyers must drive daily candle closes back above the moving average cluster between $78,500 and $79,300. Reclaiming this zone would re-energize a run toward the $82,800 ceiling.
- The Bearish Continuation Case: The absolute line in the sand for the current bullish macro structure rests at the $76,086 horizontal support. A decisive break below this level could accelerate selling pressure, opening the door for a deeper correction toward the low $70,000s.
During periods of heightened daily volatility, executing trades on liquid and fundamentally sound platforms is imperative. Traders can verify fees and pairs using our updated crypto exchange comparison. For long-term market participants looking to insulate their assets from counterparty risk during market shakeouts, utilizing premium cold storage setups remains a gold standard; discover optimal models in our hardware wallets comparison.