cryptopotato.com
Bitcoin has started showing early signs of weakness after its recent recovery rally toward the $80K resistance region. The market is now confronting a technically important supply zone where sellers have become increasingly active, raising the probability of a broader corrective phase in the short term.
Bitcoin Price Analysis: The Daily Chart
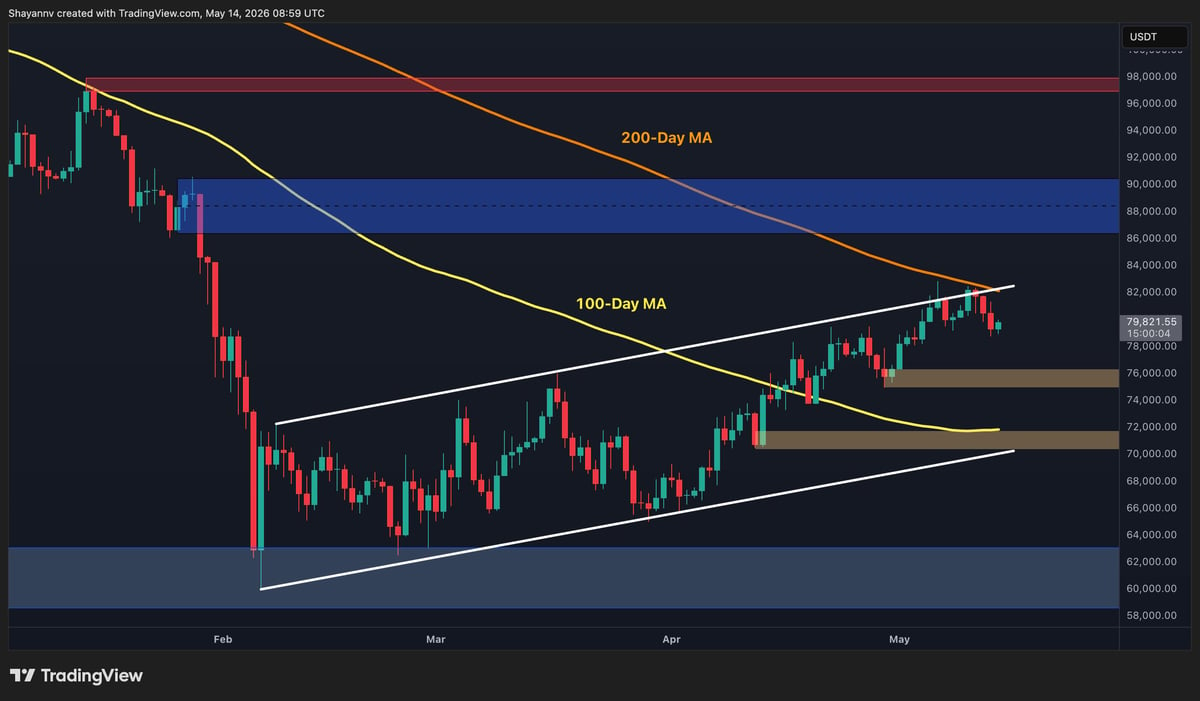
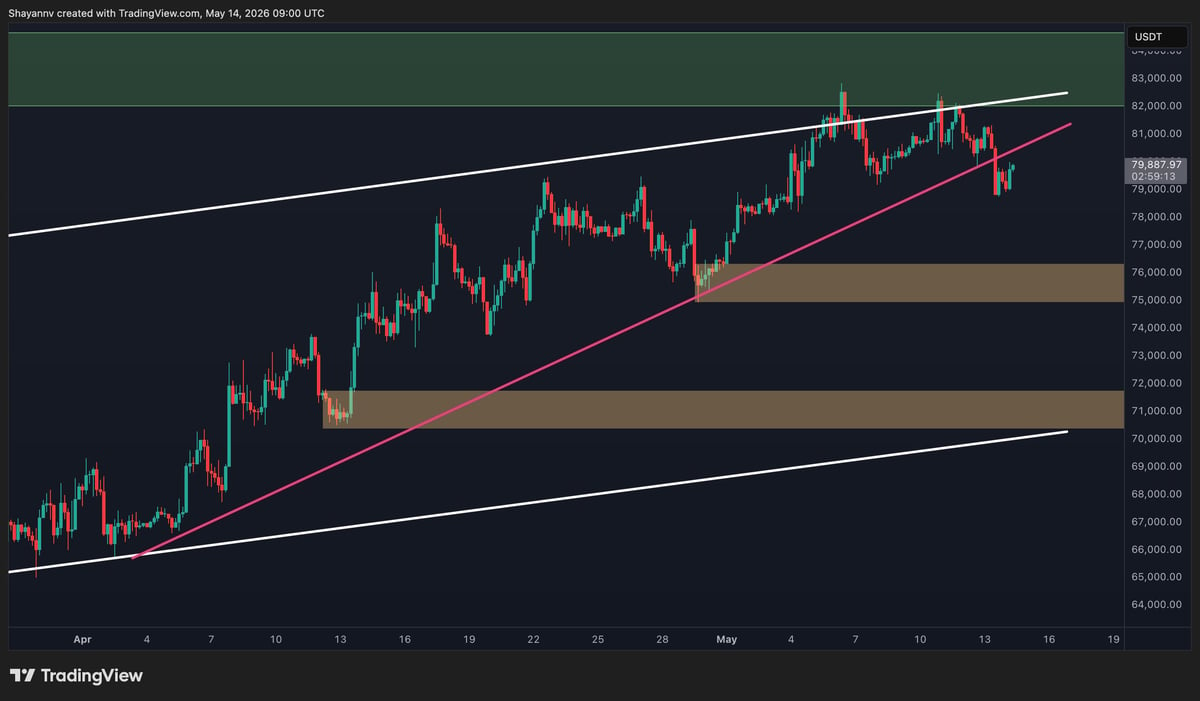
On the daily chart, $BTC has recently shown several bearish signs as the price struggles to maintain bullish momentum around the crucial $80K resistance level. This area coincides with a strong confluence of supply, including the upper boundary of the broader ascending channel and the 200-day moving average near the $82K mark. The repeated inability to reclaim this region highlights the presence of aggressive sellers and growing distribution pressure in the market.
As a result, the probability of an expanded bearish retracement has increased notably. If sellers maintain control, Bitcoin could gradually decline toward lower support zones, with the $75K region acting as the first key demand area. A deeper correction could then expose the broader support zone around $70K-$71K, which previously acted as a significant accumulation range for buyers.