XRP Price Prediction: Can XRP Reclaim $0.99 After a Channel Break?
coinedition.com
17 m
$XRP price prediction for November 23 stays bearish below $1, the round level $XRP lost this week and needs to reclaim after falling to the lower line of its weekly wedge.
$XRP Price Analysis: Can $XRP Hold the Wedge Floor?
$XRP Weekly Chart Analysis (Source: TradingView)
$XRP needs to recover $0.91 before the weekly close to avoid finishing below its falling wedge. Price trades at $0.8845, down roughly 9% this week, after an early move above $1 failed to hold.
Know when your coins move
Alerts, real-time prices, and market news — all in one app
Point your phone camera to install
4.8 based on 40K reviews in the App Store and Google Play
The decline reached $0.8596 before buyers stepped in, but the bounce has not recovered the wedge’s lower boundary. The weekly candle closes at midnight UTC on Monday, November 23, making $0.91 the immediate level to watch.
All four weekly EMAs remain well above price, starting with the 20-week at $1.2391. The others sit between $1.3650 and $1.5299, while the wedge’s upper boundary runs near $1.40. Weekly RSI at 33.32 shows weak momentum but has not yet crossed below the oversold threshold of 30.
$XRP remains roughly 76% below its July 2025 high near $3.65. For November 23, a sustained recovery above $1 looks difficult unless buyers first reclaim $0.91. A daily close below $0.86 could lead to another decline toward $0.80.
$XRP Support and Resistance Levels, November 23, 2026
Type
Price
Why it matters
Resistance
$0.97
This week’s open
Resistance
$1.00
Round level, beside the $0.99 level Ali Charts says $XRP must reclaim
Resistance
$1.24
20-week EMA
Support
$0.86
This week’s low
Support
$0.80
Next support Ali Charts is watching
Support
$0.64
Second support on Ali Charts’ list
Ali Martinez Says $XRP Broke Below the $0.99 Channel Boundary
$XRP BREAKS KEY SUPPORT LEVEL$XRP has broken below the $0.99 lower boundary of the channel, suggesting that a deeper correction may now be underway.
The next major support levels I’m watching are $0.80 and $0.64.
For the bearish outlook to weaken, $XRP would need to reclaim… https://t.co/xpgY9CnbxM pic.twitter.com/egnZsgwXiP
— Ali Charts (@alicharts) November 20, 2026
Ali Charts (@alicharts) said $XRP has broken below the $0.99 lower boundary of its channel, which suggests a deeper correction may be underway.
He is watching $0.80 and $0.64 as the next major supports. He says the bearish view would weaken only if $XRP reclaims $0.99 as support.
$0.99 is about 12% above today’s price, so $XRP would need a large rebound to cancel the bearish view, and $0.80 is the first support, about 10% lower.
Spot and Futures Both Flow Out
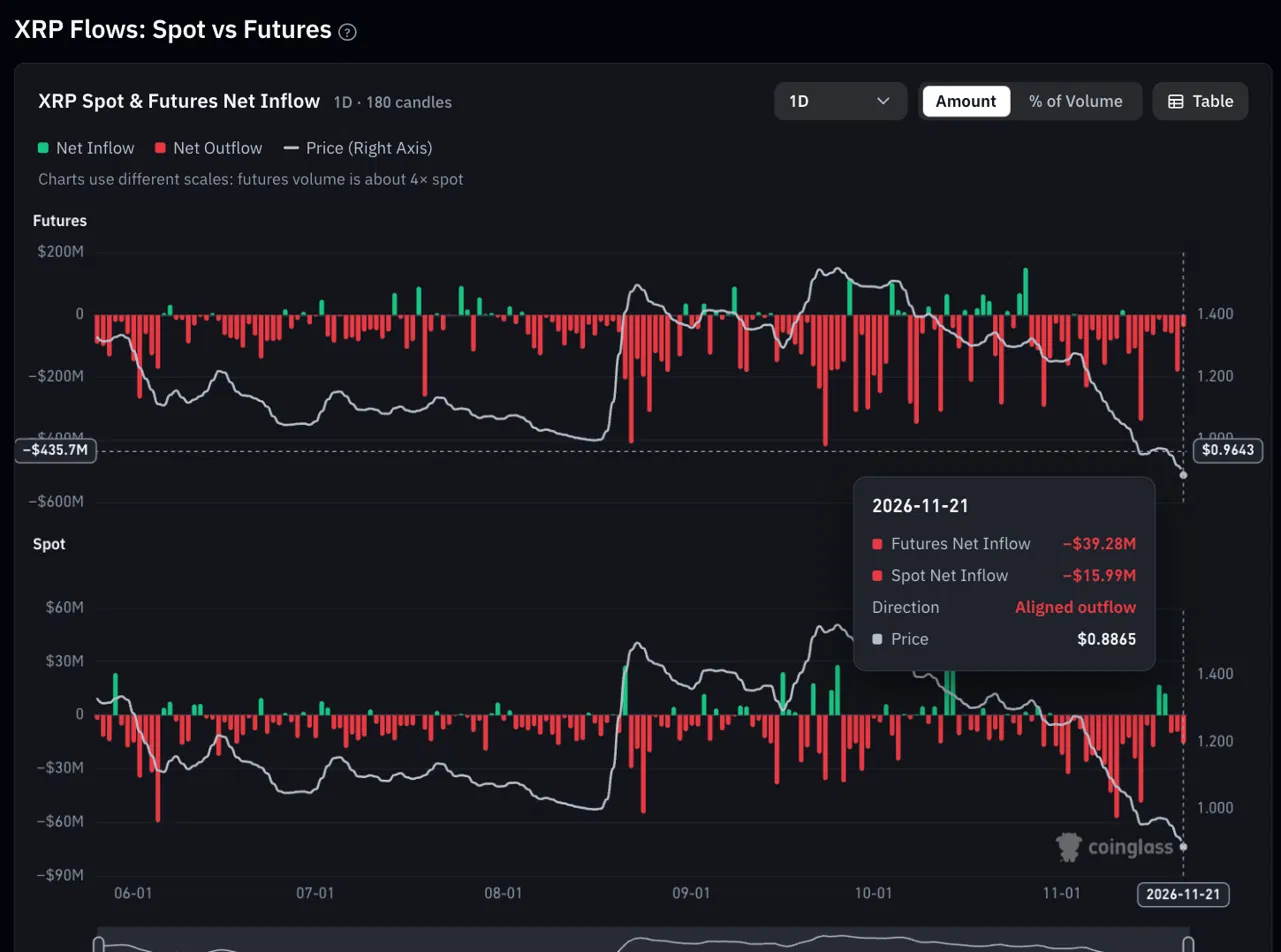
$XRP Spot and Futures Flows (Source: Coinglass)
$XRP recorded $39.28 million in net futures selling and $15.99 million in net spot selling on November 21 so far. Sellers remained more aggressive in both markets, with futures trading volume roughly four times spot volume.
These figures compare buy and sell orders executed at market prices, rather than exchange deposits or withdrawals. Both charts show net selling on most days since June, suggesting the latest pressure continues a longer pattern.
US $XRP ETFs Lose $4.97M as Net Assets Fall Below $1B
US spot $XRP ETFs had a net outflow of $4.97M on November 20, according to SoSoValue, and all of it came from Bitwise’s $XRP fund, which shed 5.58M $XRP. The funds from Franklin, Canary, 21Shares and Grayscale reported no flows.
November has brought small, scattered withdrawals. The funds had net outflows on six of 15 sessions and no inflow days, for a total of $30.77M, including $11.11M this week. Cumulative net inflow stands at $1.78B and total net assets at $989.61M.
$XRP Supply on Binance Turns From Abundant to Tight
$XRP’s available supply on Binance has tightened sharply, according to analyst Amr Taha. The Binance Supply Shortage Index reached 2.4 on November 19, exceeding its July 6 reading of 2.09. Readings above 2 signal severe supply tightness.
The index stood at -1.5 on September 27, indicating abundant supply when $XRP traded above $1.50. Its reversal suggests fewer coins are available on the exchange, although Taha said a recovery still depends on buyers returning.
That demand has yet to appear in today’s spot trading. Coinglass recorded $15.99 million in net spot selling so far, showing that tighter exchange supply alone has not stopped the selling pressure.
$XRP Price Prediction Scenarios for November 23
Bullish Case, Target: $1.00
$XRP holds this week’s low at $0.8596, closes above this week’s open at $0.9738, about 10% above today’s price, and reclaims $1.00, about 13% higher. A close above it would put the 20-week EMA at $1.23914 in play, about 40% higher. Tight Binance supply and slower ETF outflows would fit this path.
$XRP closes below $0.8596, about 3% below today’s price. That would put $0.80 in play, about 10% lower, and then $0.64, about 28% lower. Continued spot and futures outflows would fit this path.
Expert Insight
Binance supply tightened to an index reading of 2.4, above its July level, yet Coinglass shows $15.99M of net spot outflow so far today and US ETFs lost $4.97M on November 20, so tight supply has not met buyers. $XRP is about 13% under $1.00 and about 3% above $0.8596. A close above $1.00 would show demand returning to tight supply, while a close below $0.86 would put $0.80 in play.
$XRP Price Prediction FAQs
What is the $XRP price prediction for November 23?
$XRP stays bearish below $1.00 and could trade between $0.86 and that level if this week’s low holds. A daily close below $0.86 would put $0.80 in play.
Are $XRP ETFs seeing outflows?
Yes, US spot $XRP ETFs lost $4.97M on November 20 and $30.77M across November, according to SoSoValue. Cumulative net inflow is still $1.78B.
Why is the $XRP price falling?
$XRP is about 76% below its July 2025 high and trades below all four weekly EMAs, while Coinglass shows net outflows in both spot and futures. None of the data ties the fall to a single cause.
What is the key support level for $XRP?
$0.86, this week’s low, is the key support, with $0.80 and $0.64 the next levels Ali Charts is watching. A close below $0.86 would put $0.80 in play.

 coinedition.com