cryptopotato.com
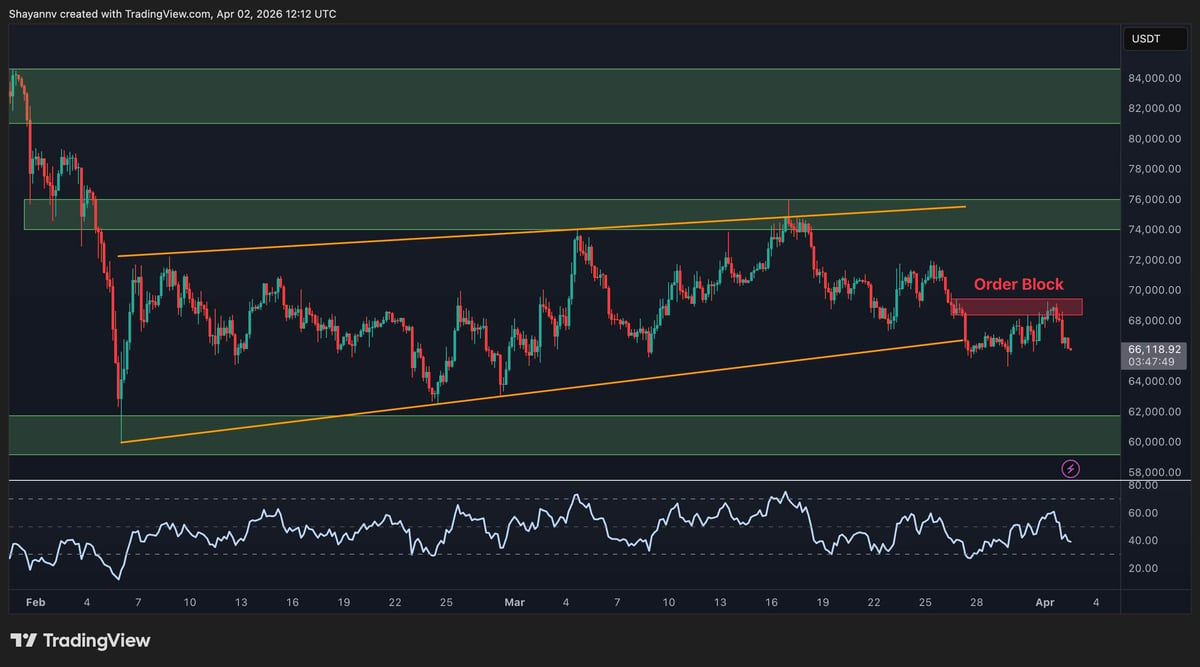
$BTC has entered a phase of consolidation after a sharp decline from January highs near $100k. The price action shows that $BTC has been respecting a broad ascending channel. The primary current support area is around $60k, and resistance is near the $75k mark. Short-term momentum is also weak, and the market appears to be digesting the previous spike, with volatility remaining elevated as traders are expecting lower levels.
Bitcoin Price Analysis: The Daily Chart
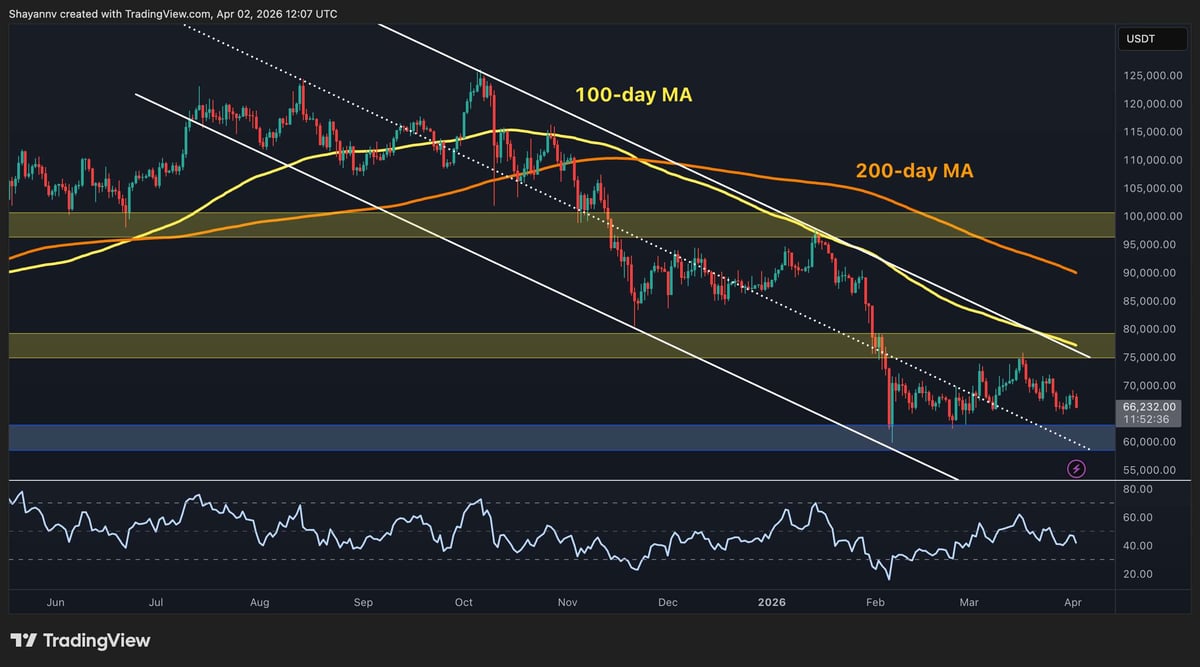
On the daily timeframe, $BTC remains below both the 100-day and 200-day moving averages, which are located around the $77k and $90k levels, respectively. This demonstrates that the overall broader trend is still bearish, especially with the large descending channel still intact.
The price attempted to push back above the $75k zone in March, but failed decisively. The subsequent lower highs and lows formed signals that sellers are still in control, and are likely to push the asset back below the midline of the channel. This makes the critical support level at $64k vulnerable in the short-term, and a break below it could reopen the downside toward the next key level near $50k.