
Bitcoin ($BTC) price has dipped below the ‘Fire Sale!’ zone on the Rainbow Chart, its first drop into this area since the FTX-induced capitulation in late 2022.
The flagship coin fell below the ‘Fire Sale!’ territory of the popular visual tool for tracking long-term price trends and sentiment by March 31, signaling it is extremely oversold. Consequently, the Bitcoin price could have already reached its 2025/2026 bear market bottom or be very close to the floor.
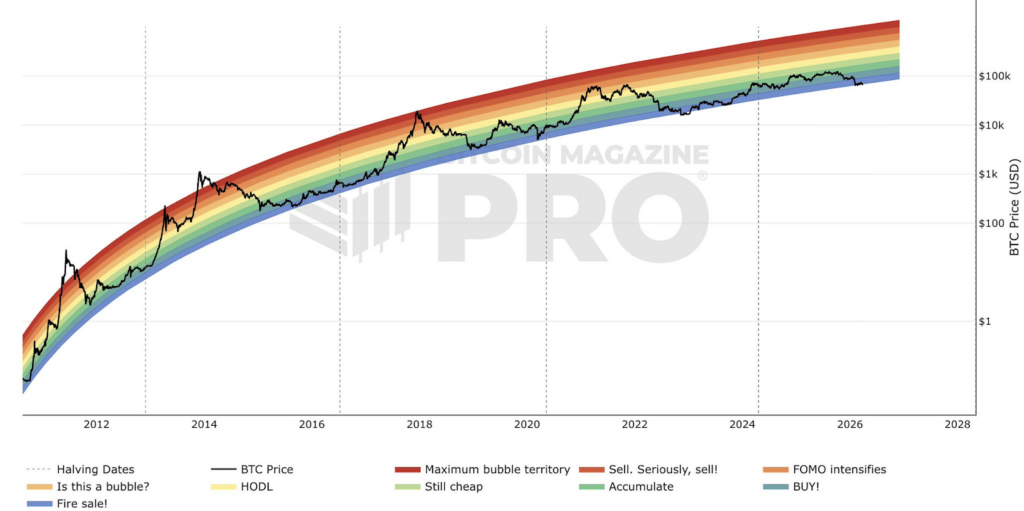
Nearly 23 months after the fourth Bitcoin halving, a return to this territory could be an opportunity to buy on a macro dip. If history repeats itself in 2026, $BTC’s price could be preparing for a fresh bull market. Moreover, Bitcoin price has remained below the ‘BUY!’ band since its capitulation below $60,000 earlier this year.
Why is Bitcoin price trading below its ‘Fire Sale!’ band?
The main reason the price of Bitcoin plunged below the ‘Fire Sale!’ zone at reporting time is rising selling pressure from institutional investors. For instance, Mara Holdings (NASDAQ: MARA) recently sold 15,133 $BTC for $1 billion, as Finbold reported.
On the demand side, Strategy Inc. (MSTR) ended its 13-week streak of Bitcoin purchases by not announcing any purchases on Monday. This signals a potential pause in one of the market’s most consistent institutional buyers. While not actively selling, it removes a persistent demand catalyst that had been supporting the price.
Broader macroeconomic uncertainty, fueled by geopolitical tensions in the Middle East, has weighed on Bitcoin in the near term, as the asset remains classified as a risk-on asset by many institutional allocators.
Is $BTC’s bear bottom in?
As Bitcoin trades within the ‘Fire Sale!’ zone at approximately $67,023 at the time of reporting, the probability of a cycle floor being established has increased meaningfully. Furthermore, financial experts are projecting a recovery in the second quarter of 2026, citing potential improvements in U.S. monetary conditions and Bitcoin’s historical tendency to recover sharply from Rainbow Chart lows.
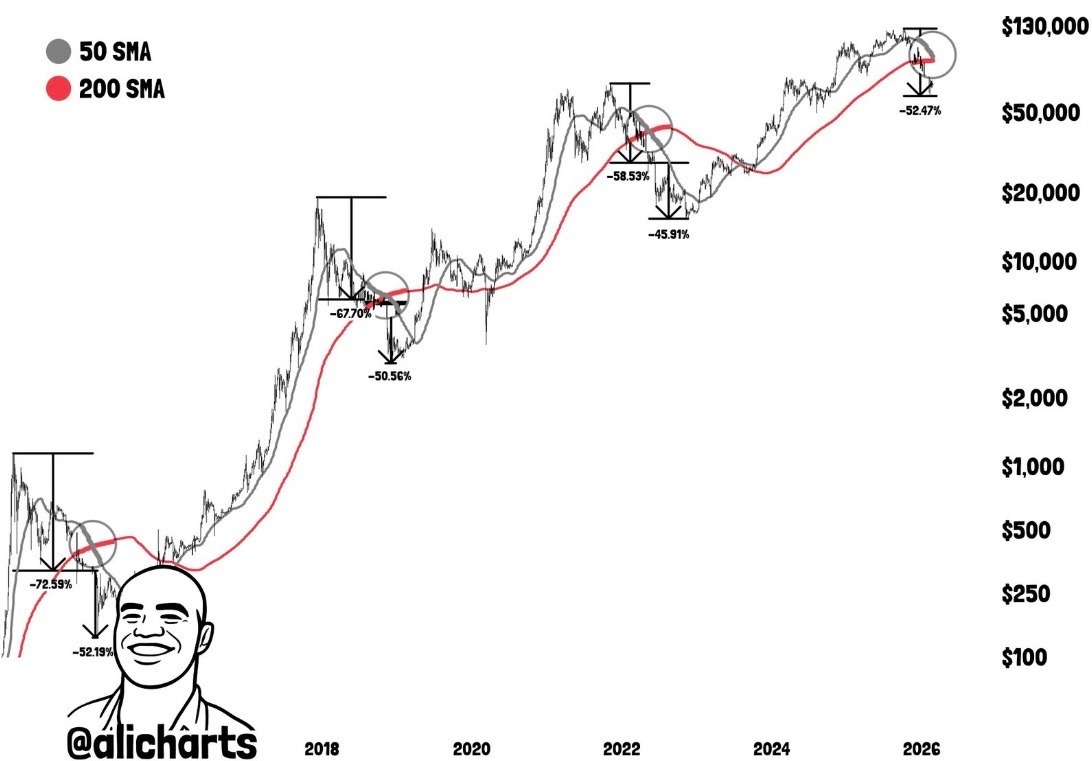
However, from a technical analysis standpoint, $BTC’s price could crash further after the 50- and 200-day Simple Moving Averages (SMAs) recorded a death cross on the 3-day chart, according to analysis shared by trading expert Ali Martinez. Essentially, this is a historically bearish signal that, in prior cycles, has preceded further drawdowns before ultimate reversals.