
Bitcoin price enters 2026 stuck in the same buyer-seller fight that kept it muted through late 2025. The price is almost flat over the past 30 days, down about 0.6%, which shows how neither side has taken control.
It is still down about 7% year on year. This balance of pressure has turned into a stalemate. However, a 1% or even a 3.5% move from here could decide the next direction if the right conditions appear.
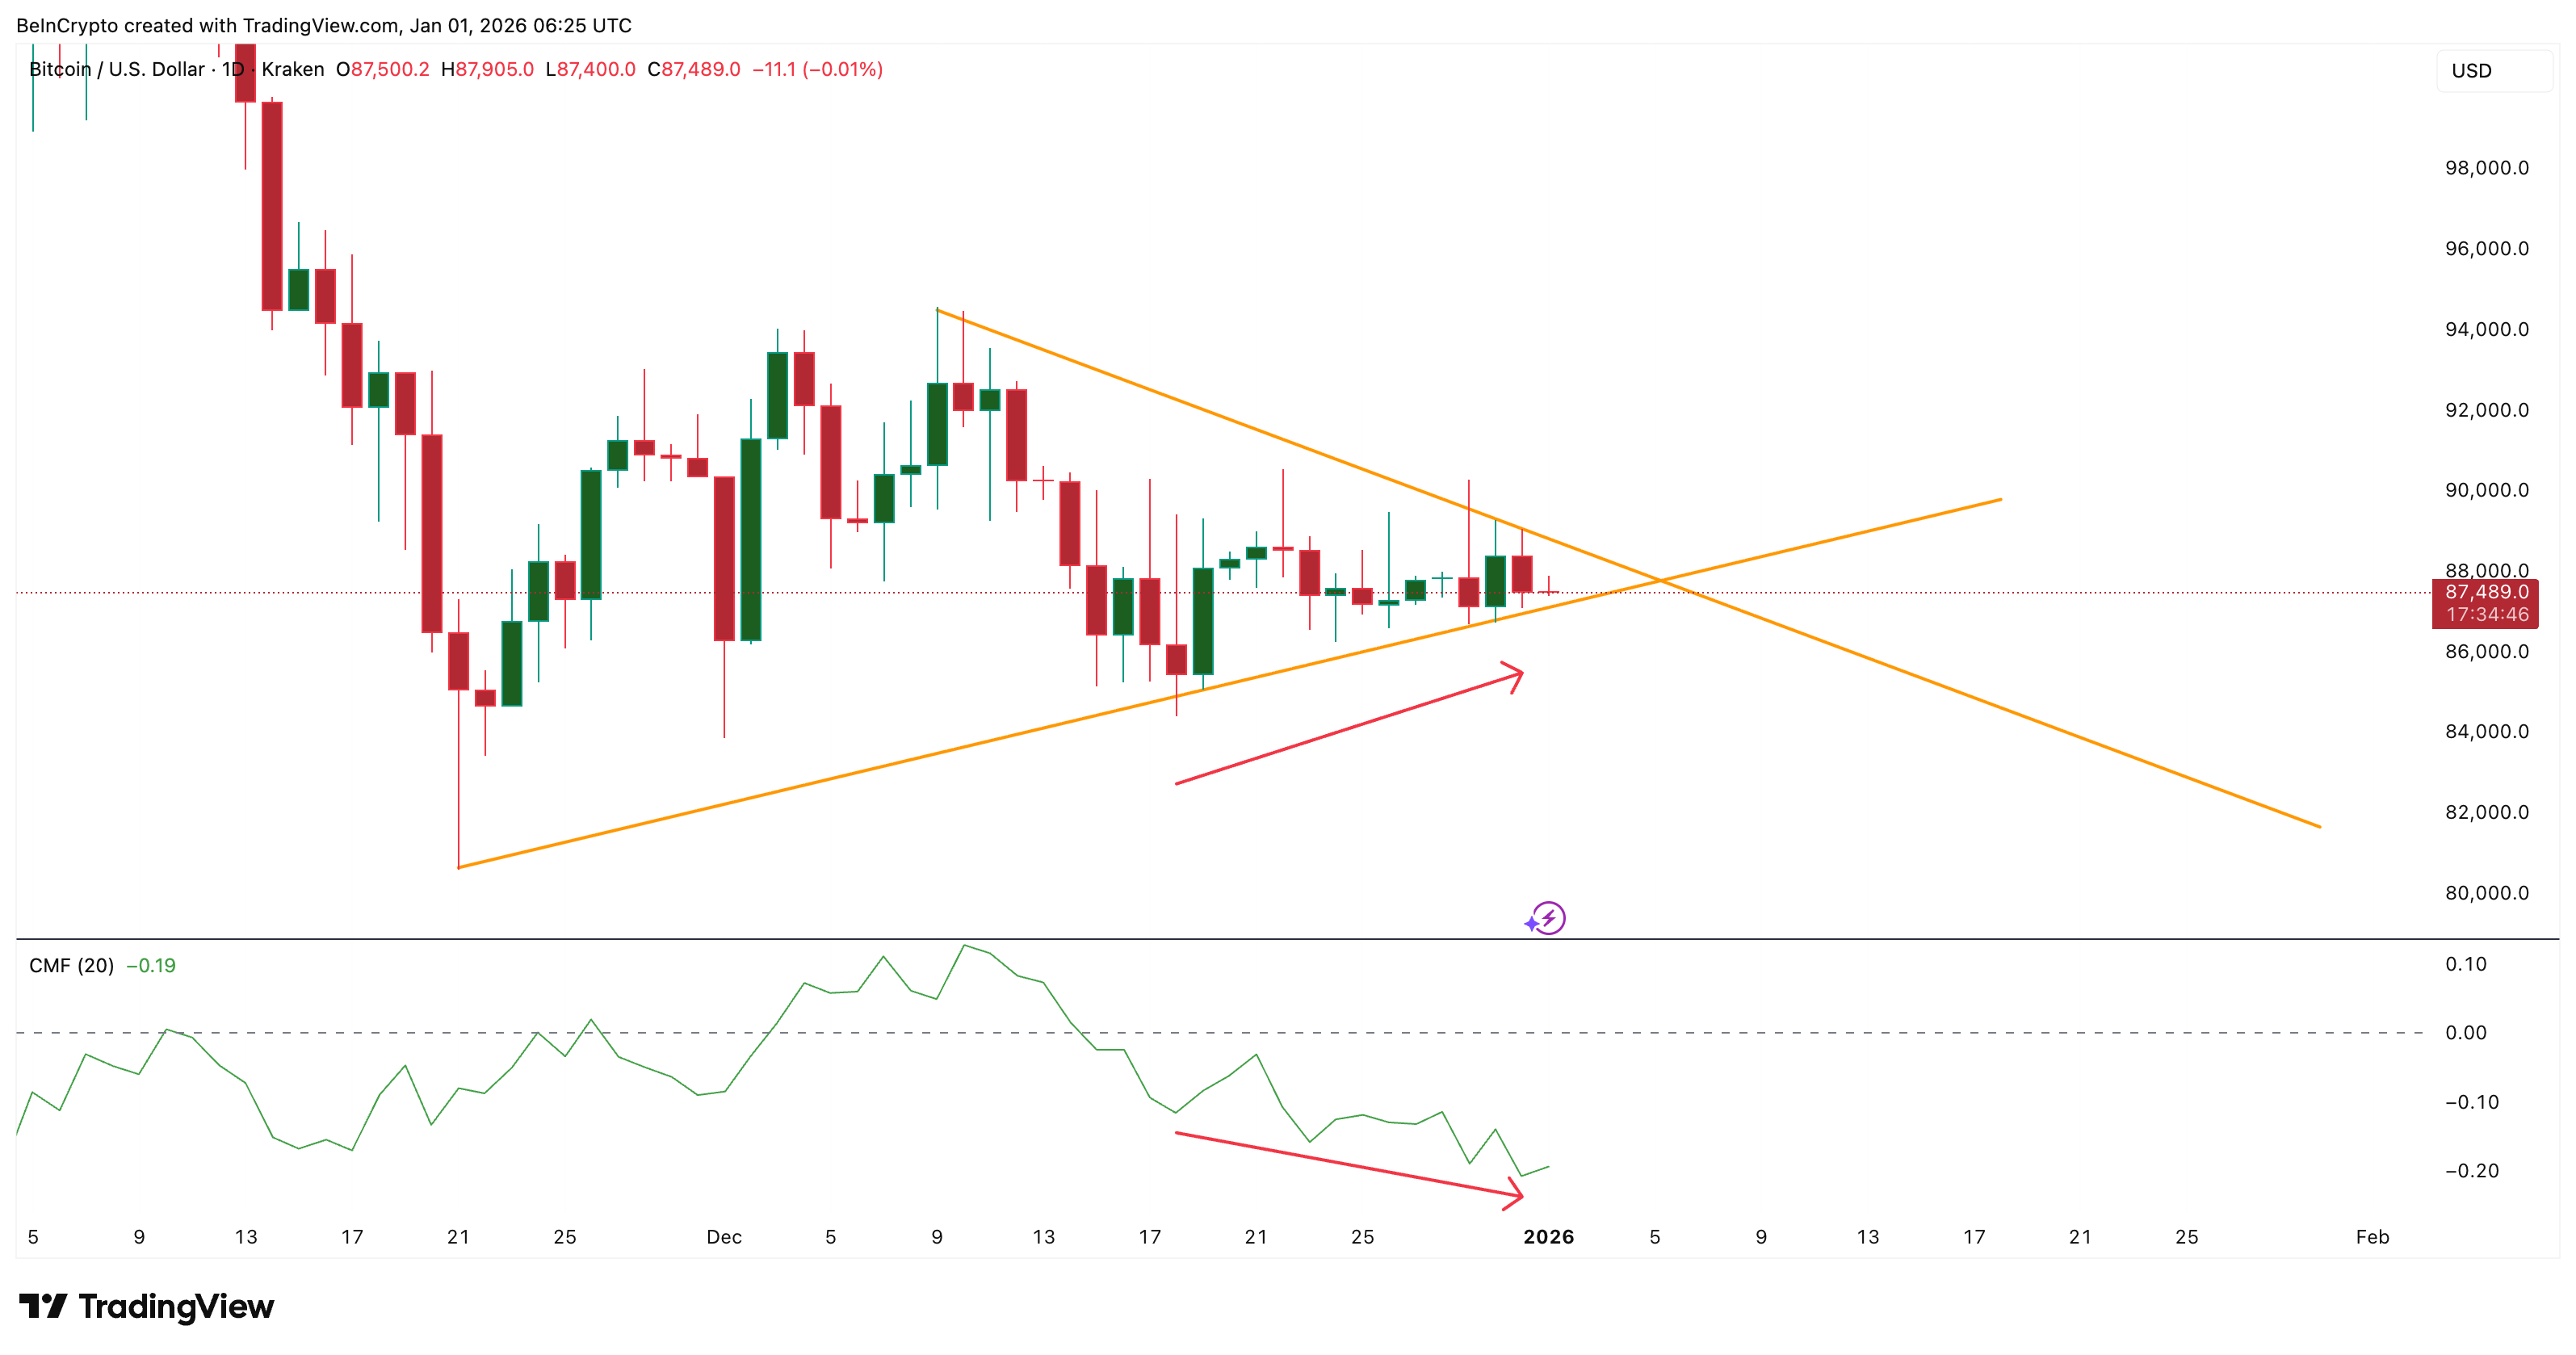
Buyer and Seller Pressure Meet Inside a Symmetrical Triangle
Bitcoin is trading inside a symmetrical triangle on the daily chart. This shape shows the market trapped between lower highs and higher lows, hinting at the buyer-seller tussle. Capital flows are not helping the upside.
The Chaikin Money Flow (CMF) has trended lower since December 10. For the unversed, the CMF measures how much money flows into or out of an asset. It shows a bearish divergence now because the $BTC price has trended higher between December 18 and December 31, while the CMF made lower lows. That signals continued outflows and selling pressure.
Want more token insights like this? Sign up for Editor Harsh Notariya’s Daily Crypto Newsletter here.
This negative capital flow is being partially offset by exchange outflows.
Exchange net position change shows coins leaving exchanges. That often hints at accumulation. On December 19, exchange outflows were about 16,563 $BTC. By January 1, they rose to 38,508 $BTC.
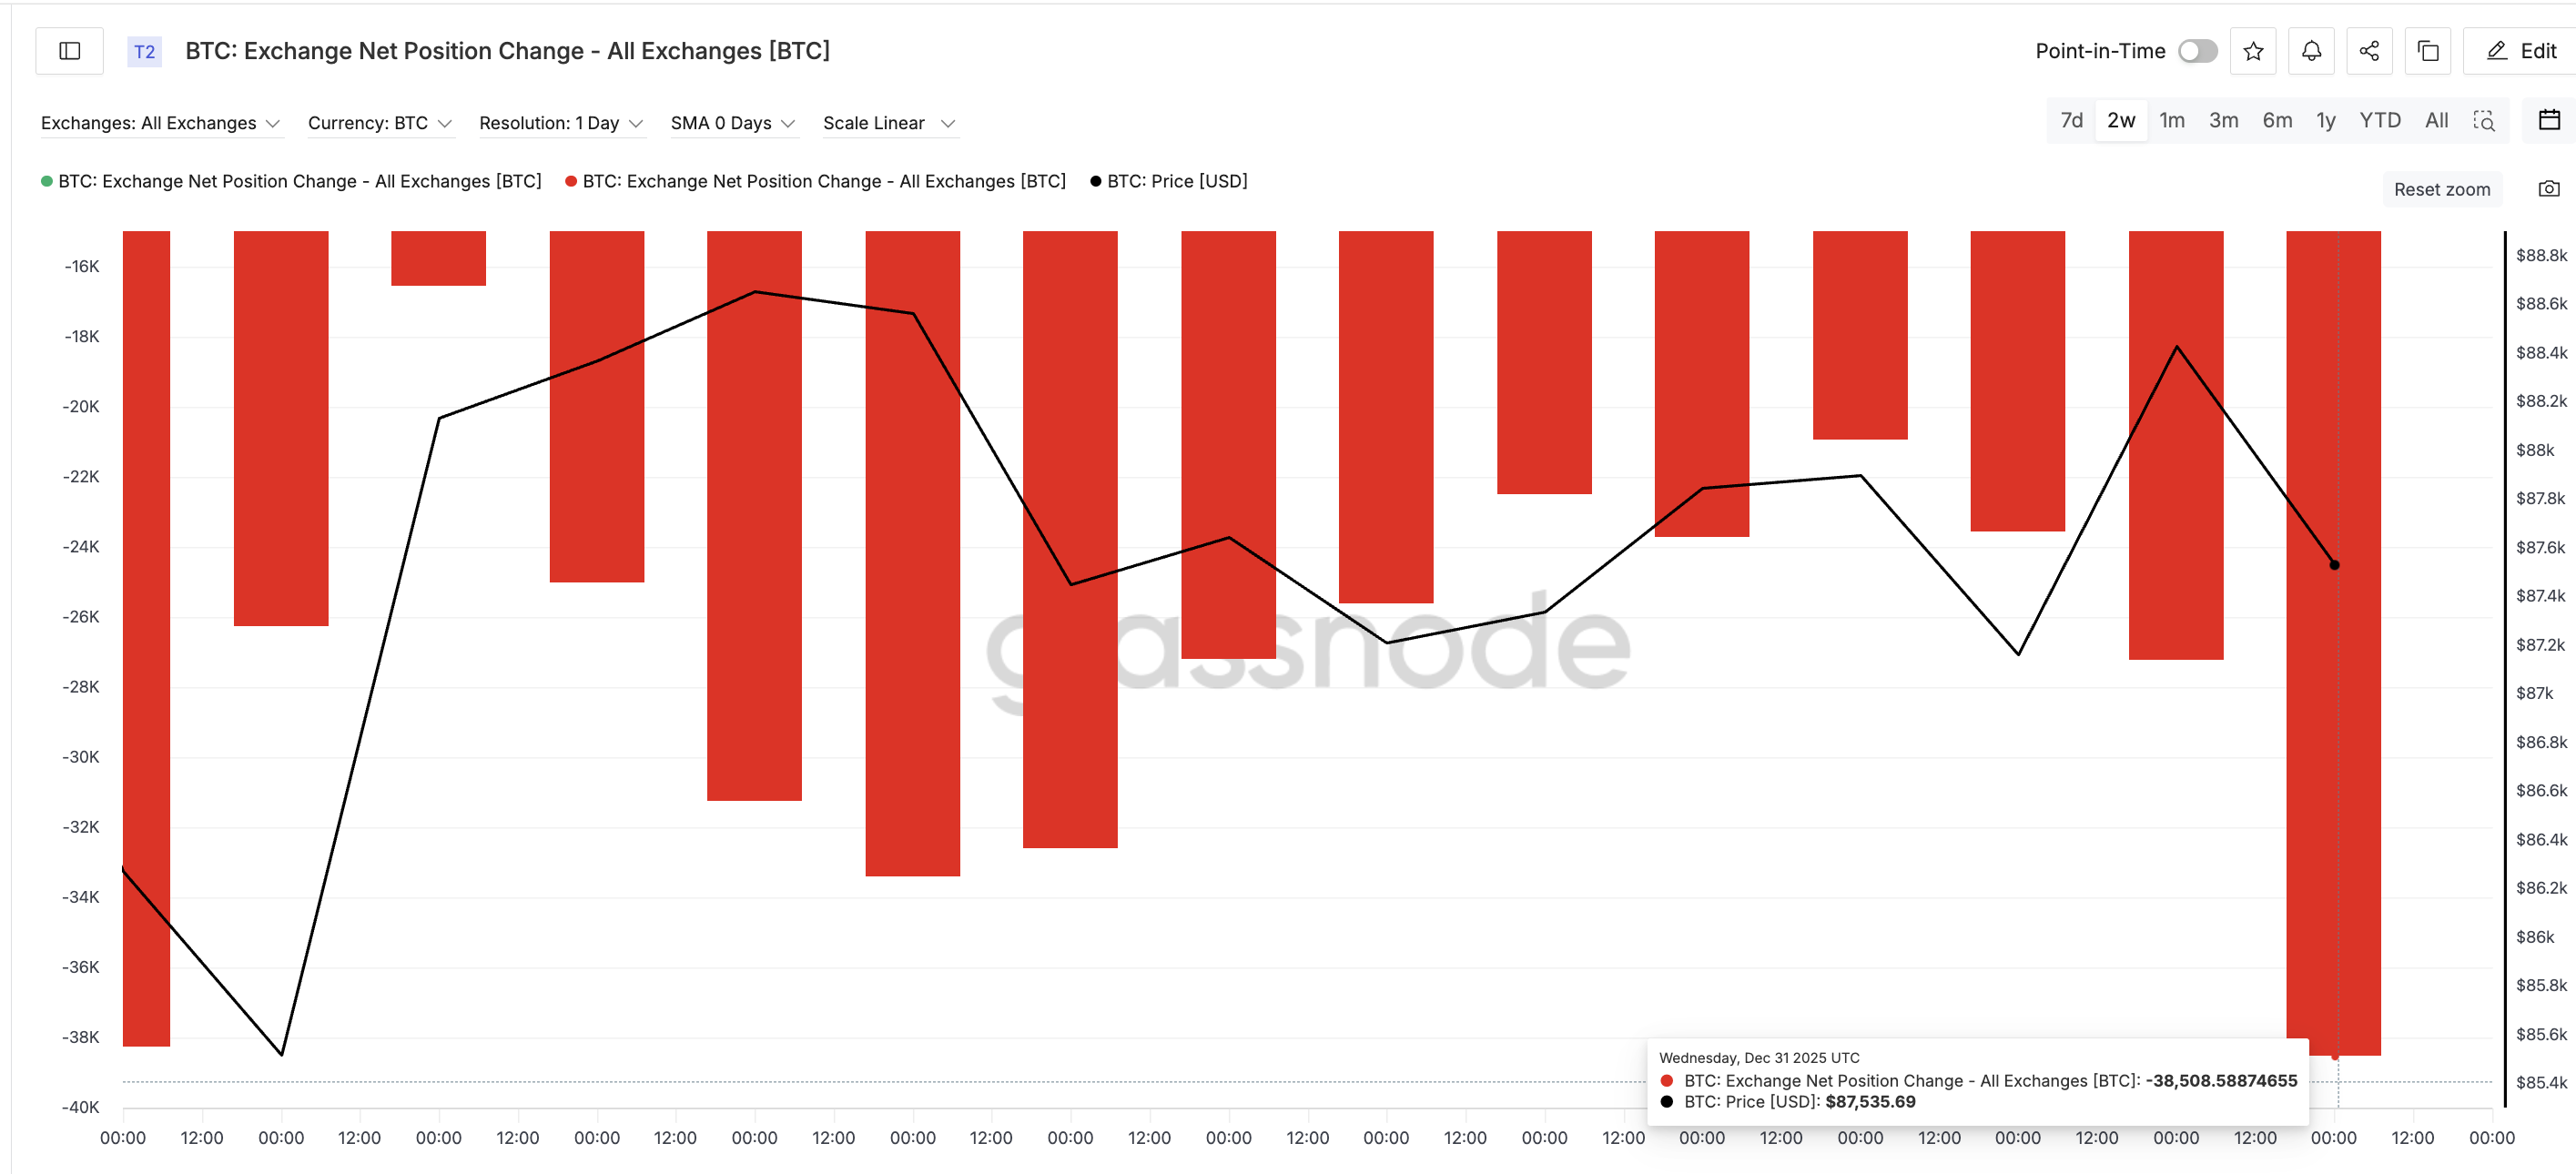
That is an increase of about 132%. This push of coins leaving exchanges helps price stability and keeps the lower trendline of the triangle protected.
Smart Money Highlights Indecision
Smart Money Index readings confirm the lack of direction. The Smart Money Index compares how larger, informed traders position versus the broader market. The line is hugging its signal line with no clear separation. That hints that larger traders are waiting for a breakout and not betting on either direction yet.
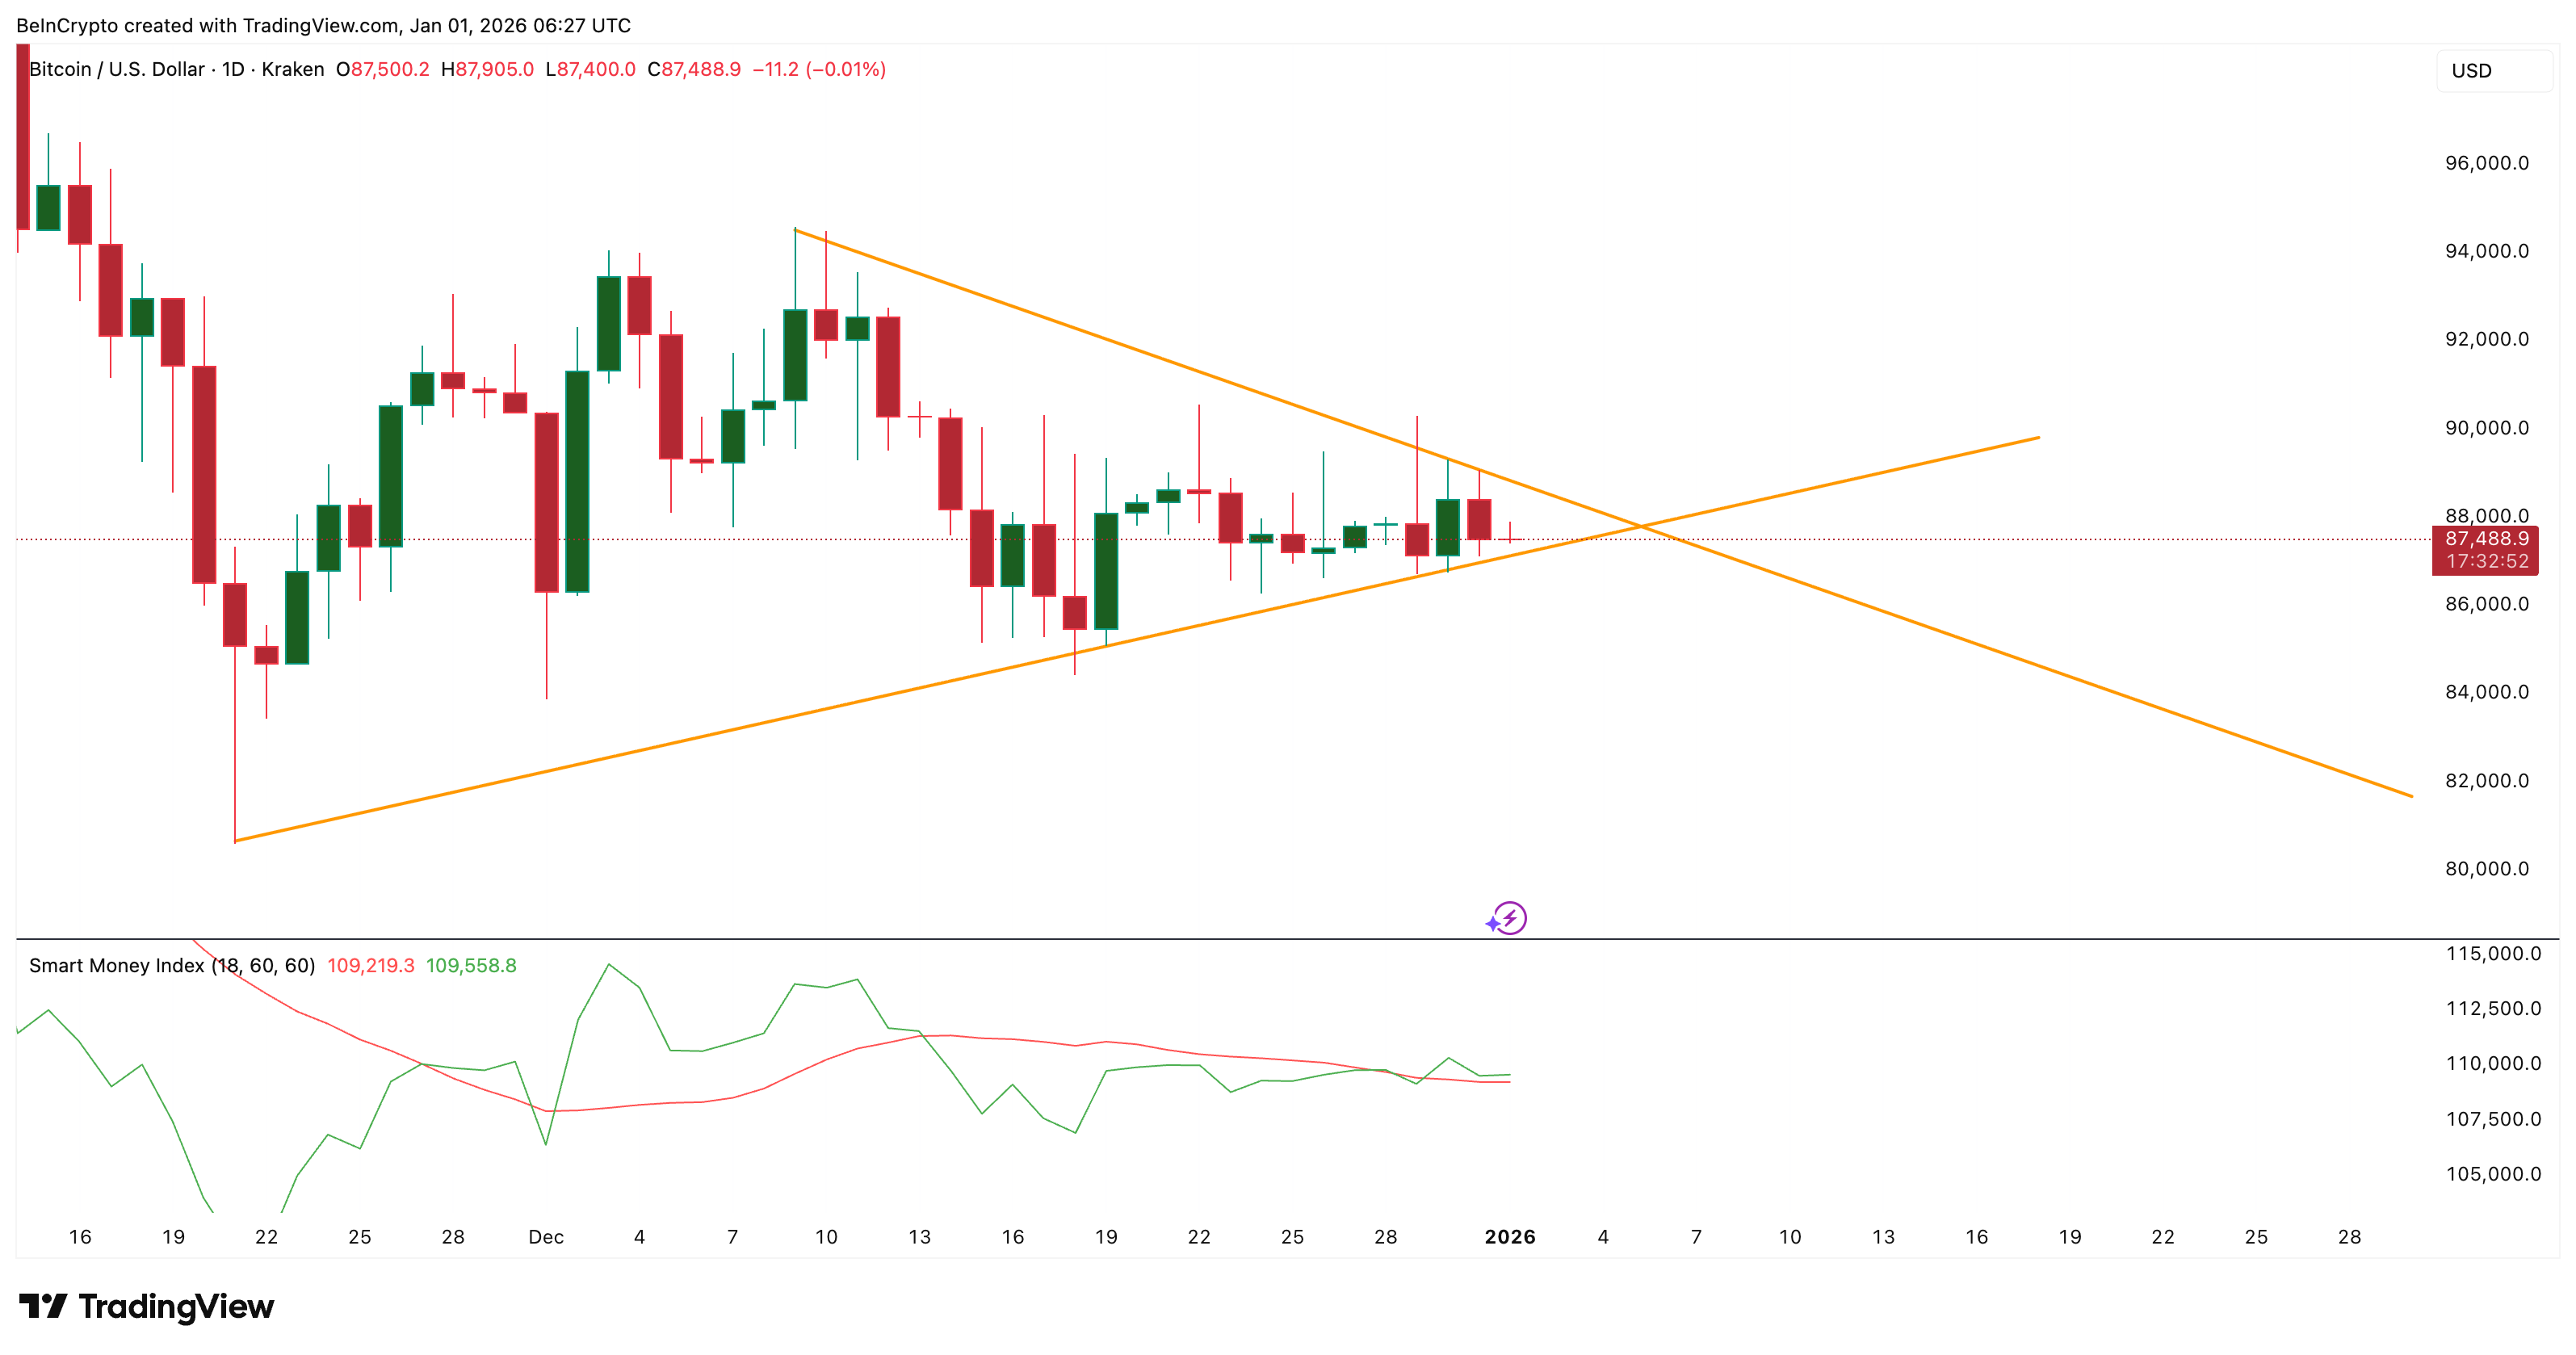
Until the breakout happens, the triangle stays neutral.
This matches what CMF and exchange flow data are saying. Outflows signal pressure. Exchange withdrawals signal support. Together, they cancel each other and hold the $BTC price still. And even the most informed traders are unsure as to which side would win.
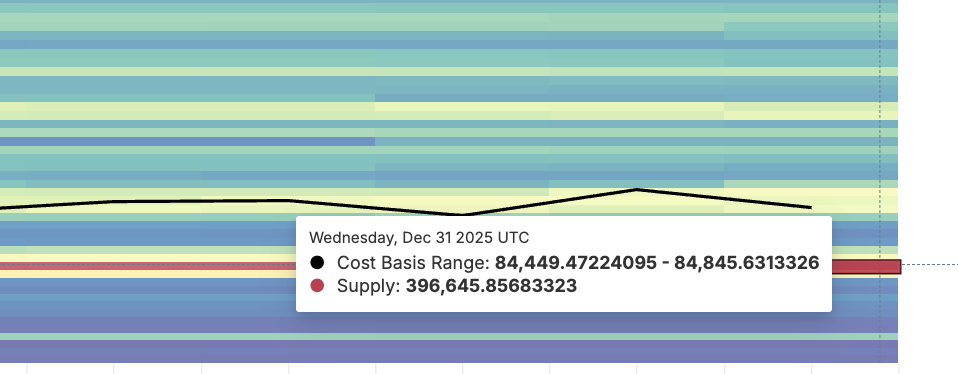
Heat Map and Bitcoin Price Levels Reveal The Trigger Window
The cost basis heat map highlights clusters where many buyers last bought. These clusters often act like support or resistance. The nearest resistance zone is around $88,082 to $88,459, where about 200,035 $BTC sit.
 $BTC Heatmap">
Bitcoin is trading near $87,480. A daily close roughly 1% higher would put the price above that zone. That could act as the first bullish trigger and settle the upper triangle break. On the $BTC price chart, the level aligning with this cluster is $88,300, which needs to break first.
Downside levels look stronger (harder to break) near term. The closest high cost basis support sits at $84,449 to $84,845, where about 396,645 $BTC rest.
 $BTC">
On the price chart, the closest level to this cost basis support is $84,430. The Bitcoin price would need to fall about 3.5% to test that area. So bearish validation sits lower and needs more movement to confirm.
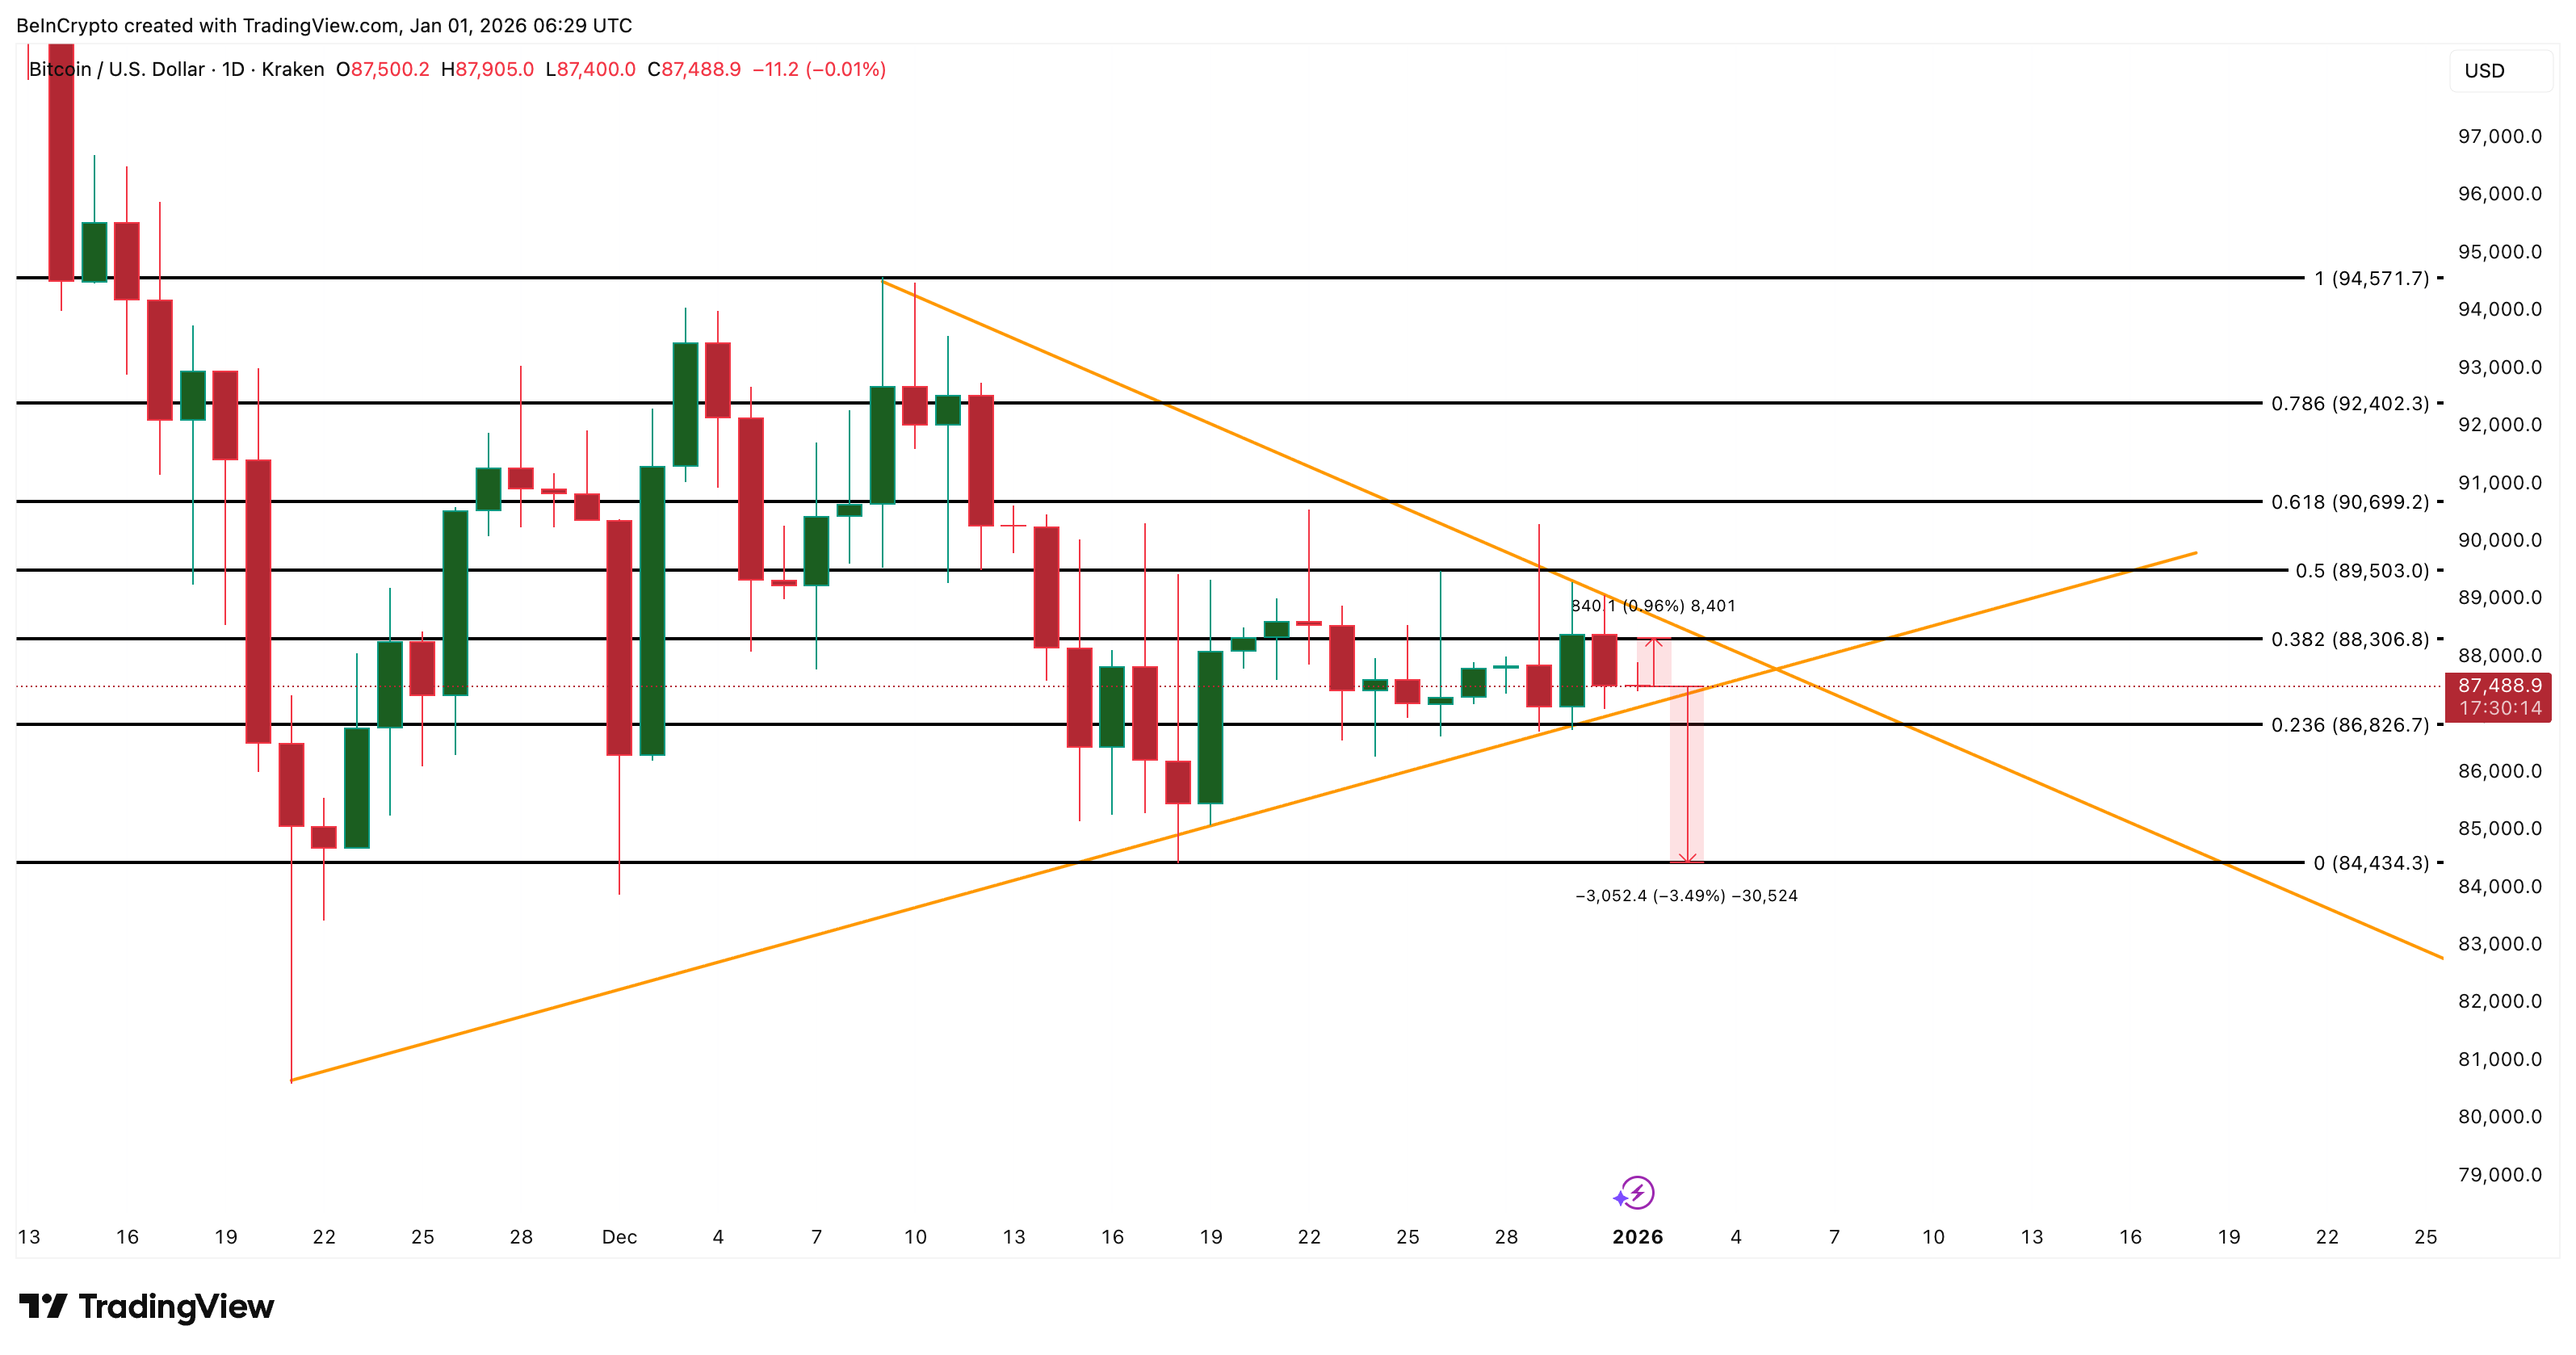
The chart and heat map align. Breaking $88,300 is the first bullish signal. A clean daily close above it turns focus to $89,500 and then $90,690. Losing $84,430 completely flips the setup downward and signals that sellers have won the fight.
The post Bitcoin Takes Its Biggest Fight Into 2026 — A 1% Move Can Settle It For Good appeared first on BeInCrypto.