This same trendline has repeatedly acted as resistance, marking the peaks of previous rallies within Bitcoin’s ongoing three-month consolidation phase.
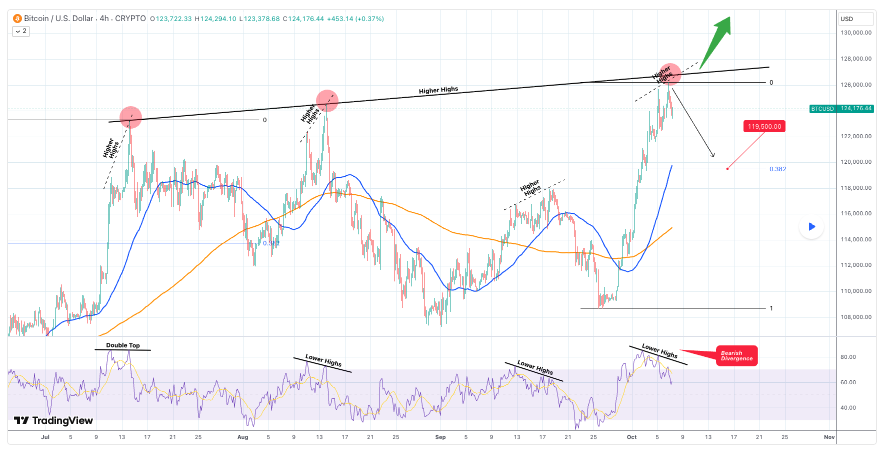
In a TradingView post on October 7, the analyst noted that the current rejection mirrors earlier patterns seen in mid-July and mid-August, both of which triggered sharp retracements.
At the same time, the four-hour Relative Strength Index (RSI) once again shows a bearish divergence, where momentum forms lower highs while Bitcoin’s price makes higher highs, a sign of weakening buying strength and a potential market top.
From a technical standpoint, the correction could extend toward the 0.382 Fibonacci retracement level, near $119,500. This area has served as the minimum retracement level for all previous pullbacks within the consolidation structure.
If Bitcoin can eventually break above this final resistance, it would confirm a technical bullish breakout and likely mark the start of a new upward trend.
Bitcoin price analysis
Meanwhile, Bitcoin has corrected by almost 2% in the past 24 hours, settling at $122,597 as of press time, while in the past week, the maiden digital currency is up 5%.
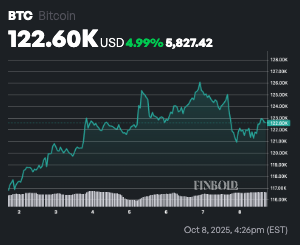
With technical indicators seemingly pointing to a possible price correction, some market participants suggest that as long as the asset sustains its value above $120,000, there’s room for further upside.
Indeed, the possibility of retaining this support is gaining strength from institutional investors who continue to pump capital through exchange-traded funds (ETFs).
Featured image via Shutterstock

 finbold.com




