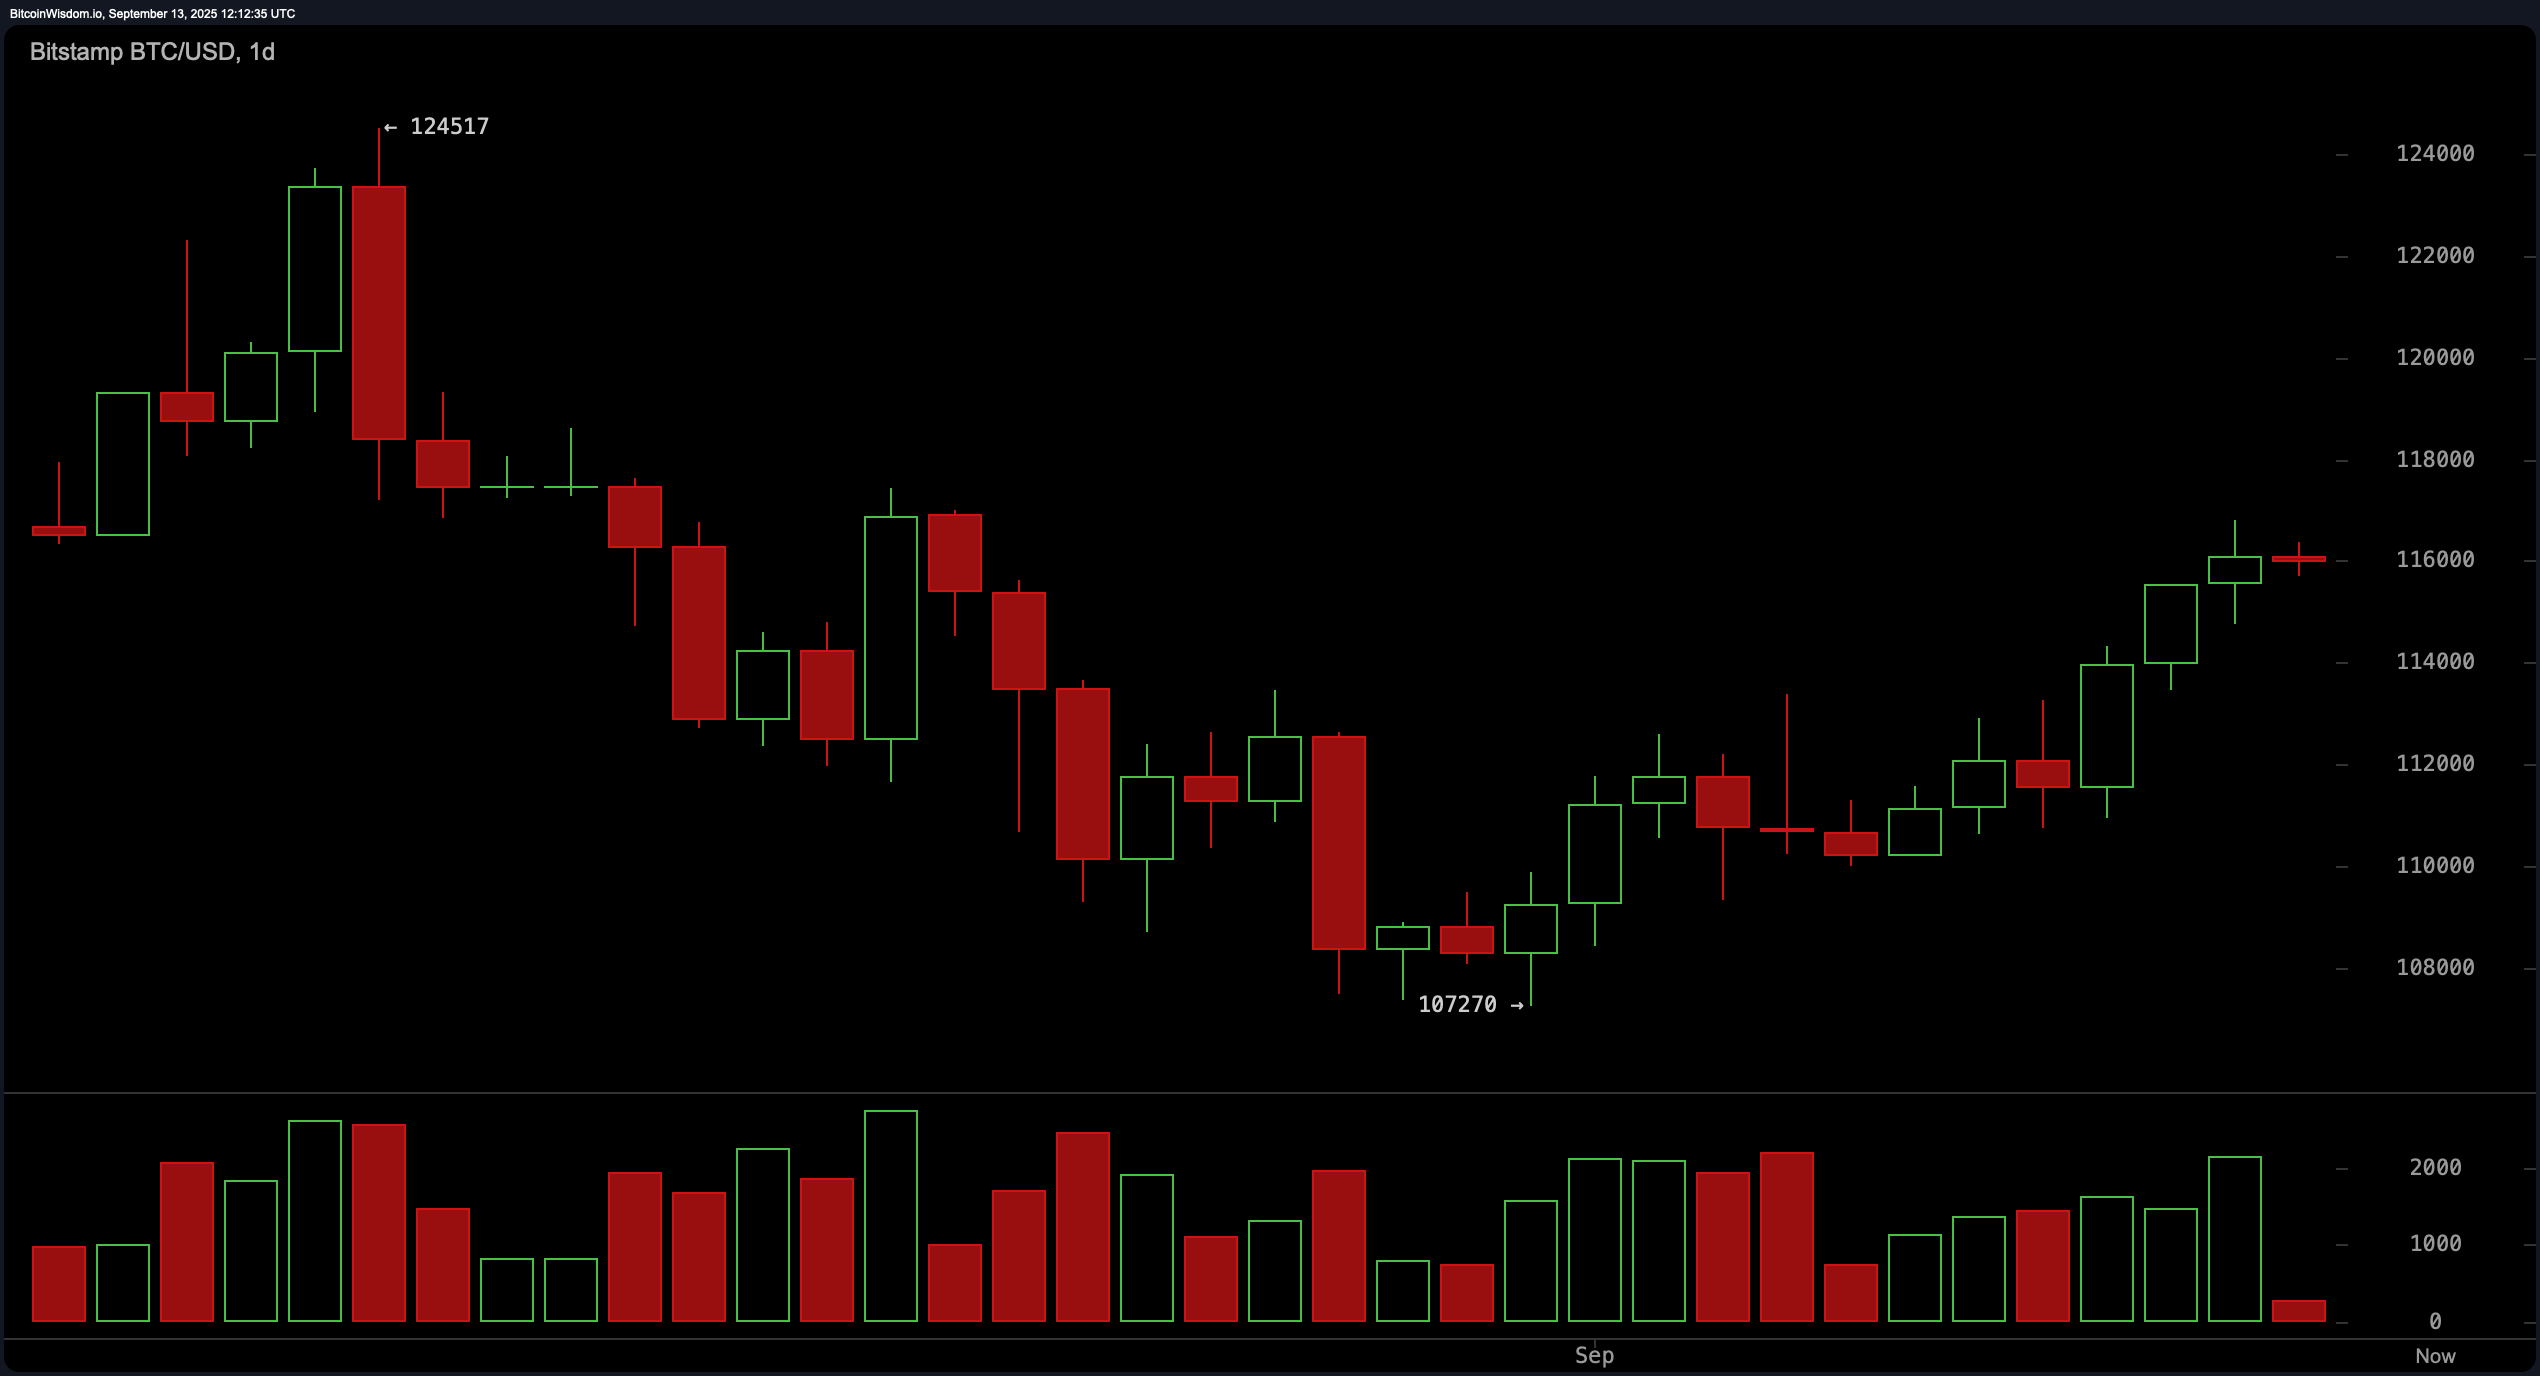
$BTC/USD 1-day chart via Bitstamp on Sept. 12, 2025.
The 4-hour bitcoin chart presents a strong bullish continuation pattern, originating from a breakout at $110,624 and peaking at $116,805. Although the rally remains intact, recent candles are exhibiting smaller bodies, signaling a pause in momentum. Buyers appear to be taking a breather, with support forming between $114,500 and $115,000. A confirmed breakout above $117,000 could accelerate gains toward $118,000 or higher, provided volume accompanies the move. Cautious bulls may consider entries on retests of support or during breakouts with strong volume confirmation.
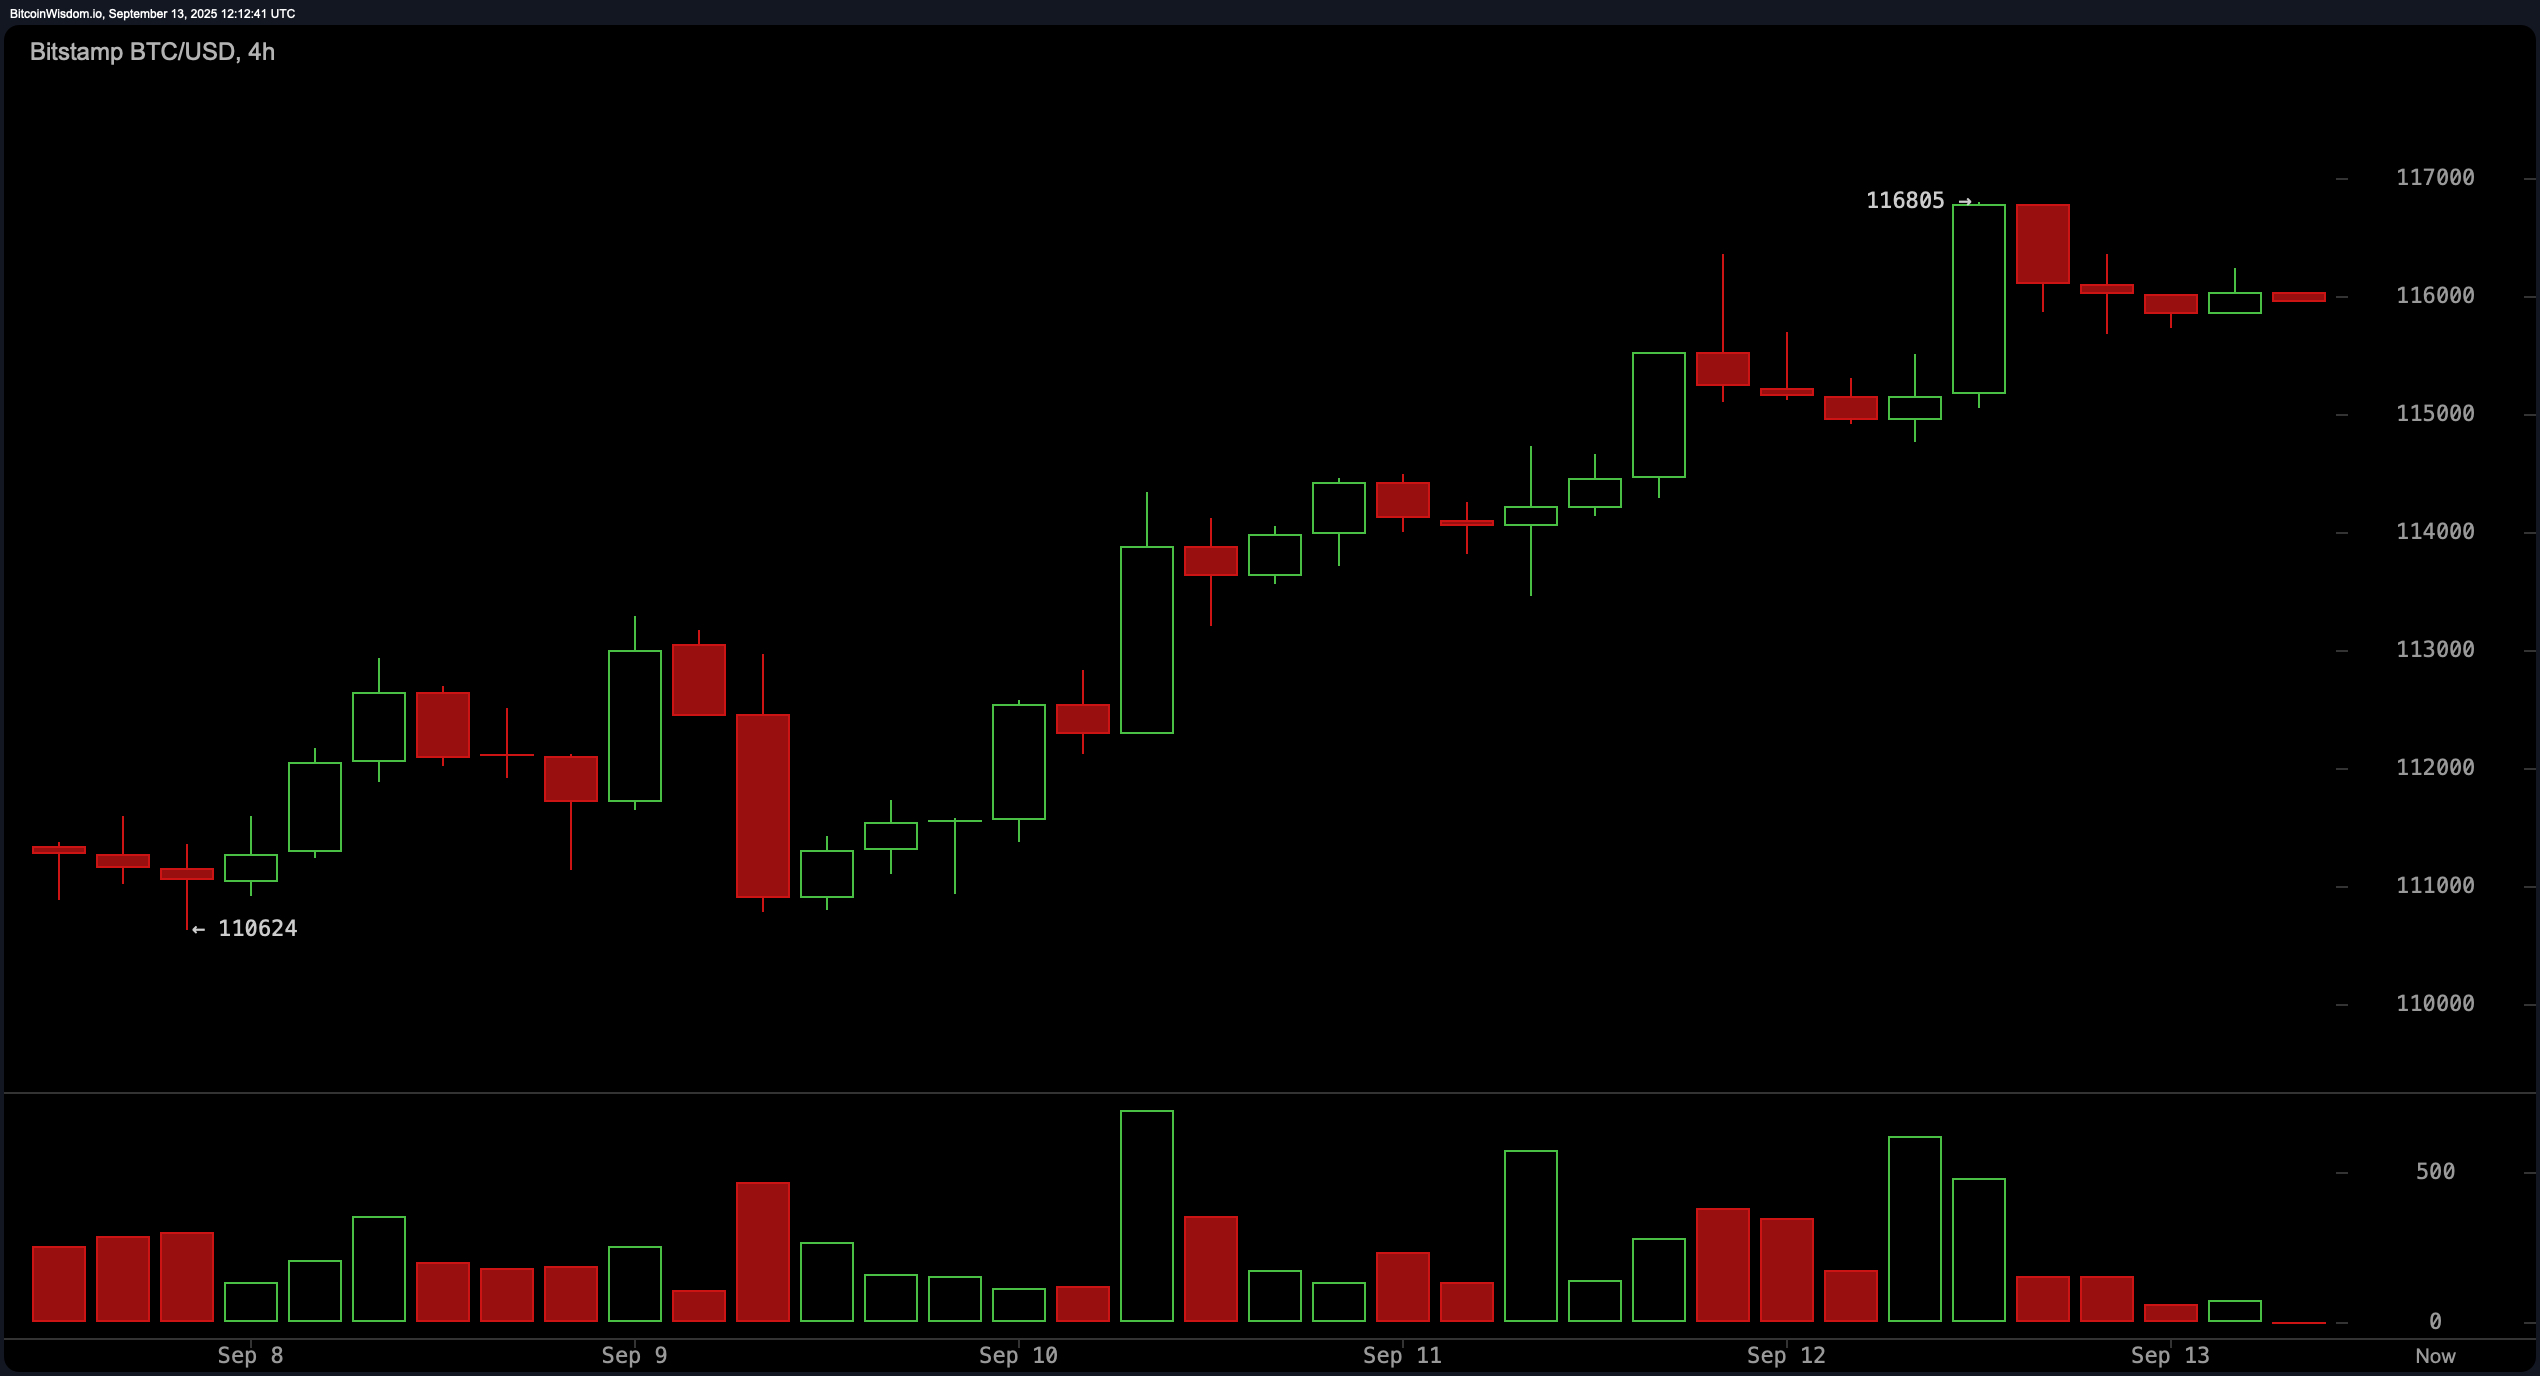
$BTC/USD 4-hour chart via Bitstamp on Sept. 12, 2025.
On the 1-hour chart, bitcoin is consolidating beneath the $116,805 high, forming what appears to be a bullish flag or range-bound setup. Momentum is cooling, but not reversing, which often precedes a continuation move. Short-term support lies near $114,770, with buyers still in control as long as the price remains above $115,500. Scalpers may find opportunities in a breakout above $116,800 or a bounce near the $115,000 level, though stops should be kept tight under $114,770 due to the possibility of short-term pullbacks.
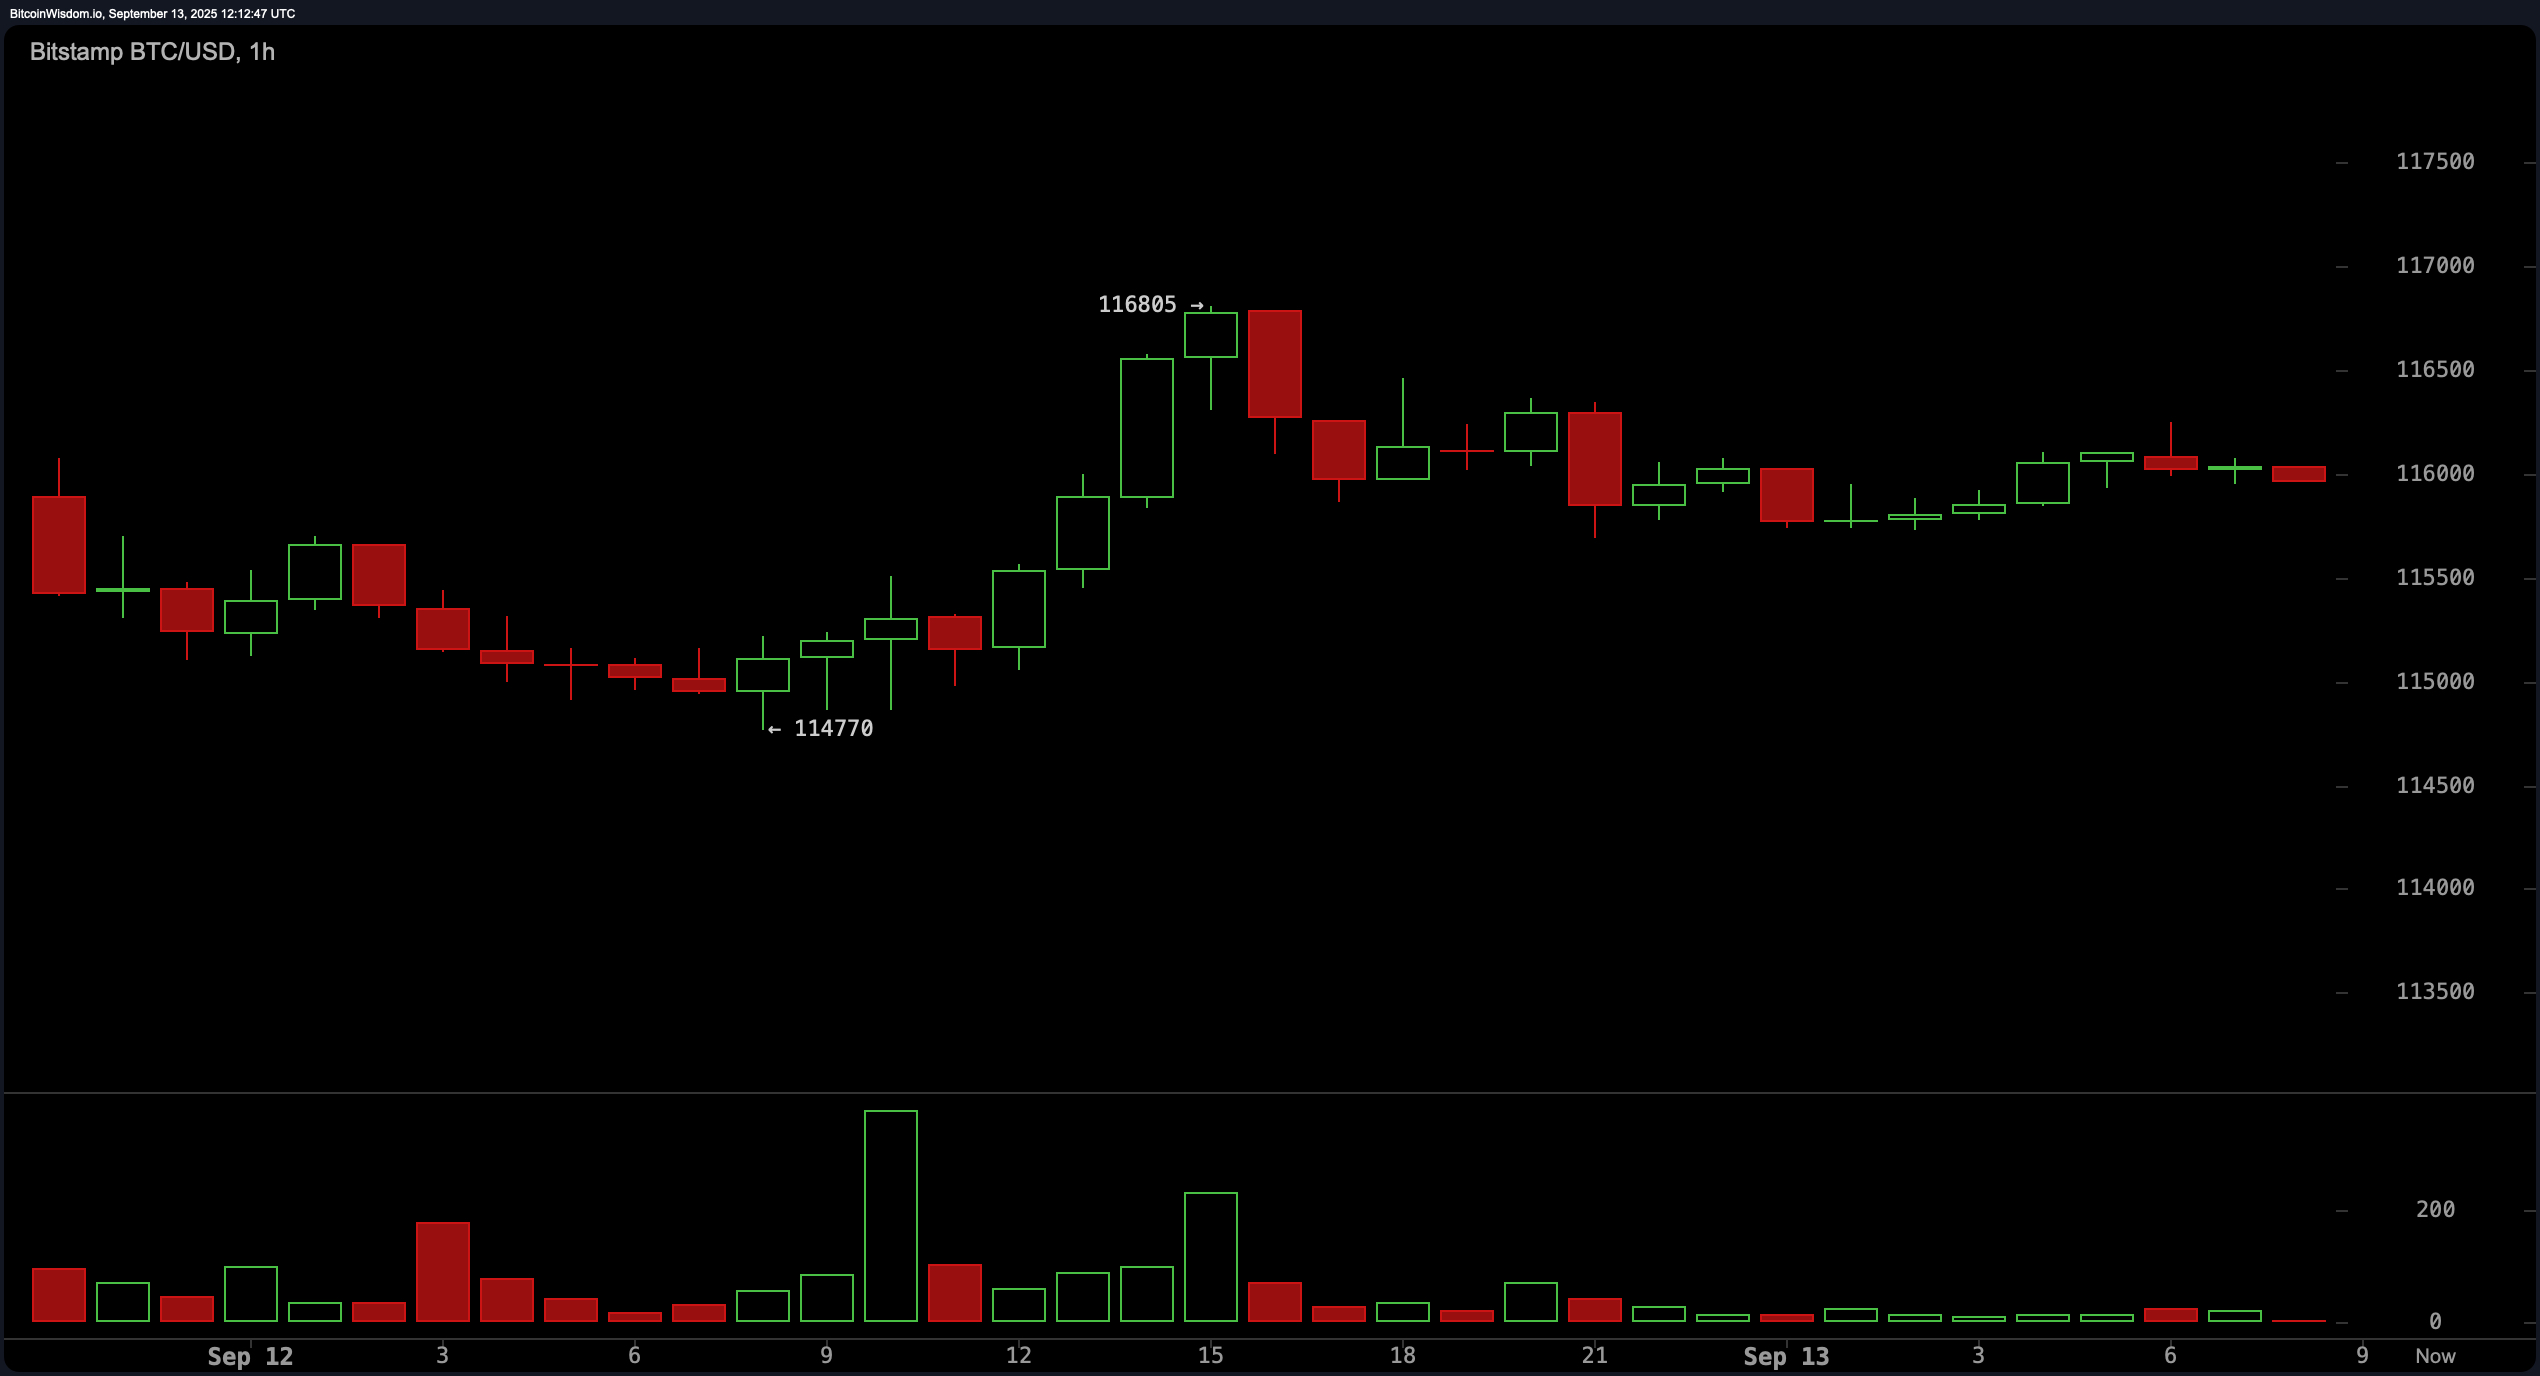
$BTC/USD 1-hour chart via Bitstamp on Sept. 12, 2025.
From a technical indicator perspective, moving averages uniformly point to bullish momentum. All key levels of the exponential moving average (EMA) and simple moving average (SMA)—including the 10, 20, 30, 50, 100, and 200-period indicators—signal a buying condition, confirming that bitcoin is trading above significant trend markers. The exponential moving average (10) at $113,586 and simple moving average (10) at $112,799 offer near-term trend support, while the longer-term simple moving average (200) at $102,349 underscores a deep bullish base.
Oscillators present a mixed picture. The relative strength index (RSI) sits at 59, suggesting neutral momentum without overbought conditions. The stochastic oscillator is elevated at 95, indicating potential overbought signals. The commodity channel index (CCI) at 195 and momentum at 4,219 both issue a sell signal, hinting at waning upward drive. Meanwhile, the awesome oscillator at 475 and the moving average convergence divergence (MACD) level at 202 both show buy signals, suggesting the broader trend remains intact. This divergence in indicators calls for cautious optimism, with a focus on volume-supported moves.
Bull Verdict:
With bitcoin holding above key support zones and all major moving averages aligned to the upside, the broader technical structure remains bullish. If buyers can push through the $117,000 resistance with strong volume, the path toward $120,000 appears viable in the near term.
Bear Verdict:
Despite the bullish structure, overstretched oscillators and waning intraday momentum suggest caution. A breakdown below $114,770 on volume could shift short-term sentiment bearish and trigger a deeper retracement toward previous consolidation levels near $113,500.

 news.bitcoin.com