
Bitcoin is trading at $82,560 to $82,944 over the last hour with a market capitalization of $1.64 trillion and a 24-hour trading volume of $24.98 billion. Within the last 24 hours, bitcoin fluctuated between $82,497 and $84,497, signaling heightened volatility within a clearly defined intraday range.
Bitcoin
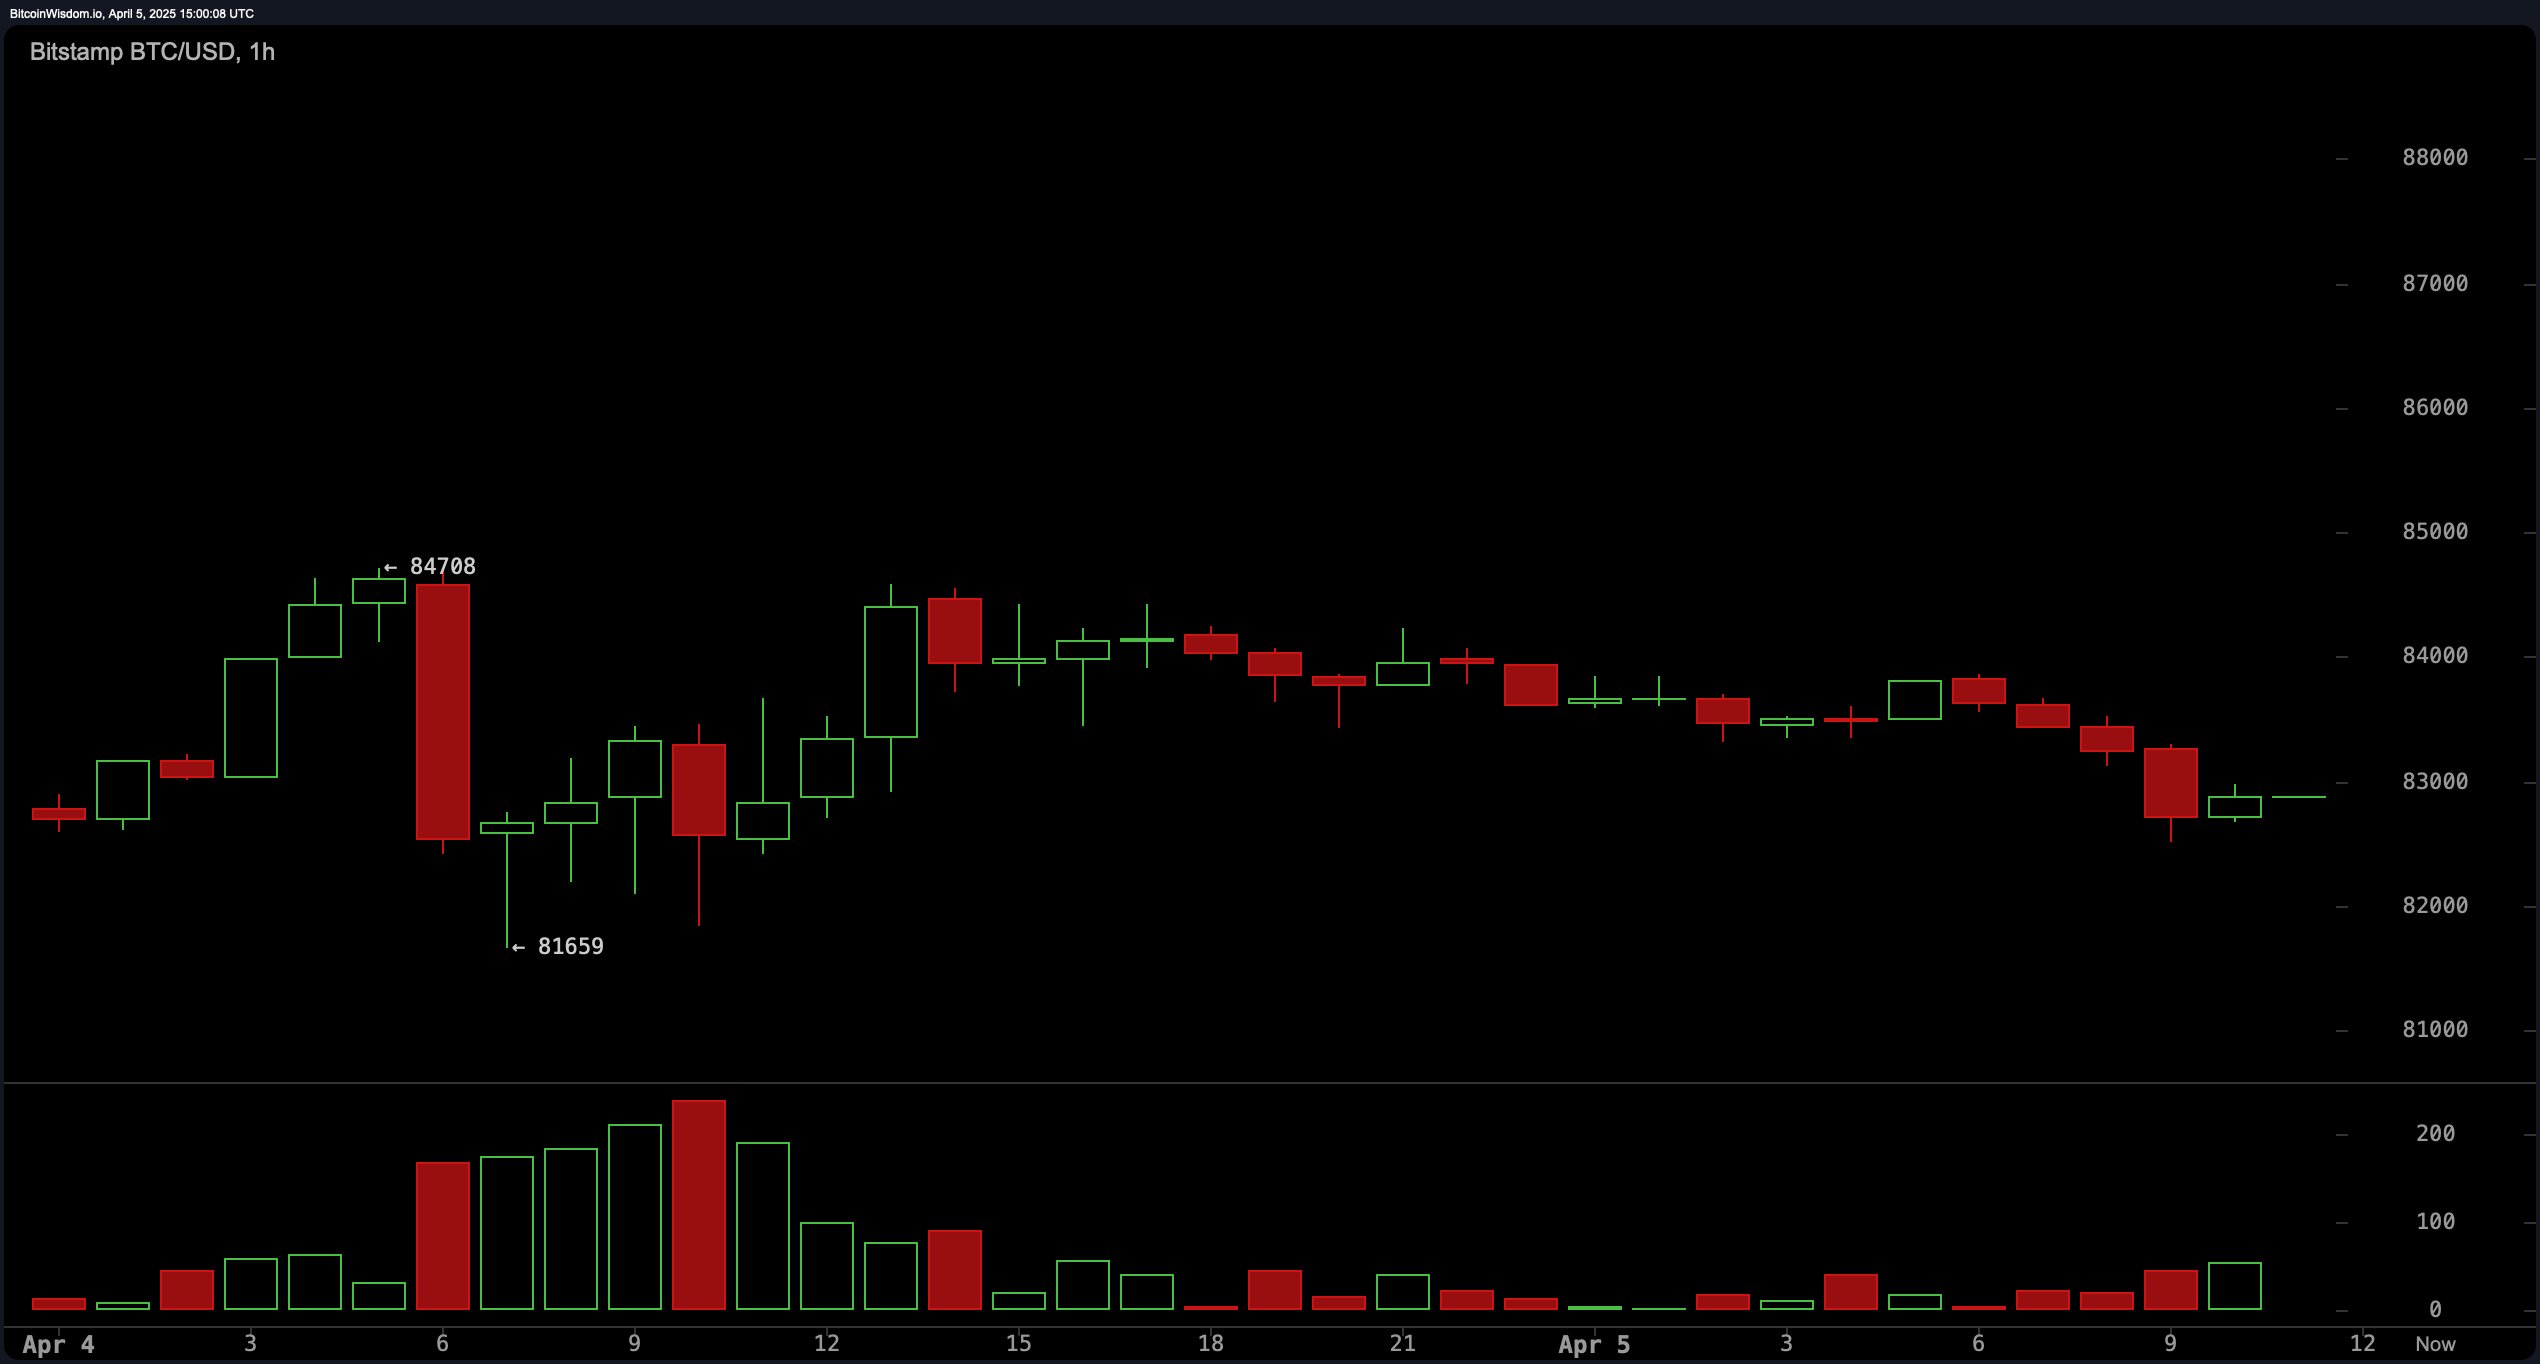
Bitcoin‘s 1-hour chart reflects a bearish micro-trend characterized by small-bodied candles and a lack of decisive price action. After a breakdown from $84,708 to $81,659, bitcoin has been consolidating within a narrow range of $82,800 to $83,800. Volume remains subdued, suggesting low conviction among traders. The Fibonacci retracement places the 50% pivot at $83,184, around which the price is oscillating. Without a sustained break above the 61.8% retracement level at $83,437, short-term price movement is likely to remain sideways or weaken further. Scalping opportunities exist within this band, with entries near $82,500 and exits around $83,800, supported by a stop loss beneath $82,200.
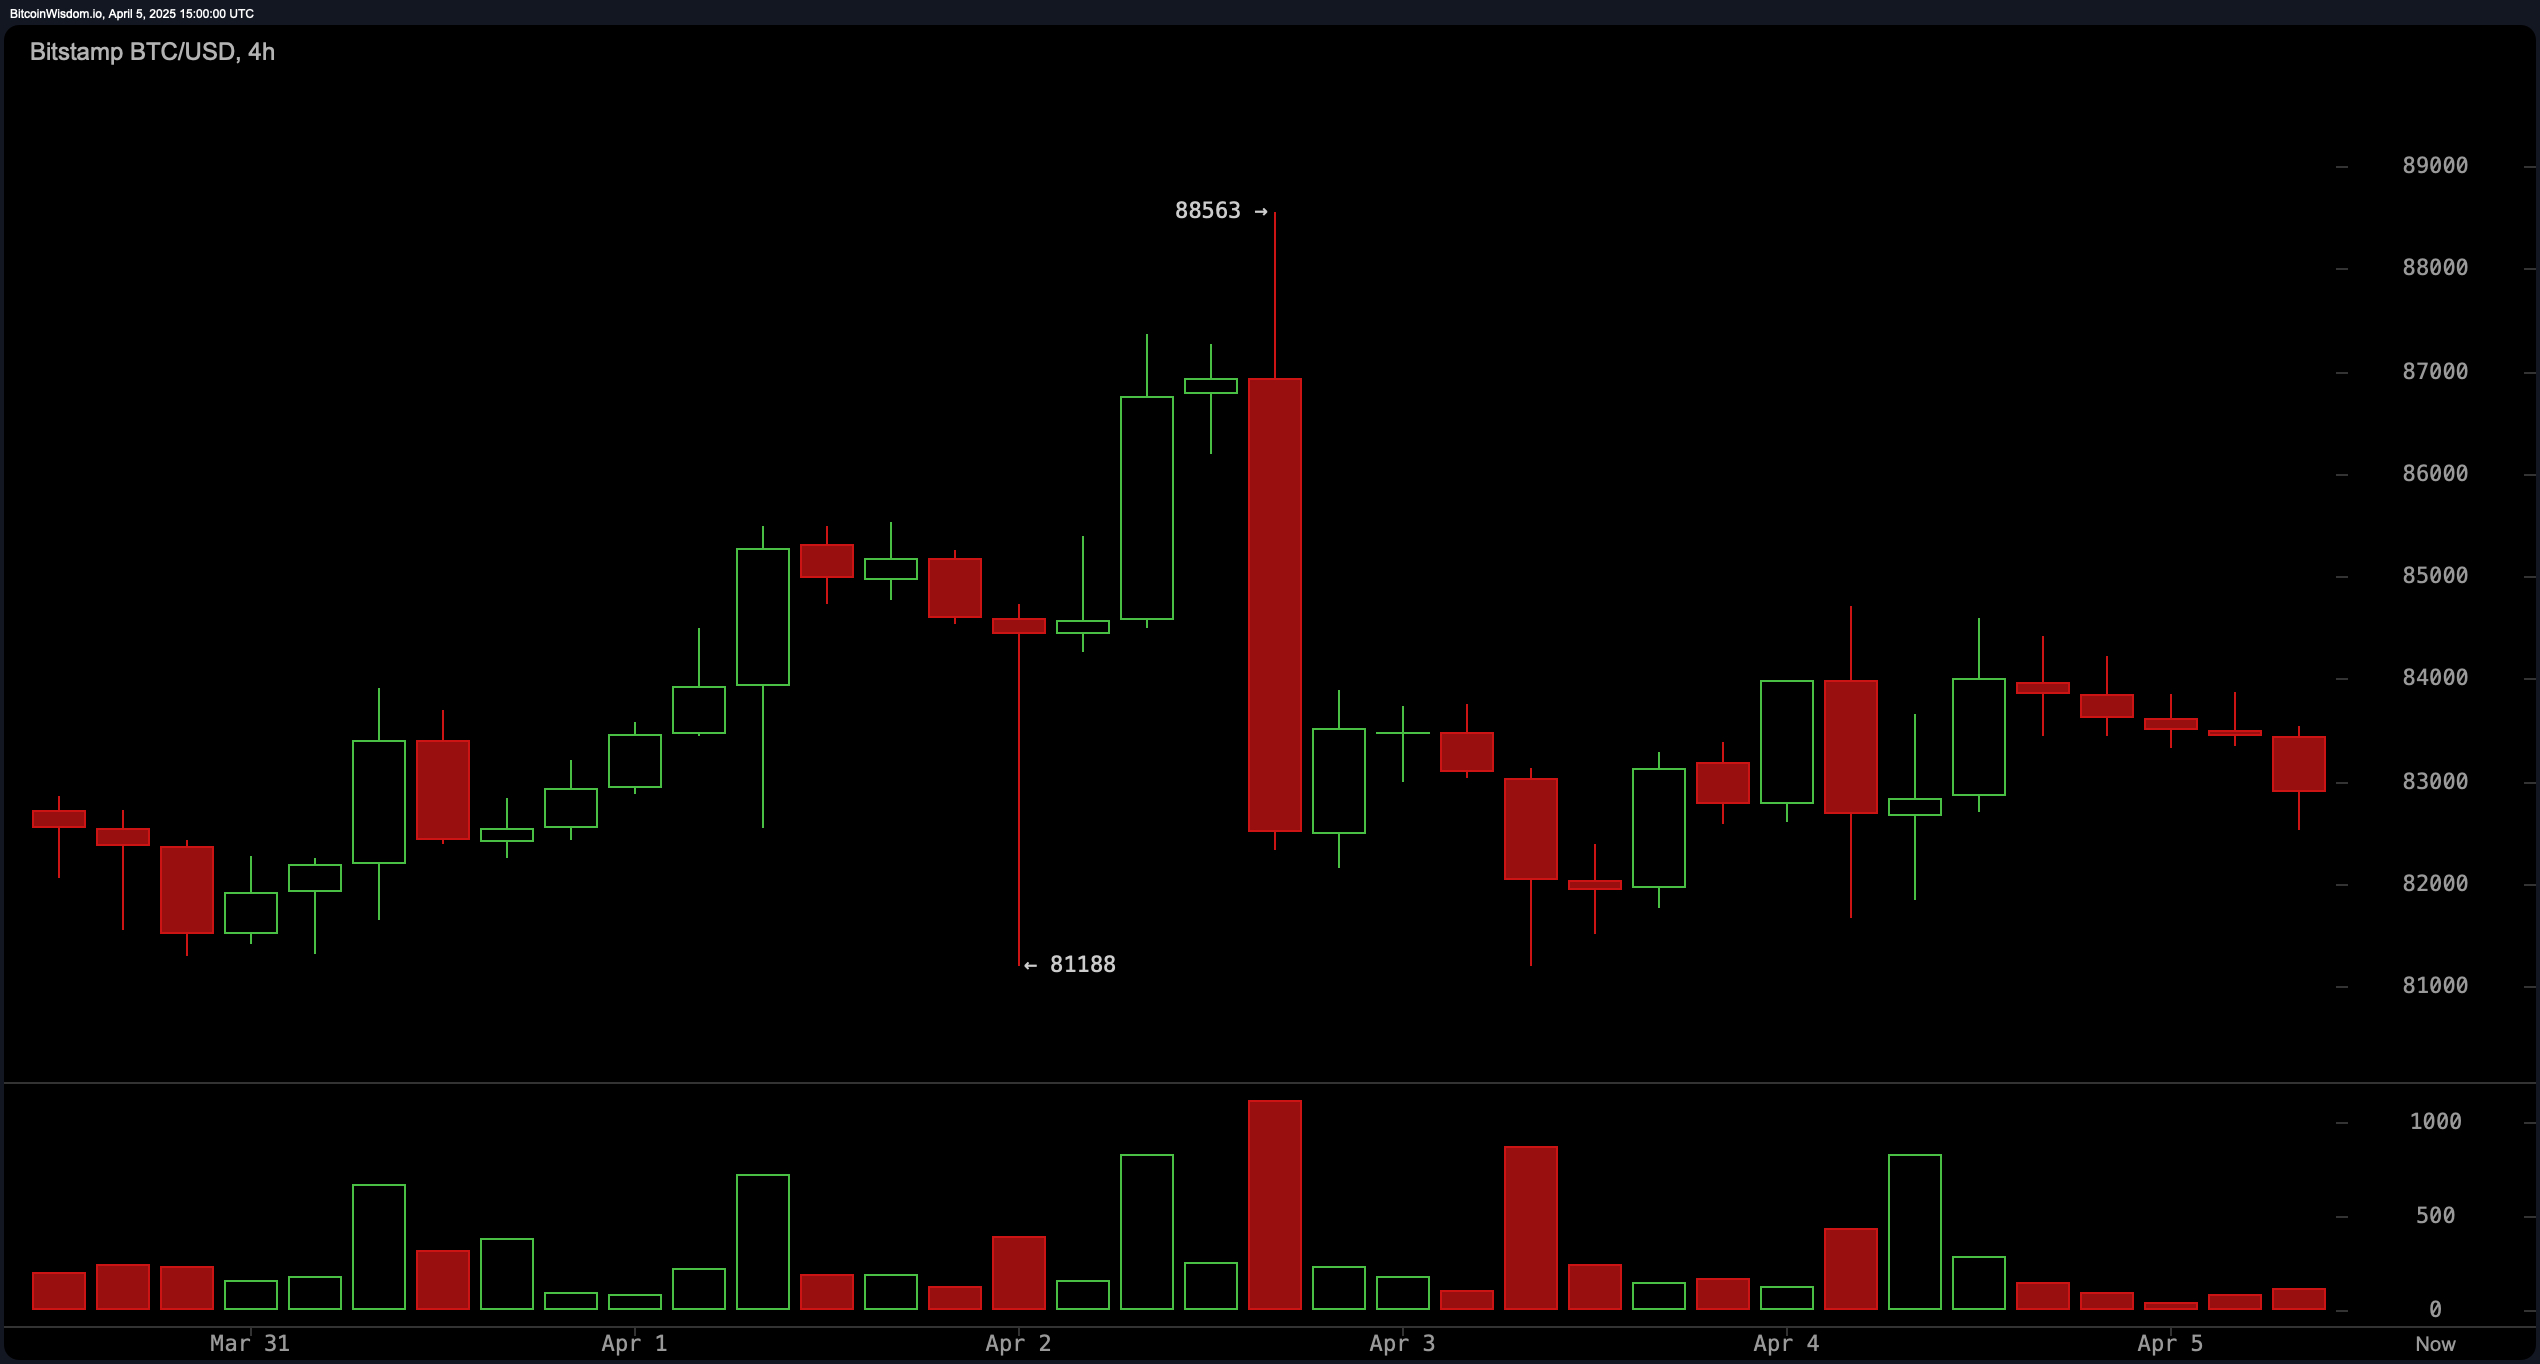
On the 4-hour chart, a failed breakout on April 2nd—peaking at $88,563—preceded a sharp decline to $81,188, confirming the presence of a liquidity trap. Since that event, bitcoin has printed lower highs amid choppy, indecisive action. Resistance is now clustered around $85,000, while minor support has developed near $82,500. The Fibonacci retracement indicates that bitcoin is encountering resistance near the 38.2% level at $83,980 and the 50% level at $84,875. Multiple rejections near these levels reinforce bearish sentiment, and unless the price can reclaim the 61.8% level at $85,770, downside risk remains dominant.
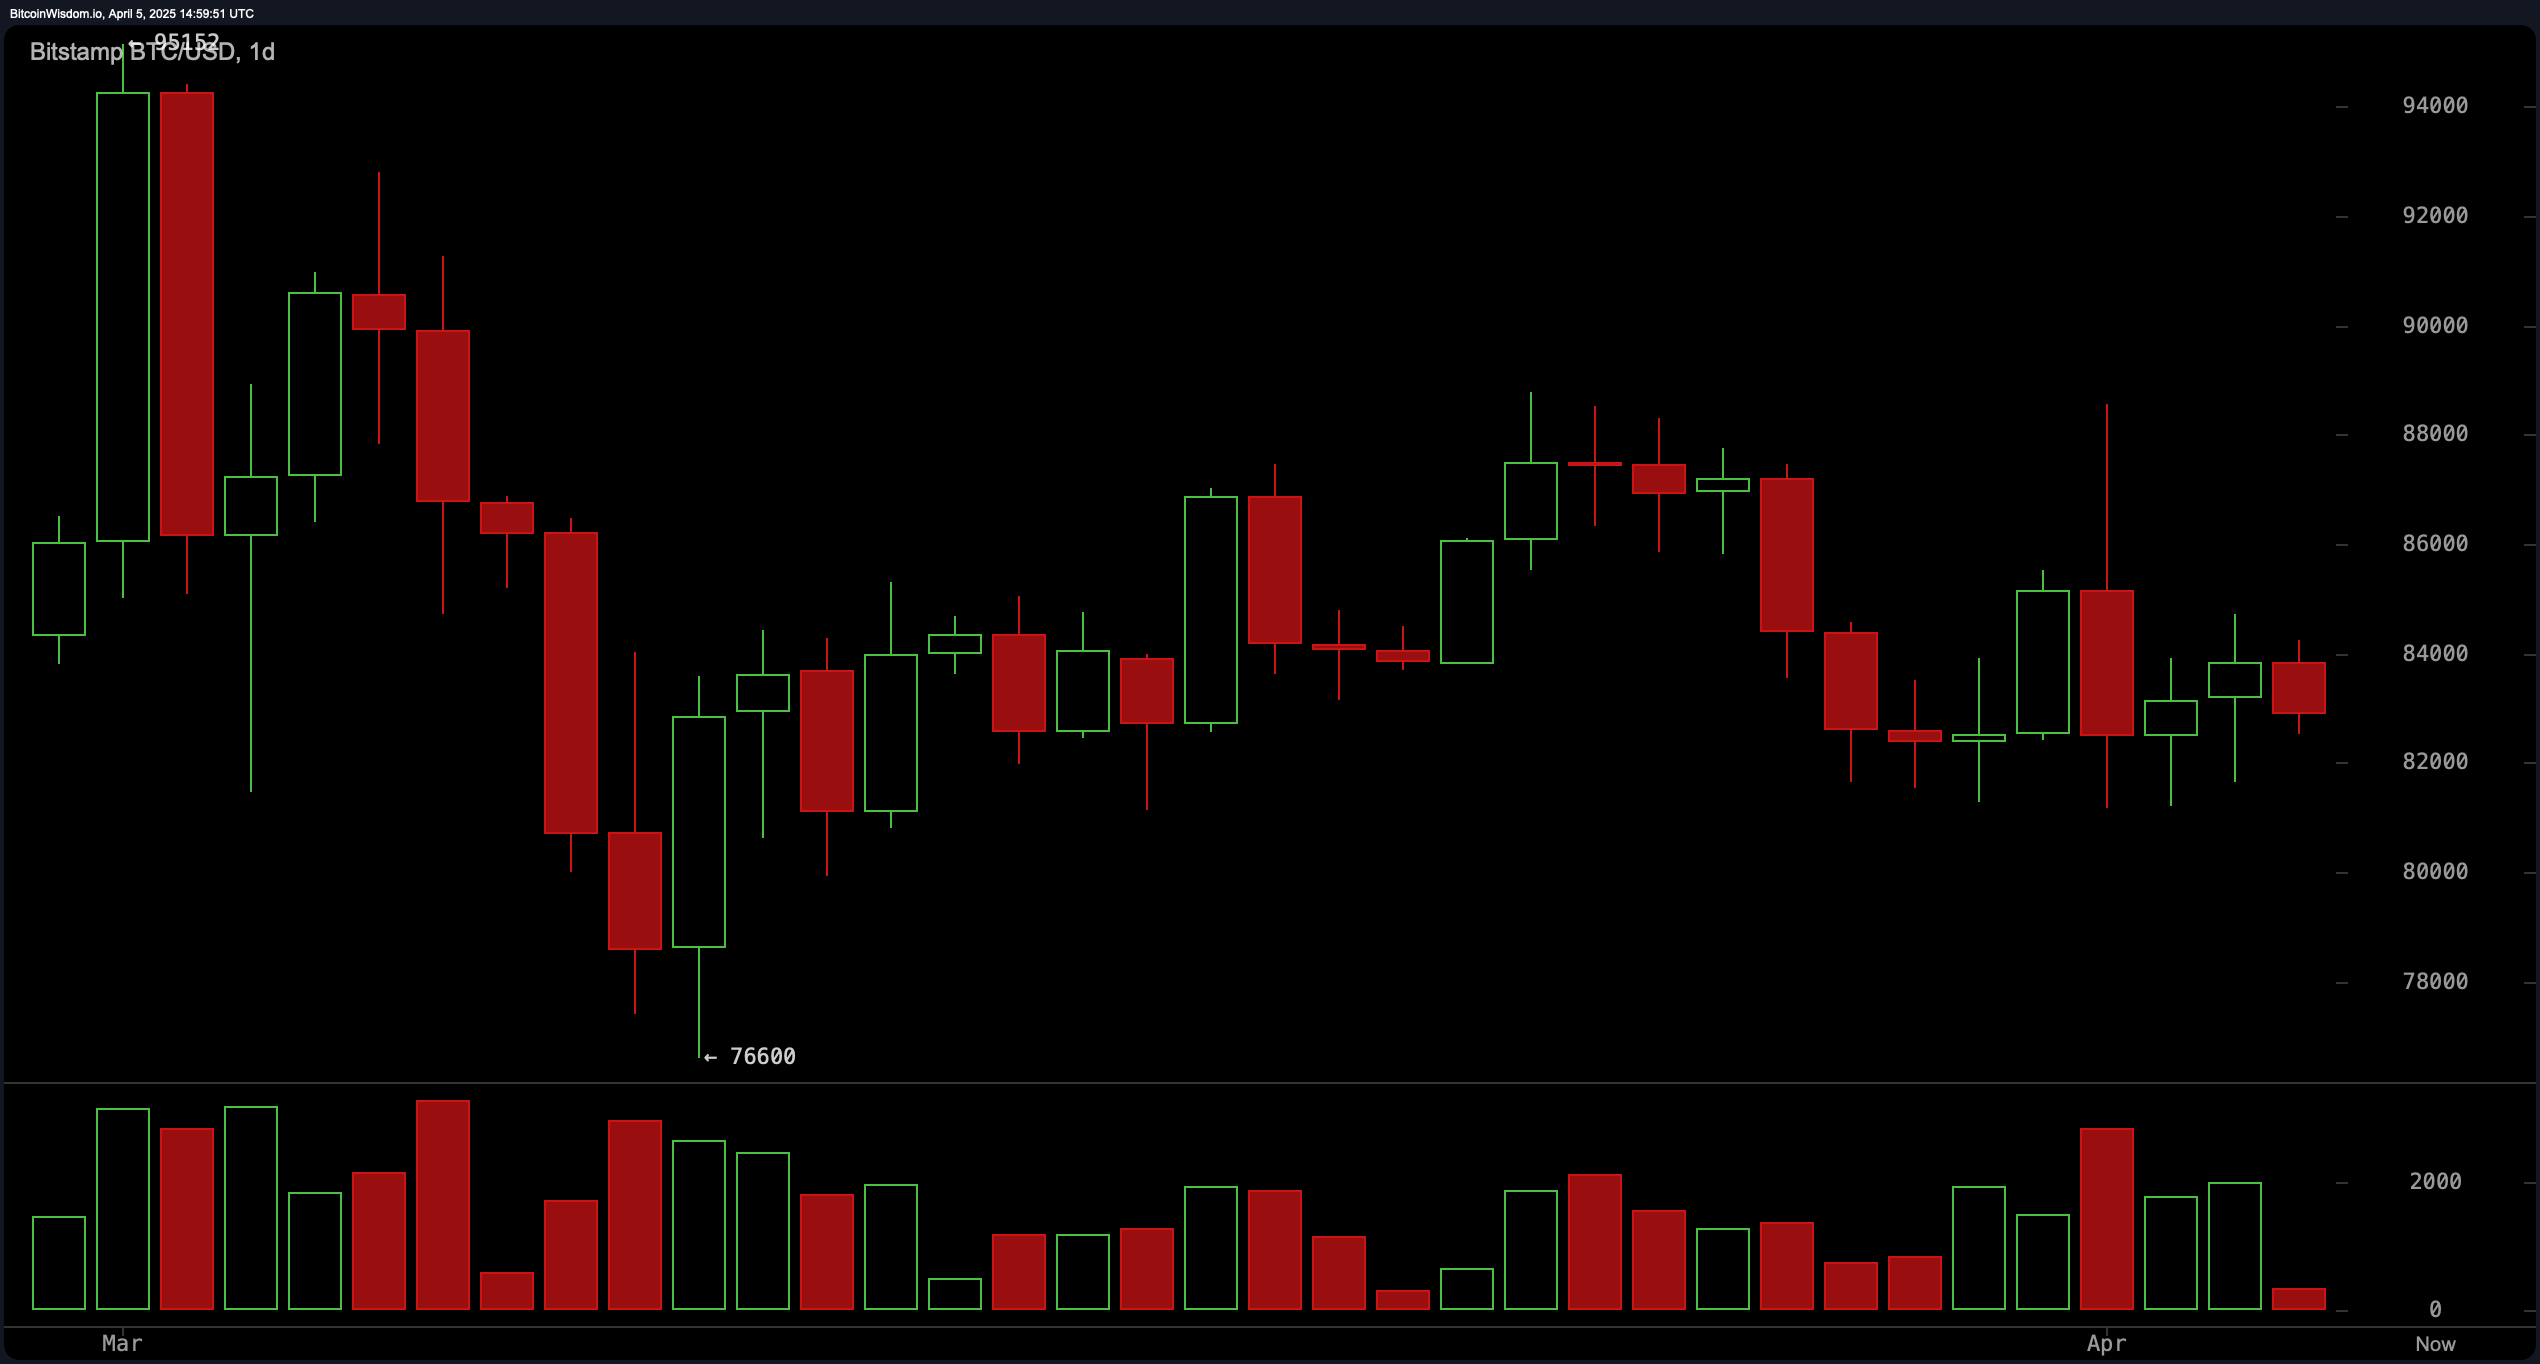
From a daily perspective, bitcoin has entered a consolidation phase after retreating from a recent high of approximately $94,000 to a low near $76,600. Current price activity is confined to a range between $82,000 and $84,500, with the market demonstrating indecision through doji patterns and extended wicks. The 38.2% Fibonacci retracement on the daily chart is around $84,265, aligning with current price action, while the 50% and 61.8% levels at $85,300 and $86,335 respectively present critical resistance. A break and close above $85,500 on strong volume would confirm bullish reversal, while a drop below $81,500 could trigger further declines toward $78,000.
Oscillators are predominantly neutral, reflecting the broader market indecisiveness. The relative strength index (RSI) at 45, Stochastic at 28, commodity channel index (CCI) at −61, average directional index (ADX) at 19, and awesome oscillator at −1,027 all point to a lack of directional momentum. Notably, the momentum oscillator, at −3,942, signals a bearish bias, while the moving average convergence divergence (MACD) level at −1,013 suggests a possible bullish setup as it may signal divergence from the prevailing trend. The mixed signals from these oscillators reinforce the view that bitcoin remains in a critical decision zone where either a breakout or a breakdown could unfold.
The Fibonacci retracement analysis across all three timeframes consistently shows bitcoin struggling around the 38.2% to 50% levels. On the daily chart, the golden ratio at 61.8% ($86,335) remains a formidable resistance level, and failure to clear this range could result in a drop back to the $80,000 region. The 4-hour timeframe reveals similar dynamics, with price action repeatedly stalling below the 50% and 61.8% retracements. On the 1-hour chart, bitcoin is hovering near the 50% pivot, but rejection from the 61.8% level ($83,437) has so far prevented further upside. Overall, unless bitcoin can decisively break the 61.8% retracement with volume, bears are likely to maintain control.
The landscape of moving averages reinforces a bearish technical setup across all major timeframes. Every key exponential moving average (EMA) and simple moving average (SMA) from 10 to 200 periods is signaling a sell. The 10-period EMA and SMA are positioned at $83,718 and $83,666 respectively, both above the current price and contributing to short-term downward pressure. Longer-term averages, such as the 200-period EMA at $85,363 and the 200-period SMA at $86,652, also remain elevated, reflecting the residual impact of earlier bullish momentum and posing further resistance. Without a strong move above these averages, bitcoin is unlikely to shift from its current bearish-to-neutral stance.
Bull Verdict:
If bitcoin can break above the $85,500 resistance level on high volume, supported by a reclaim of the 61.8% Fibonacci retracement zone across the 1-hour, 4-hour, and daily charts, a bullish reversal may gain traction. Confirmation would be strengthened by a shift in oscillators like the momentum oscillator and the moving average convergence divergence (MACD) from neutral to bullish, and by the price closing above key moving averages, particularly the 50-period and 200-period exponential moving averages.
Bear Verdict:
Should bitcoin fail to reclaim the $84,000–$85,000 zone and instead close below the $81,500 support level with rising volume, it would likely signal a continuation of the bearish trend. The persistent rejection at the 50% to 61.8% Fibonacci levels, the overall sell signals from all moving averages, and weakening momentum indicators would collectively point toward a potential decline back to the $78,000 range or lower.