news.bitcoin.com

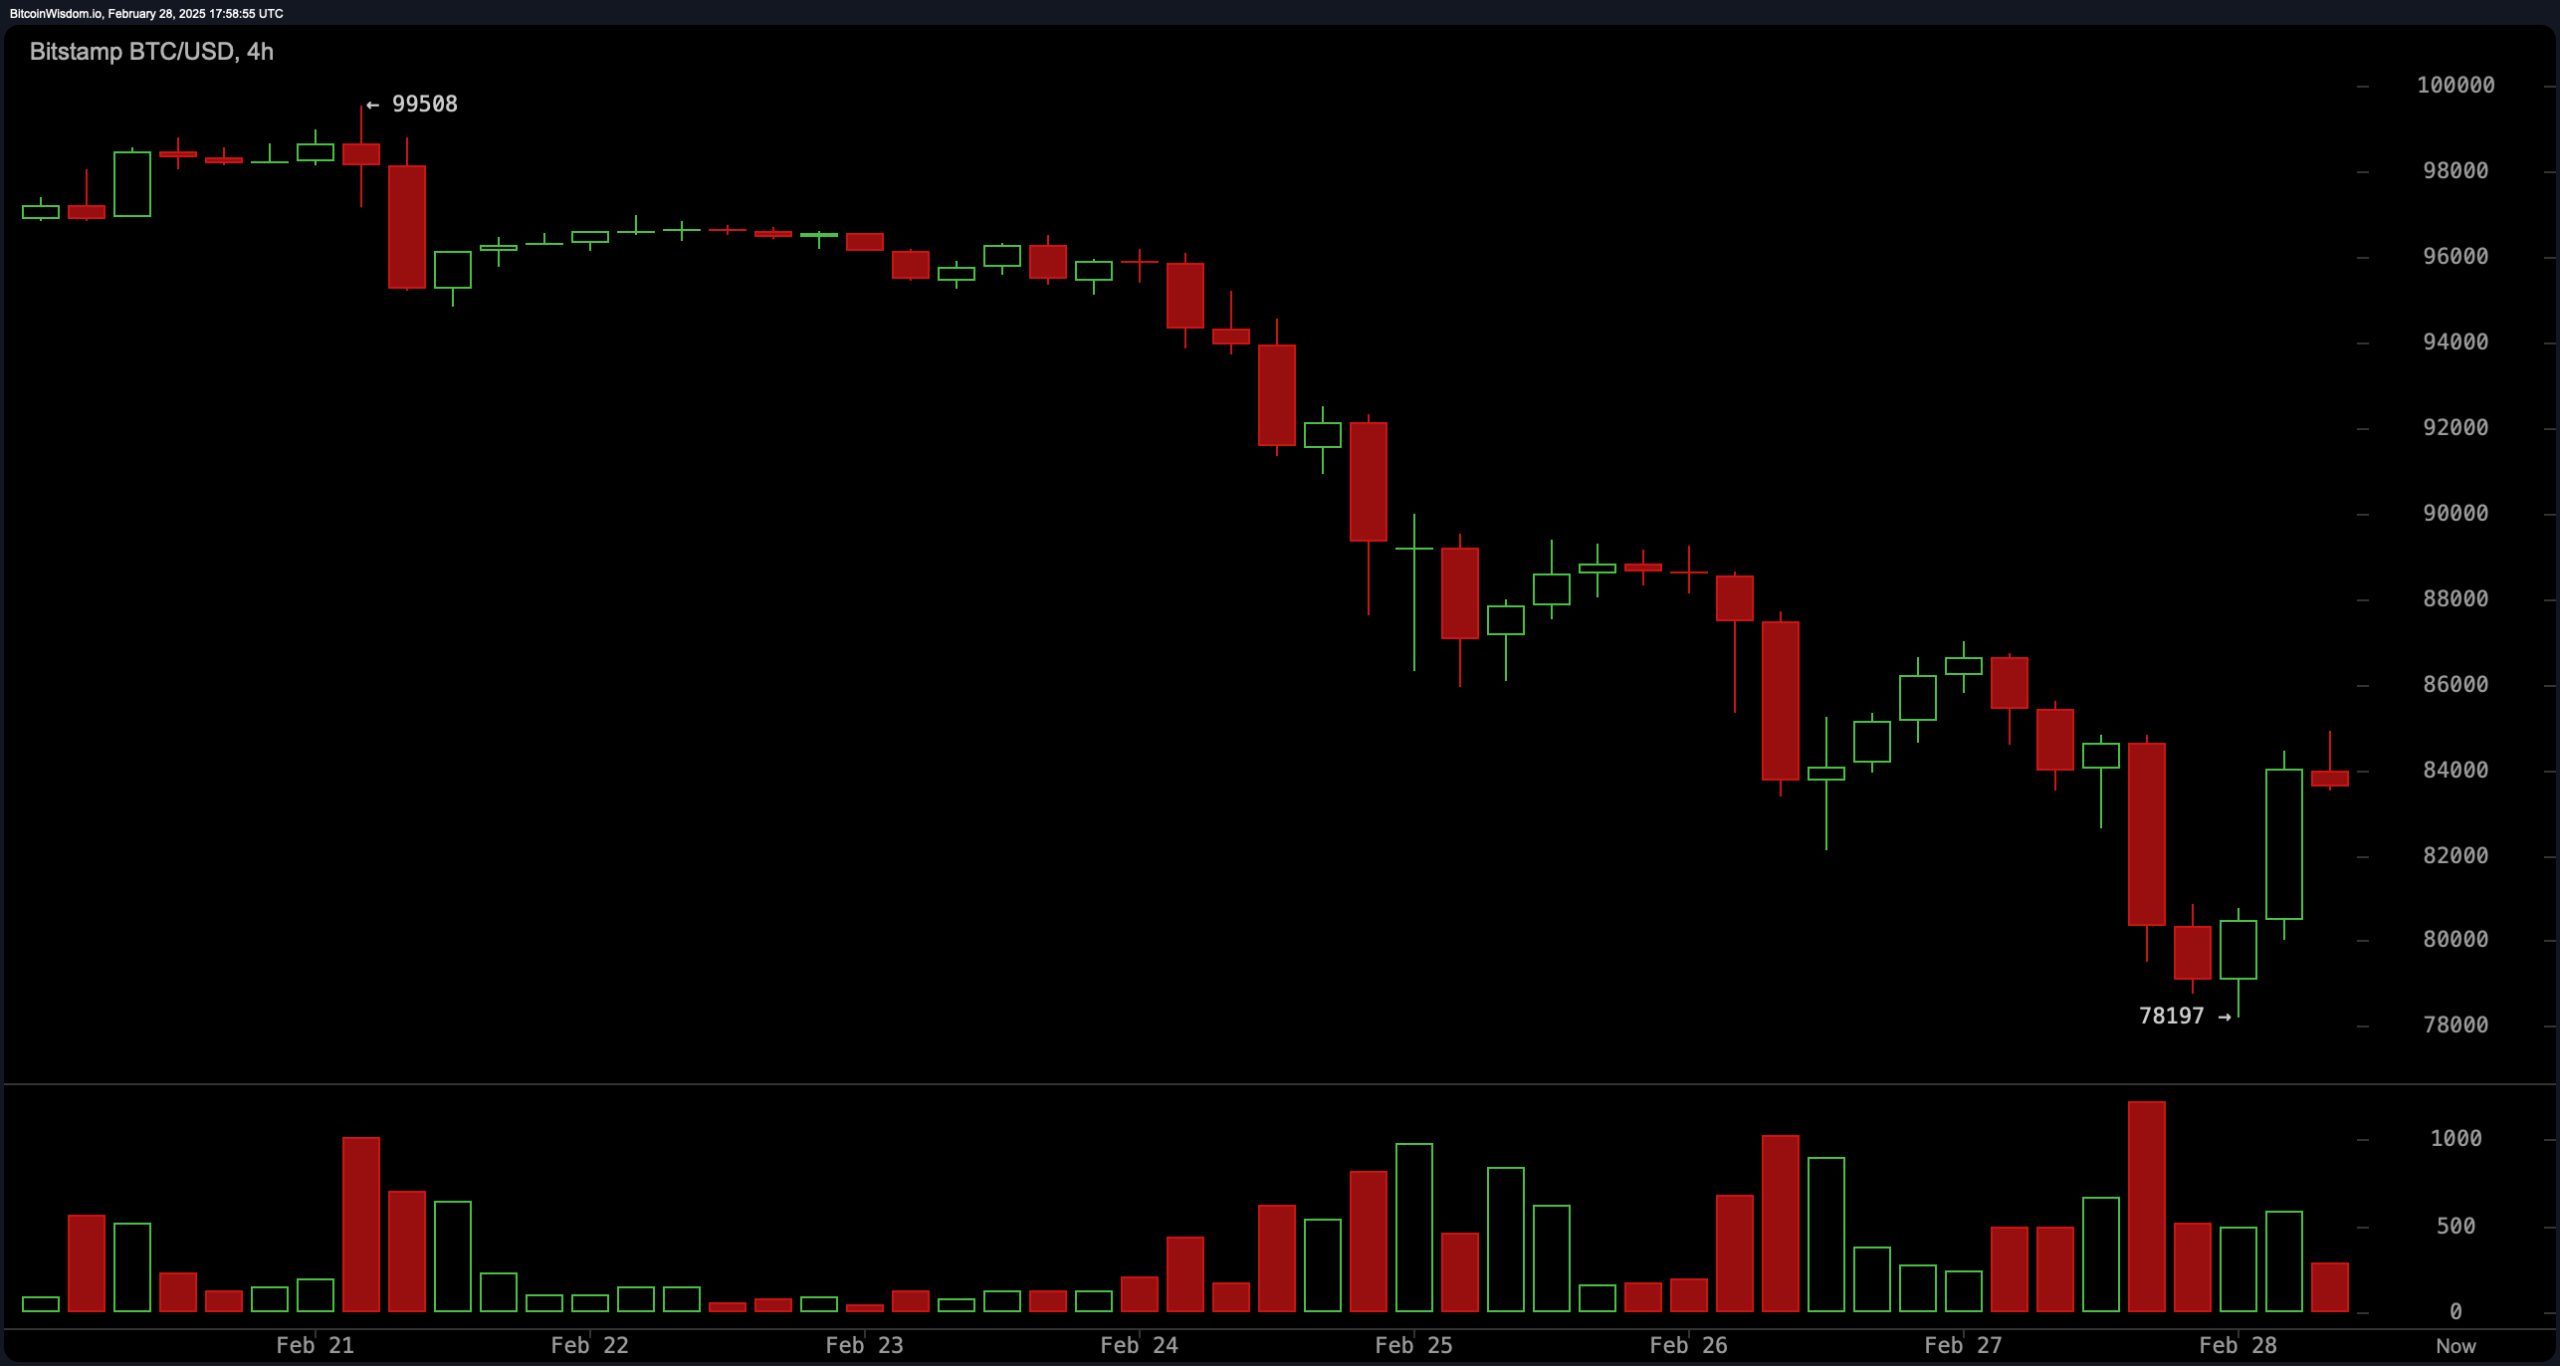
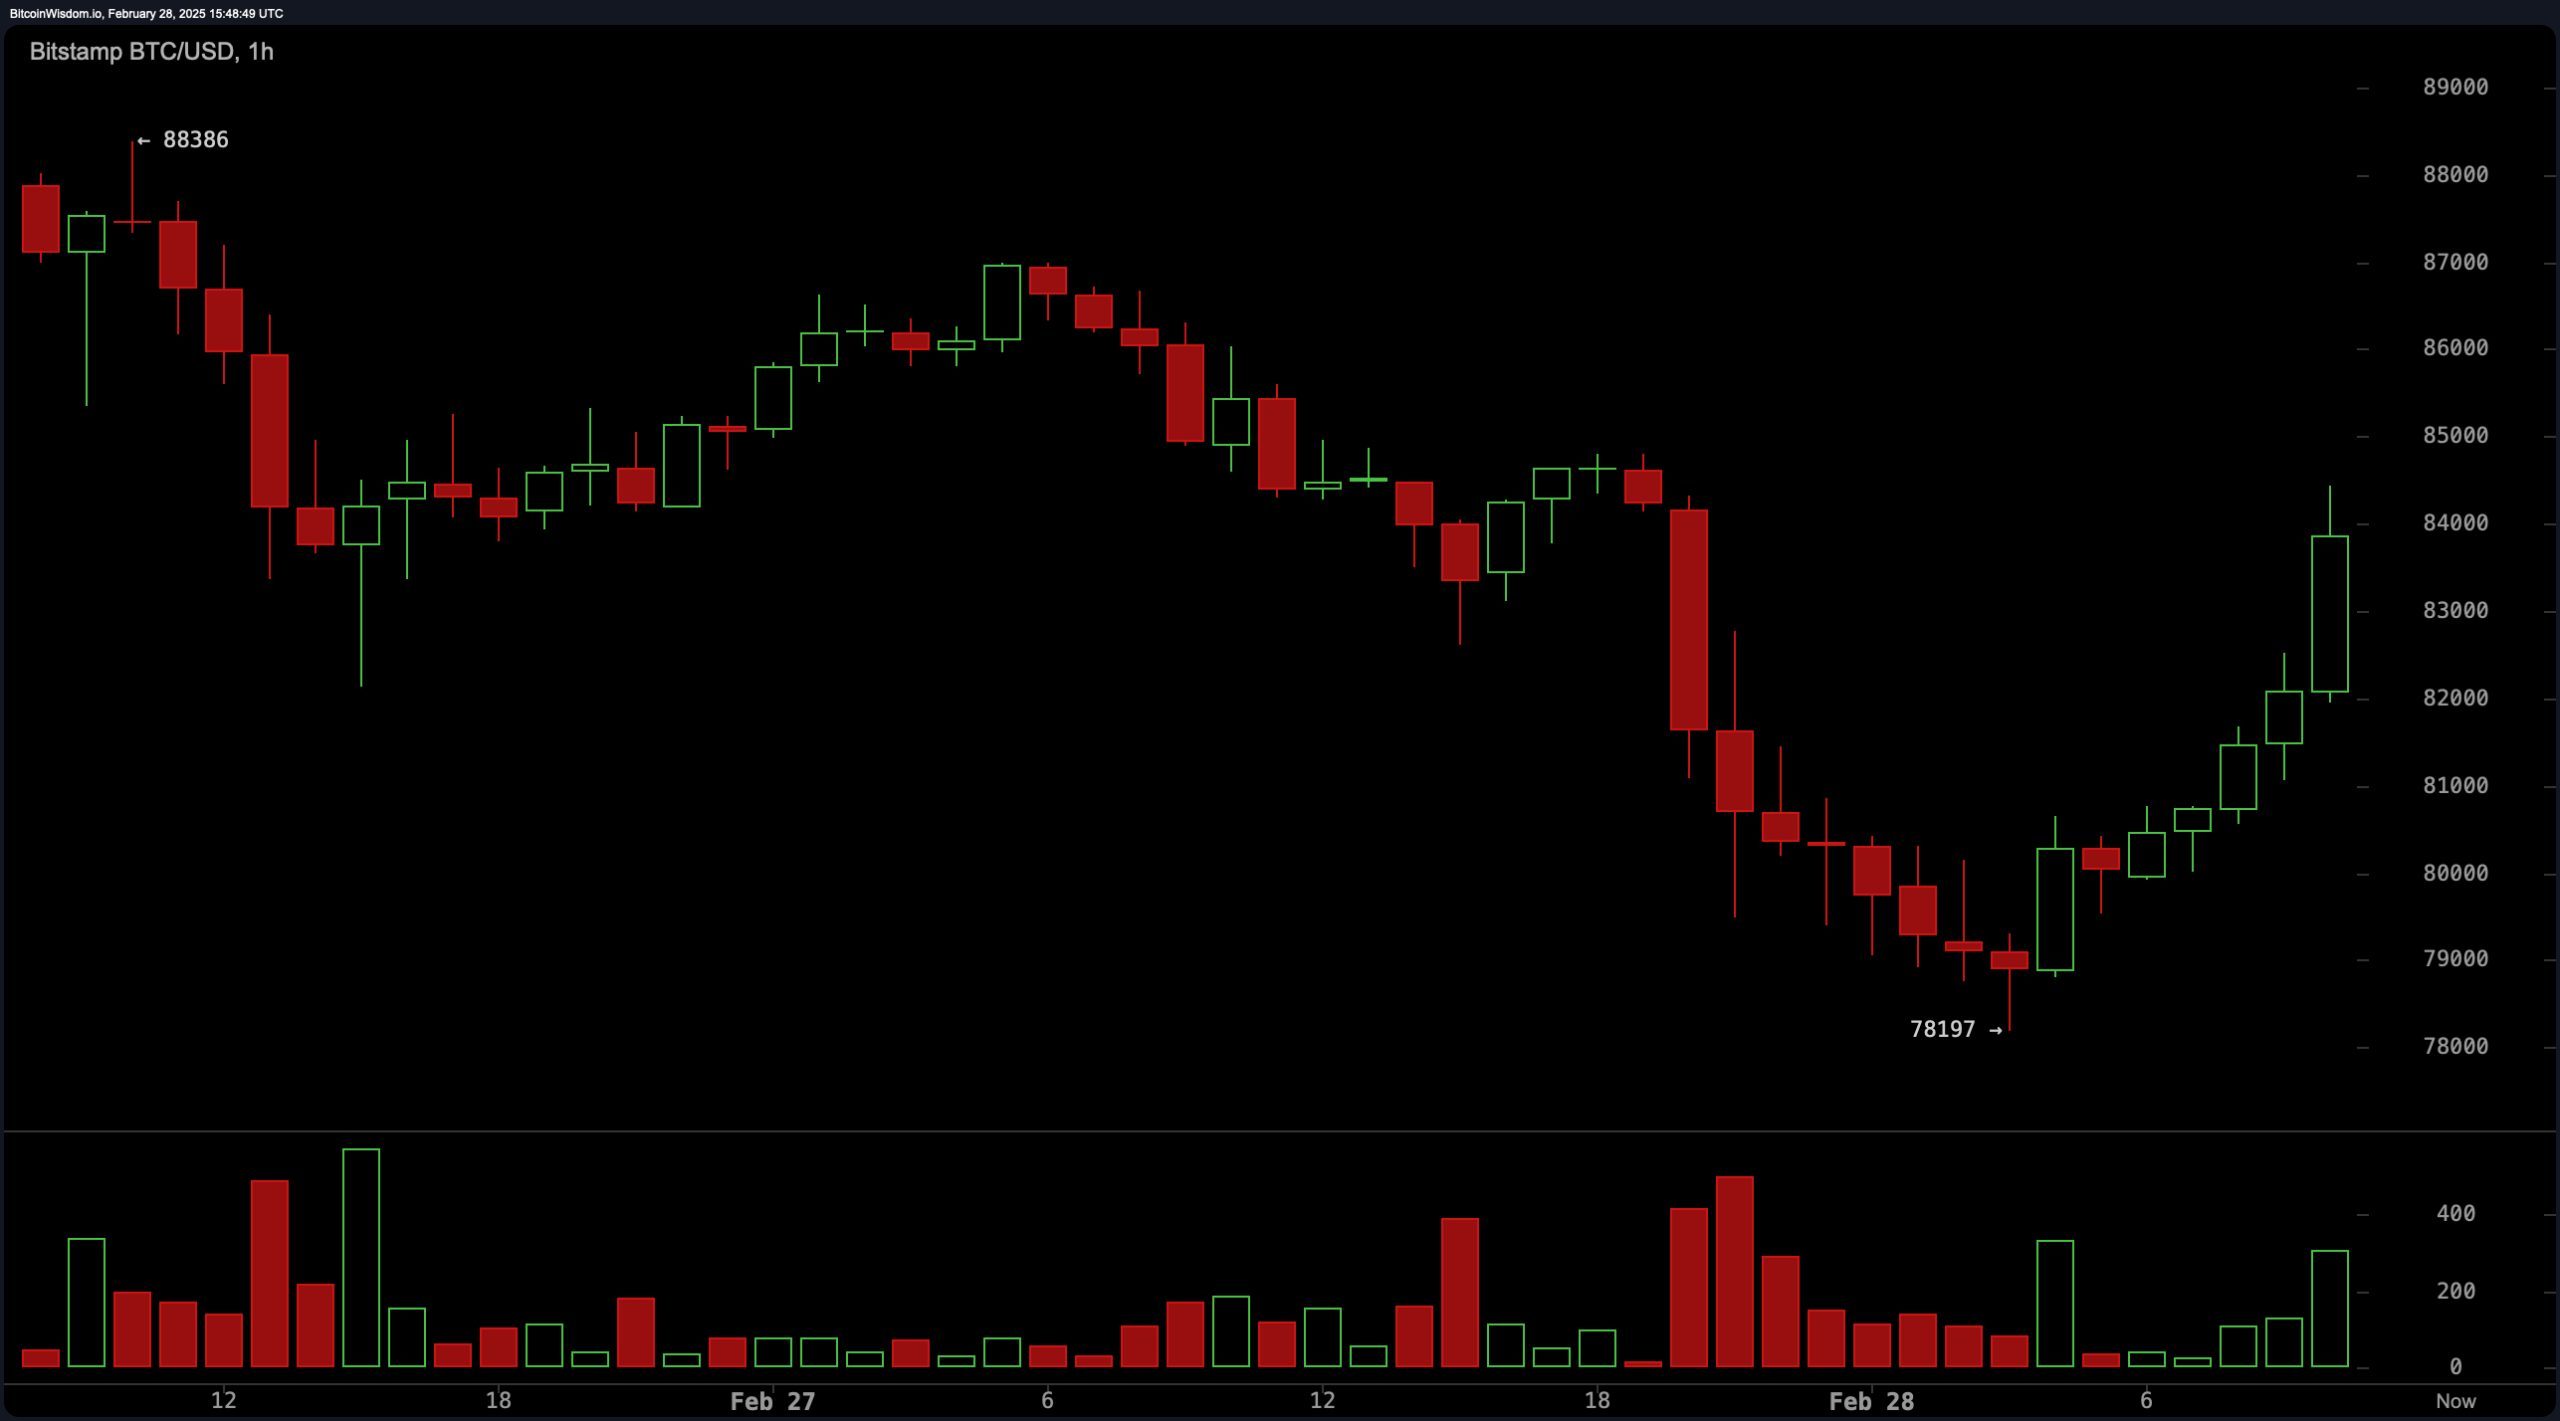
Bitcoin is currently priced at $83,779, with a market capitalization of $1.66 trillion and a 24-hour trading volume of $91.22 billion, as price action remains volatile within an intraday range of $78,197 to $84,854, potentially signaling a bull trap as technical indicators point to underlying weakness despite short-term rebounds.
Bitcoin
Recent price movement suggests bitcoin ($BTC) has experienced a relief rally following a sharp decline to $78,197. However, multiple technical indicators indicate that the dominant trend remains bearish. The relative strength index (RSI) sits at 25, signaling neutral conditions, while the moving average convergence divergence (MACD) level remains negative at -3,345, indicating that bearish momentum is still in play. Additionally, the momentum oscillator registers at -11,908, reinforcing the weakness in upward price movement. Although the Stochastic and commodity channel index, at the moment, suggest short-term positive signals, broader moving averages (MAs) overwhelmingly suggest continued downward pressure.
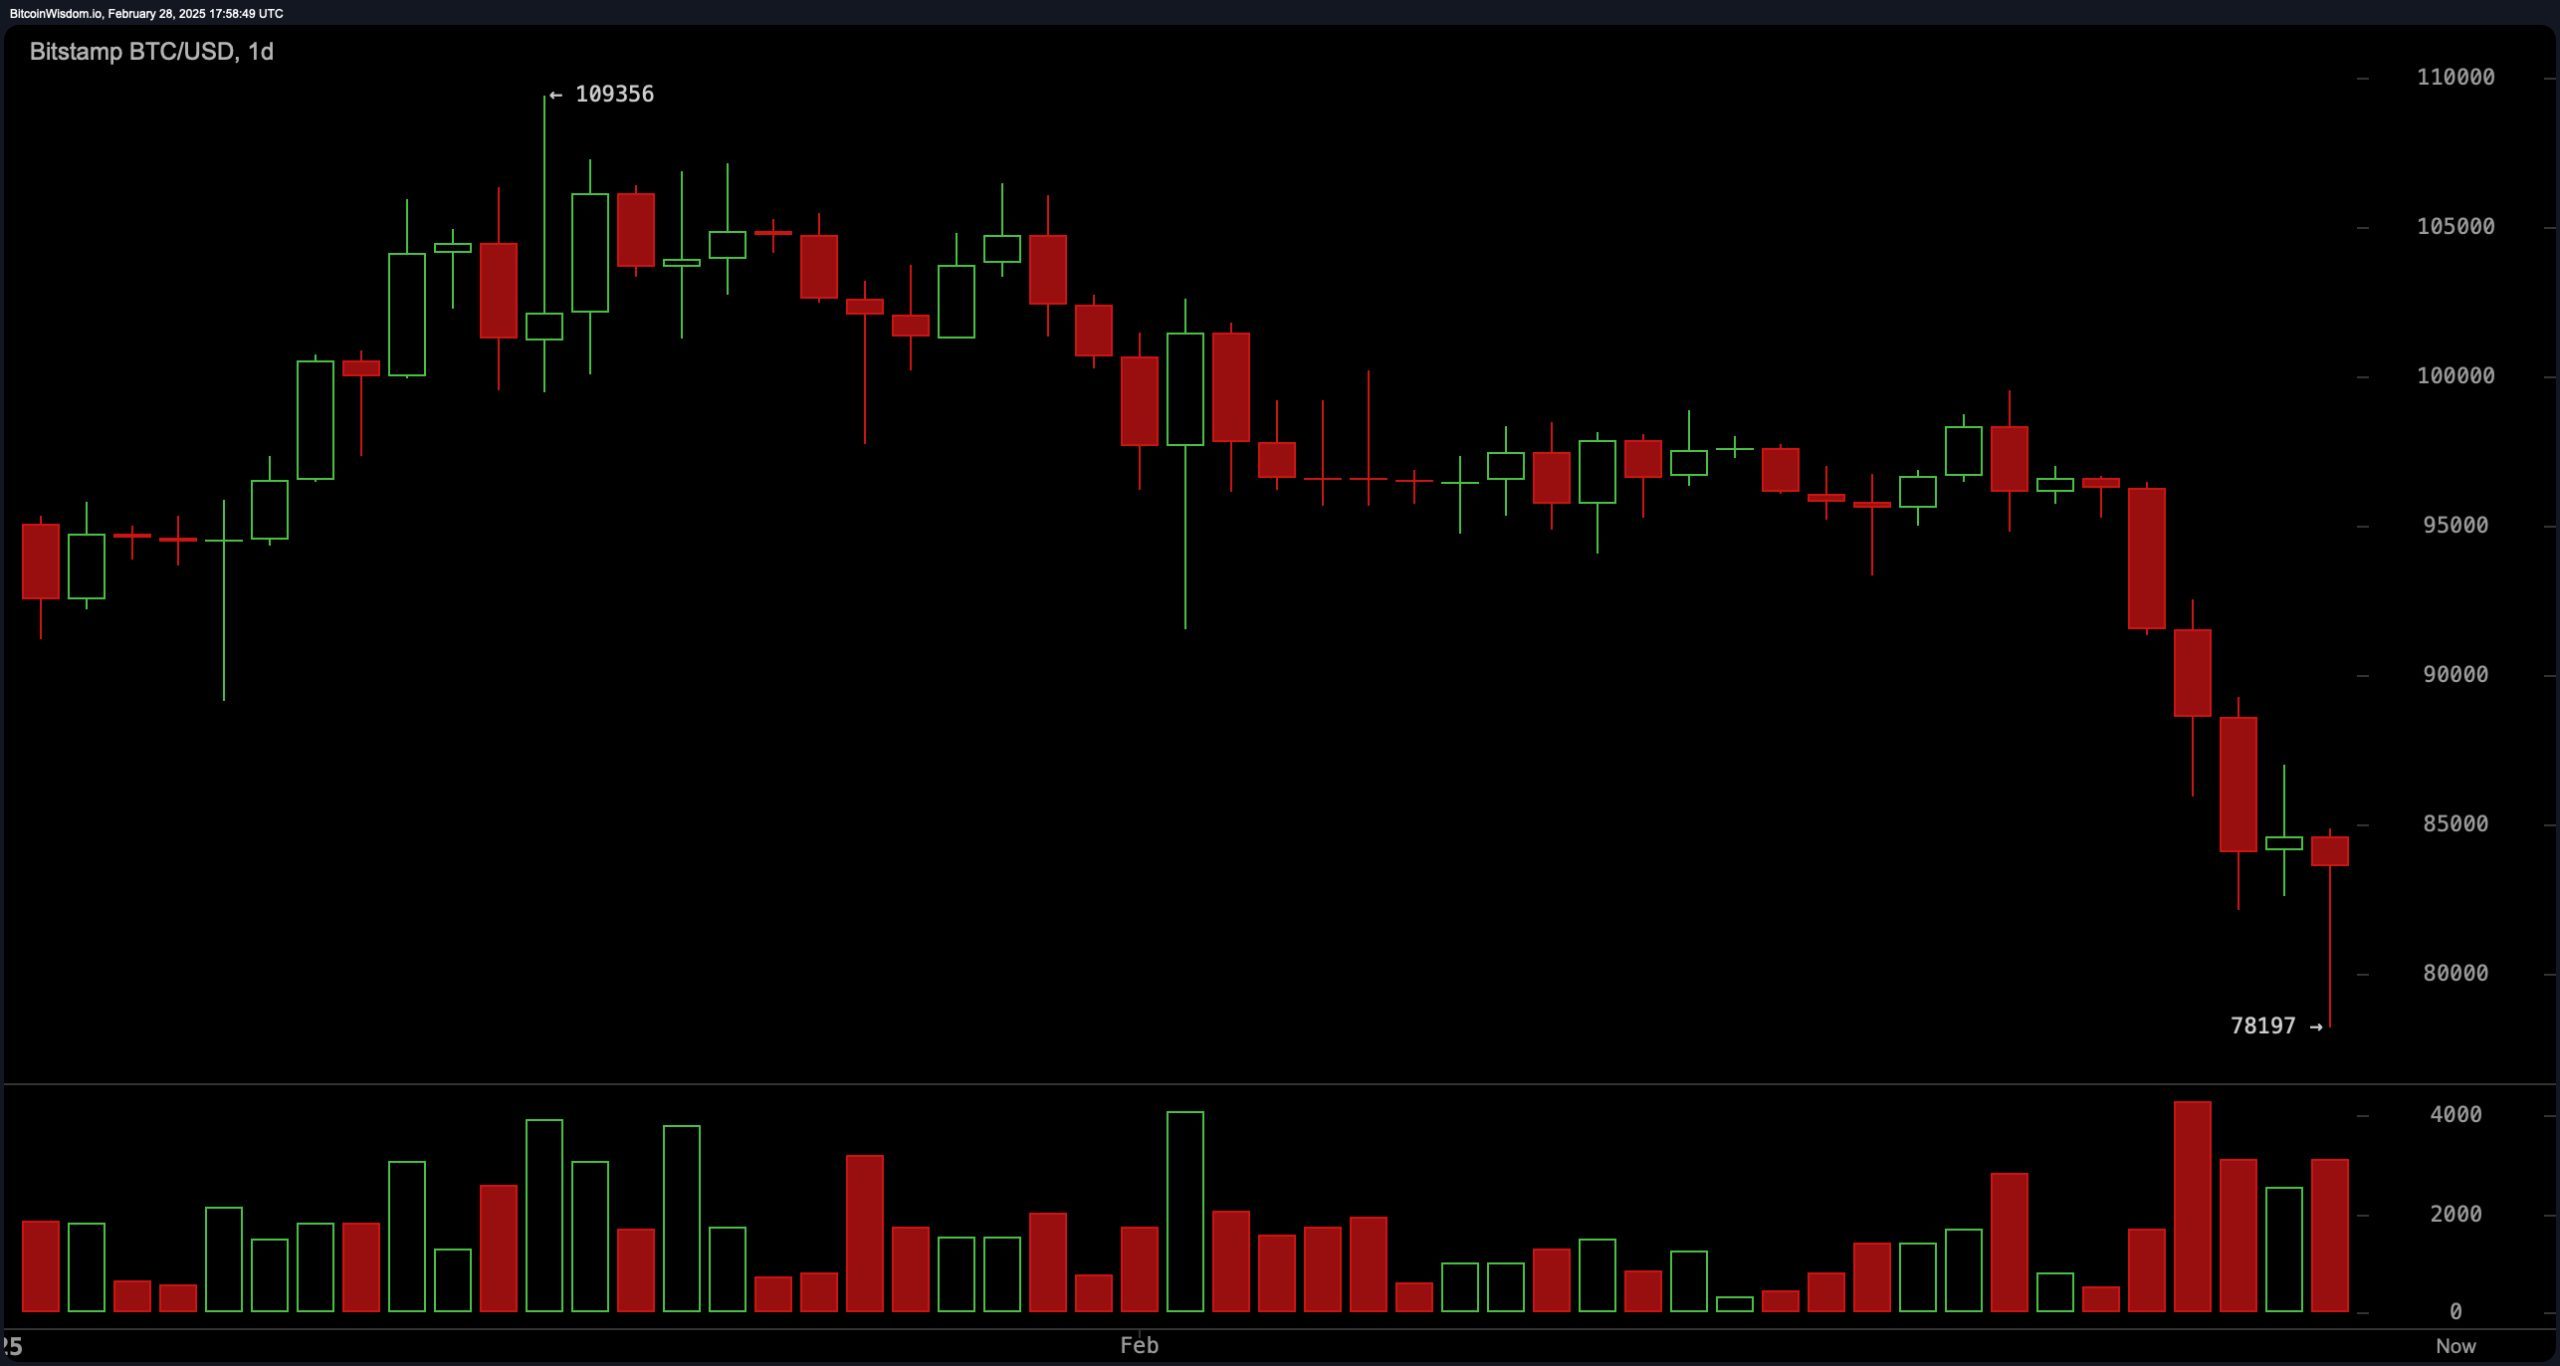
On $BTC’s daily chart, bitcoin is trading well below key resistance zones between $85,000 and $90,000, and the downward trajectory is supported by high selling volume. Every major moving average, including the exponential moving average (EMA) and simple moving average (SMA) across 10, 20, 30, 50, and 100 periods, reflects a strong negative sentiment. The only outlier is the simple moving average (SMA-200), which provides a bullish signal at $81,995, suggesting that this level may serve as a longer-term support. Given the broader market trend, any bounce toward resistance is likely to face significant selling pressure, making current price action suspect.