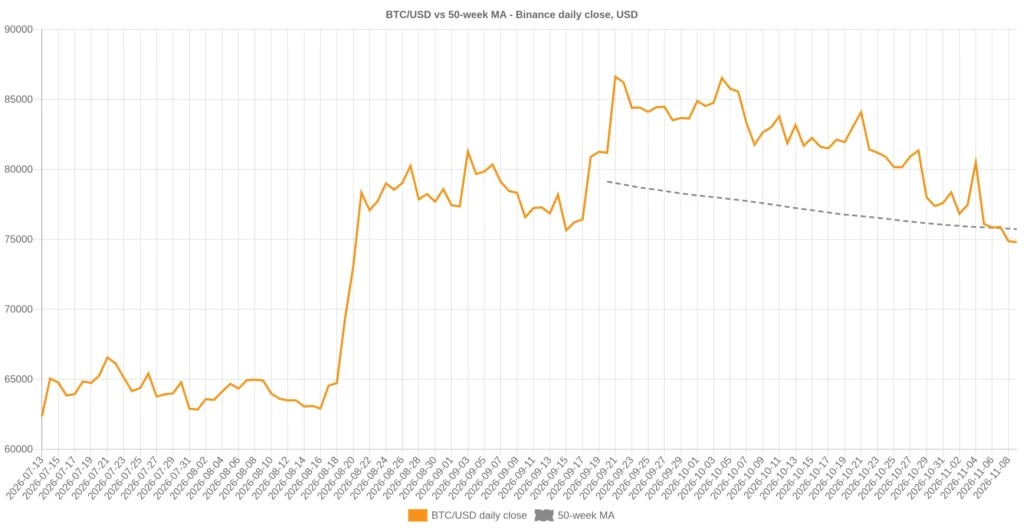
The First Close Below the 50-Week Line Since September
The chart above plots bitcoin’s daily close against its 50-week moving average, a 350-session average of daily closes. That line sat at $75,758.60 on Nov. 8 and the day’s close came in at $74,851.44, 1.20% below it. It was the first close under the average since Sept. 17, after 51 sessions above it. Monday’s price of $75,238, read at 22:40 UTC, is still 0.7% beneath the line, but the Nov. 9 candle has not closed, so the count of closes below the average remains one.
The 200-day average is a different story, and the difference is the whole point. At $73,224, it sits 2.8% below the current price. Bitcoin has not closed under it in this move. Ether, by contrast, closed at $2,127.46 on Nov. 8 against a 200-day average of $2,156 — its first close beneath that line since Aug. 18 — and trades at $2,132.65, still under it. Two large-cap assets, one shared sell-off, two different technical positions.
That gap is why the drawdown numbers below matter more than the headlines. The market has not broken evenly.
What the ETFs Did
Farside Investors records the U.S. spot bitcoin funds losing $1.28 billion in the five sessions to Nov. 6: minus $398.6 million on Nov. 2, minus $115.6 million on Nov. 3, plus $74.6 million on Nov. 4, minus $430.2 million on Nov. 5 and minus $411.9 million on Nov. 6. BlackRock’s IBIT accounted for $403.0 million of the final day and $405.3 million of the first.
The two prior weeks also closed negative, at $248.7 million across Oct. 21 to Oct. 23 and $202.4 million across Oct. 26 to Oct. 30. Cumulative net inflows since the funds launched stand at $55.77 billion.
Put the week against the market cap and the number shrinks to something more honest. $1.28 billion is 0.085% of bitcoin’s $1.51 trillion market capitalisation. The full cumulative ETF position, $55.77 billion, is 3.7% of it. Those funds are a large, visible, daily-priced holder. They are not the market.
What they are is measurable. The largest single-day redemption in the week, $430.2 million on Nov. 5, is roughly 5,650 bitcoin at that day’s close of $76,088. That is supply that had to be absorbed by someone else in one session.
The Screen: Where the Drawdown Is Deepest
Measured from each asset’s 30-day high to Monday’s price at 21:35 UTC, the ordering is not the one most traders would guess from the headlines. $XRP is the deepest faller of the majors, at $1.099 against a $1.43 high on Oct. 11, a 23.1% decline, with a $69.8 billion market cap. Solana is next, at $86.80 against $113.40 on Oct. 12, 23.5% off, with $51.3 billion. Ether sits at $2,132.65 against $2,579.88 on Oct. 12, 17.3% off, with $260.6 billion. Zcash is at $1,182.85 against $1,398.14 on Oct. 29, 15.4% off, with $20.1 billion. Bitcoin, at 11.4% off its $84,898 high of Oct. 21, has fallen the least of the group while carrying a cap 5.8 times ether’s.
The arithmetic of what a recovery would require is where the comparison gets useful. Bitcoin needs 32.9% to reclaim $100,000 and 100% to double to $150,476. Ether needs 40.7% to reach $3,000 and 100% to double to $4,265. Solana needs 15.2% to print $100. $XRP needs 82.0% to reach $2.
Doubling bitcoin from here would add $1.51 trillion of market value. Doubling ether would add $260.5 billion. That is not an argument about which asset is better. It is an argument about what each one has to absorb: the larger the cap, the more capital a 2x requires, and the more of it has to come from outside the existing holder base.
The Coin to Watch: Solana’s Dated Catalyst
Most of the coins on that list are moving on the same macro tape. One has a dated, company-level change this week. On Nov. 9, Charles Schwab began offering solana, avalanche and chainlink alongside bitcoin and ether in Schwab Crypto accounts, a five-asset lineup we covered at the time of the announcement. The three do not trade as one listing trade: avalanche is up 9.6% over the past 24 hours while solana added 1.3%.
The case for watching solana is not that a brokerage listing changes its economics. It is that a new distribution channel is a measurable, testable claim. Schwab charges 75 basis points per trade and excludes New York and Louisiana residents, so the addressable pool is smaller than the headline suggests. What to watch is whether solana’s share of Schwab Crypto volume shows up in the next monthly disclosure, not whether the announcement was bullish.
At $86.80, solana is 15.2% below $100 and 23.5% below its own 30-day high. Its $51.3 billion cap is 19.7% of ether’s and 3.4% of bitcoin’s, which makes it the cheapest of the large caps to move — and the most exposed if the ETF outflow continues.
What Would Break the Bid
The mechanism to watch is the same one that produced last week: a daily redemption figure above $400 million, two days running, with IBIT carrying most of it. That is what Nov. 5 and Nov. 6 looked like, and it is the pattern that turns an 11.4% drawdown into something with a second leg.
The counterweight is corporate buying that is still funded. Strategy’s 849,327 bitcoin sit 0.3% below its $75,451 average cost, as we calculated on Nov. 9 — which means the largest corporate holder is now underwater on its position and still buying. That is a fact about the holder, not a forecast about the price. A treasury that keeps buying at a loss is evidence of intent; it is not evidence of a floor.
For a reader allocating today, the honest summary is this: bitcoin is 11.4% off its high, above its 200-day average, below its 50-week average, and the funds that bought the last leg are selling. The setup is a lower price with an unresolved flow. That is a reason to size a position rather than a reason to take one.
Frequently Asked Questions
Is bitcoin below its 50-week moving average?
Yes, on a closing basis. The 50-week average sat at $75,758.60 on Nov. 8 and bitcoin closed at $74,851.44, 1.20% below it — the first close beneath the line since Sept. 17. Monday’s price of $75,238 was still 0.7% under the average, and bitcoin remains 2.3% above its 200-day average of $73,224.
How much did bitcoin ETFs lose last week?
The U.S. spot bitcoin funds lost $1.28 billion in the five sessions to Nov. 6, per Farside Investors, with $403.0 million leaving IBIT on Nov. 6 alone. The prior two weeks were also negative, at $248.7 million and $202.4 million.
Which major is down the most from its 30-day high?
$XRP, at 23.1% below its Oct. 11 high of $1.43. Solana is 23.5% below its Oct. 12 high, ether 17.3% below its Oct. 12 high and bitcoin 11.4% below its Oct. 21 high.
What is the dated catalyst for solana this week?
Schwab added solana, avalanche and chainlink to Schwab Crypto accounts on Nov. 9, bringing the lineup to five assets at 75 basis points per trade, with New York and Louisiana excluded.
Does a doubling of bitcoin require the same capital as a doubling of ether?
No. Bitcoin’s $1.51 trillion market cap means a 2x adds $1.51 trillion of value; ether’s $260.5 billion means a 2x adds $260.5 billion.
Data: CoinGecko, Farside Investors, CoinGlass.This article is not intended as financial advice. Educational purposes only.

 blockchainreporter.net