1- Bitcoin January 2025: Outlook of $BTC Struggles
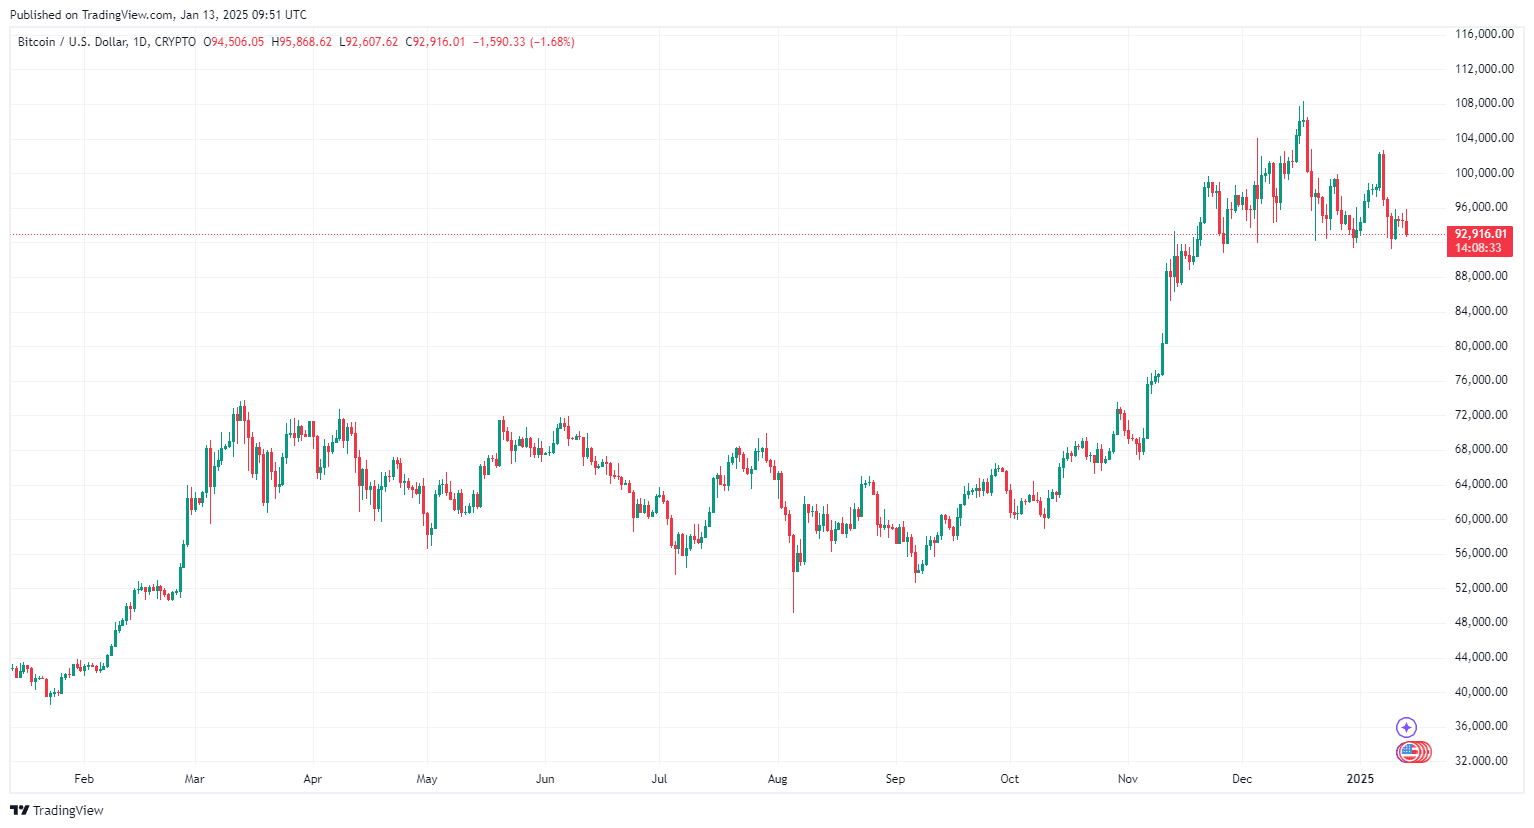
A closer look at Bitcoin January 2025 performance to date shows that Bitcoin price momentum has taken a bearish turn, as $BTC struggles to maintain key support levels. Bitcoin's near-term trajectory remains uncertain with reduced network activity, declining capital inflows, and macroeconomic pressures weighing on the market. But to better understand what might be ahead, a deeper look into $BTC levels and indicators is required for an accurate Bitcoin price analysis combined with key insights on the market, which would ultimately shed light on this week's Bitcoin price prediction.
2- Bitcoin Price Analysis: $BTC Levels and Indicators
Current Bitcoin Performance and Market Data
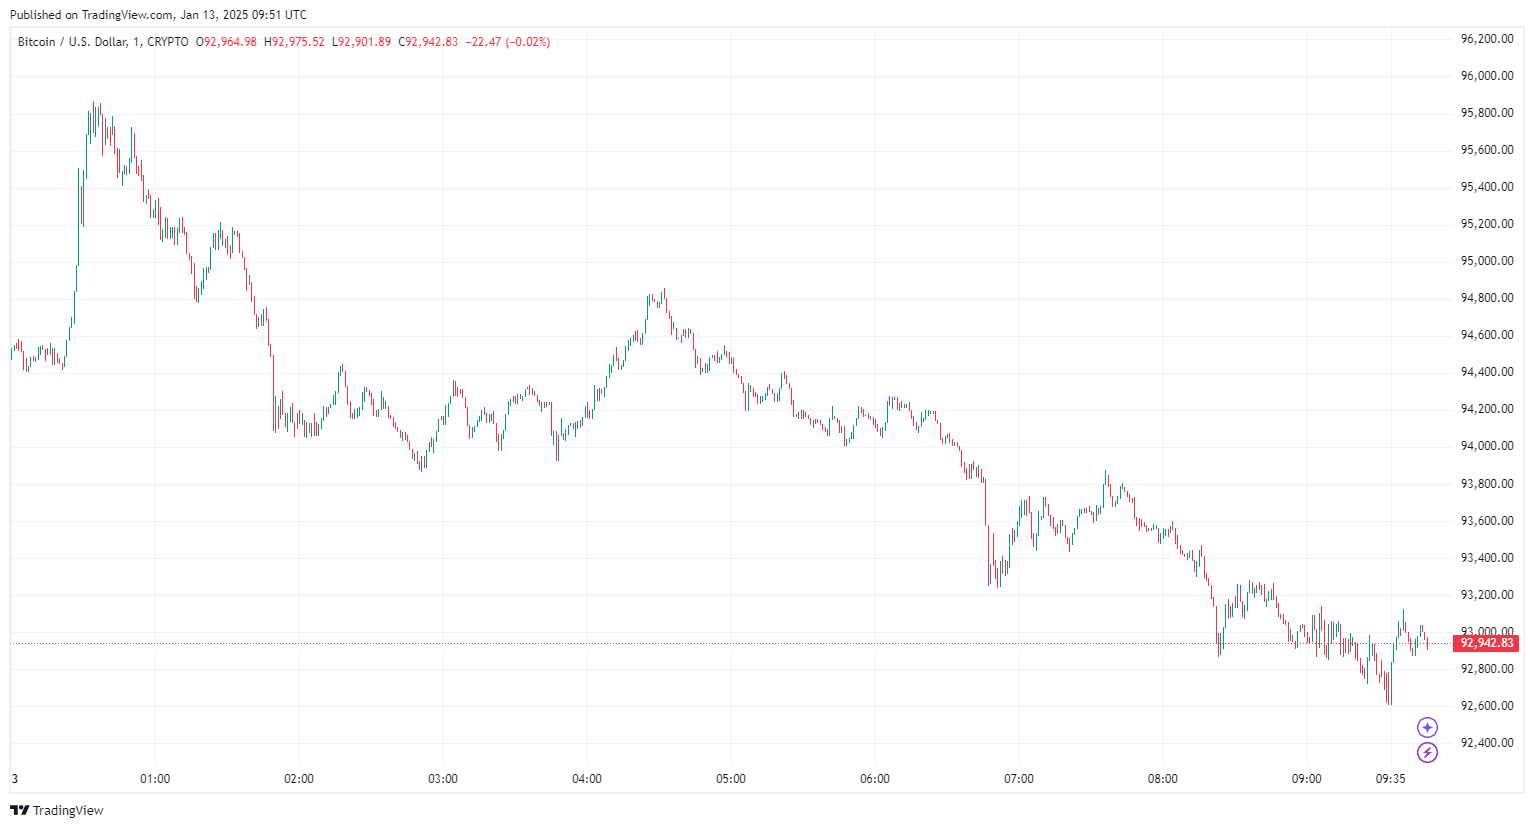
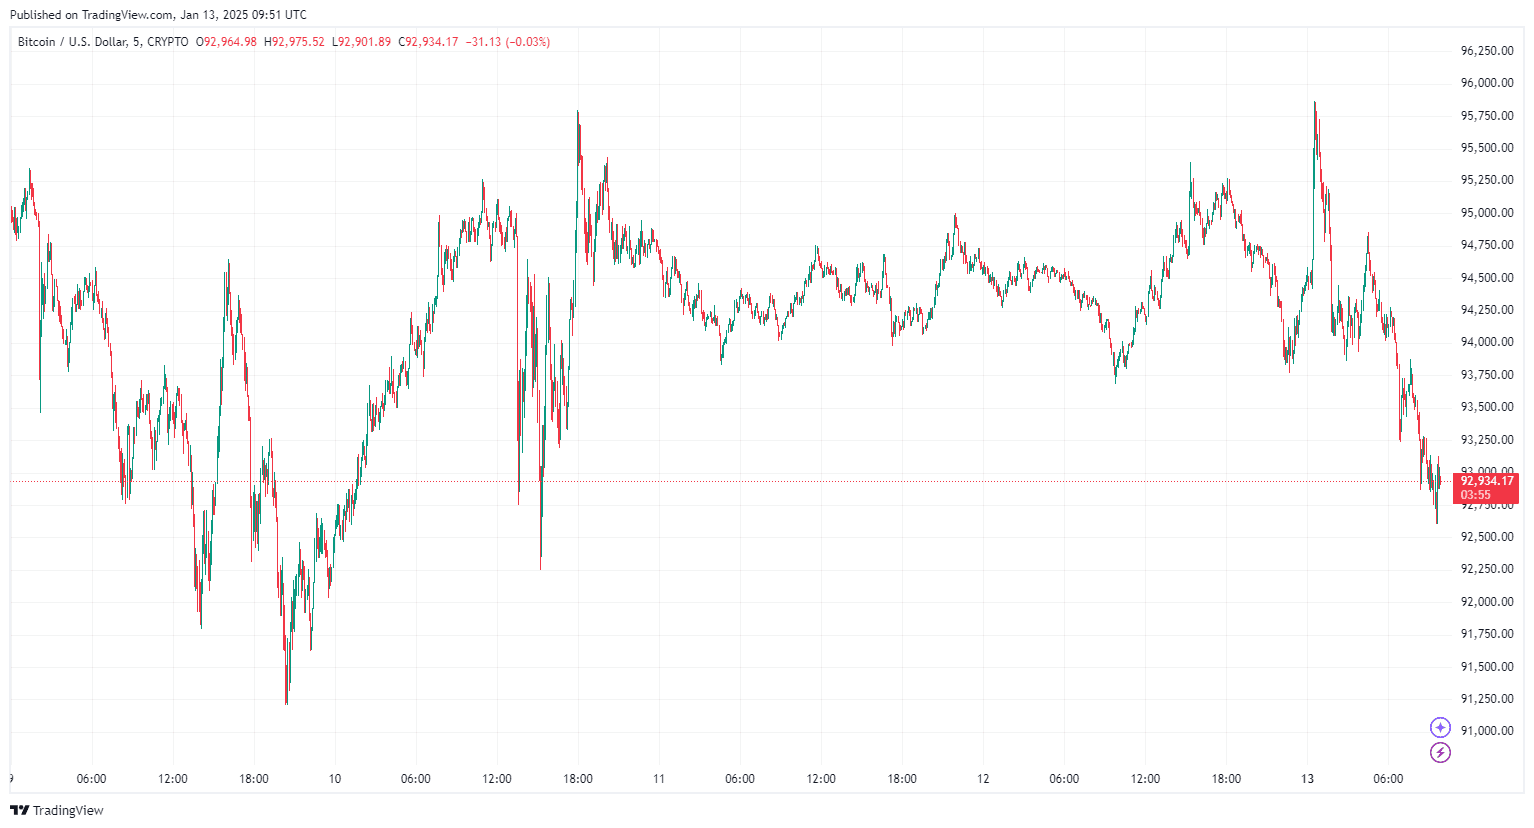
- $BTC Price: $93,034.76
- Market Cap: $1.84 trillion
- Circulating Supply: 19.8 million $BTC
- 24h Trading Volume: $32.17 billion
-
Intraday Range:
- Low: $92,736.77
- High: $95,837.00
-
Performance:
- 1-Day: -1.00%
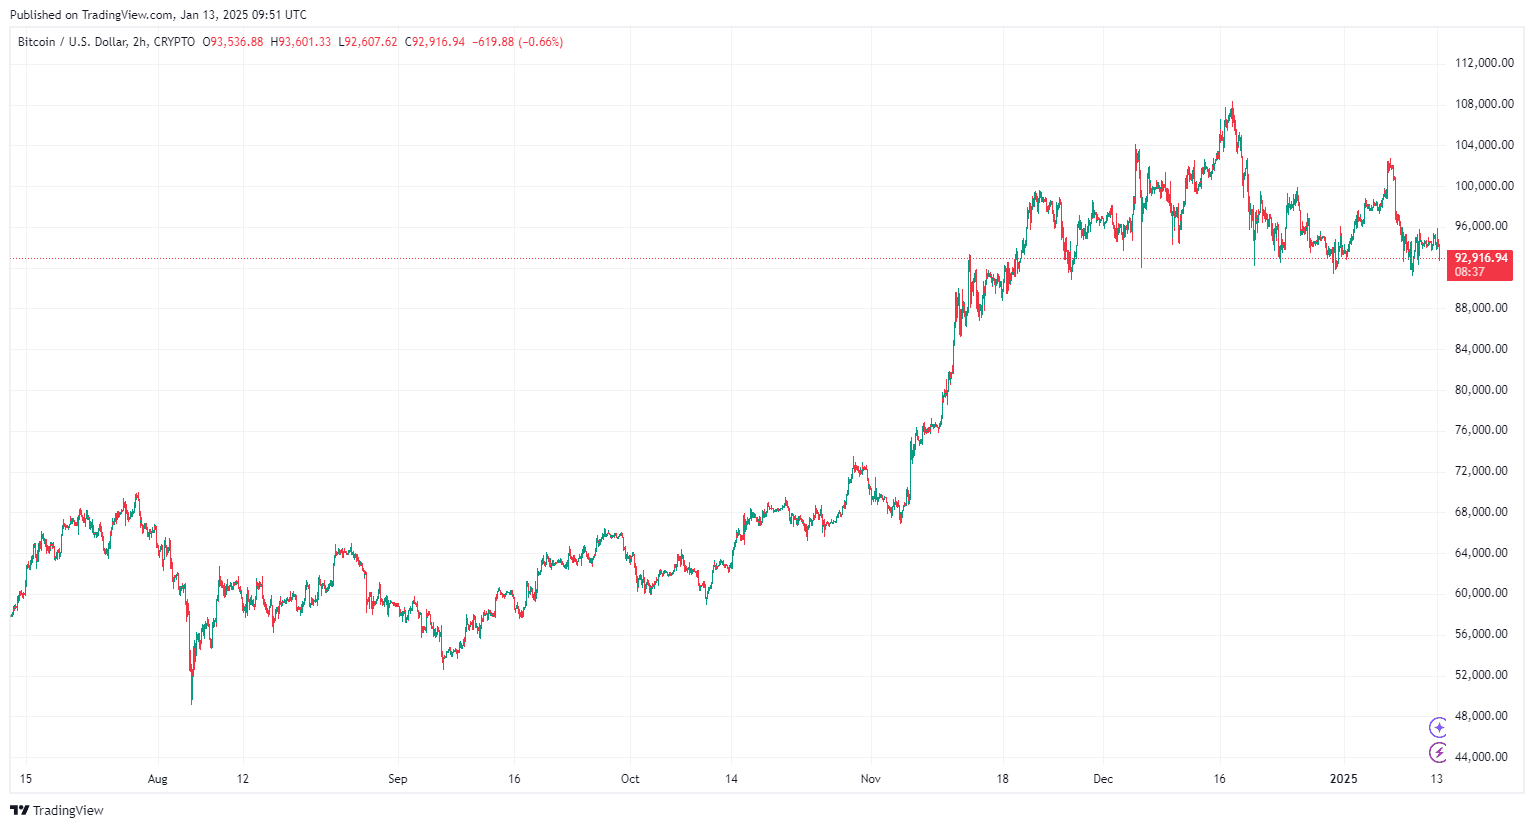
- 5-Day: -5.53%
- 1-Month: -8.41%
Bitcoin's price drop below $94,000 marks a continuation of its bearish trend, influenced by weak network activity and reduced investment interest. The global cryptocurrency market cap has also declined by 2.19%, standing at $3.22 trillion.
Technical Indicators and Support Levels
Technical indicators from TradingView reflect bearish sentiment for Bitcoin:
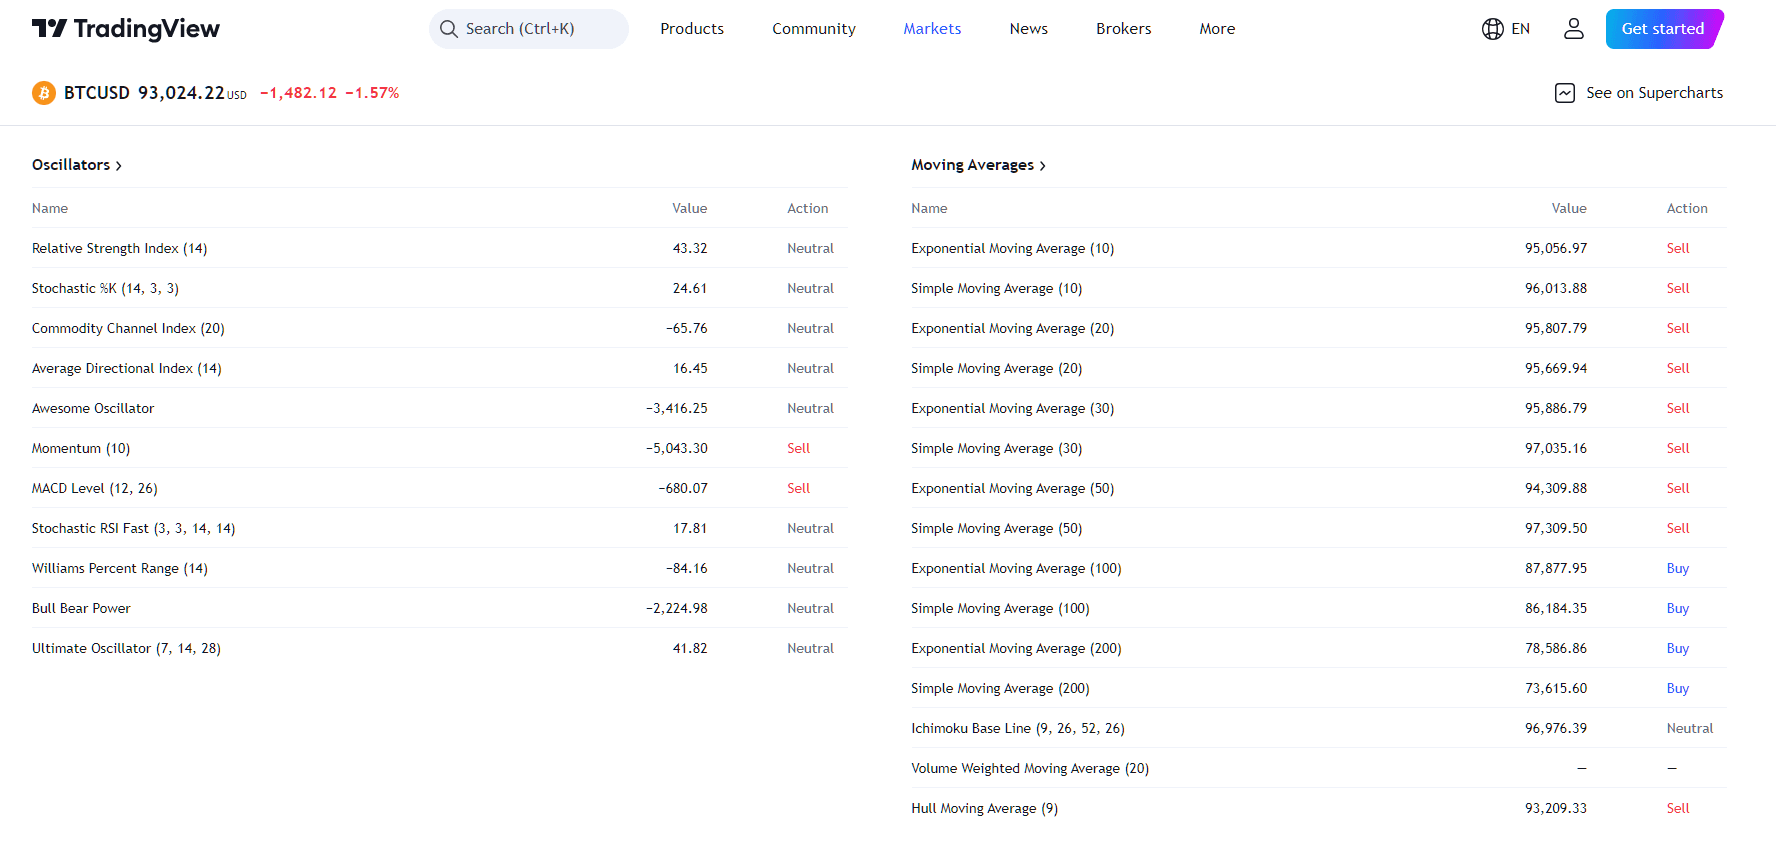
- Oscillators: Momentum (-5,043.30) and MACD Level (-680.07) signal a sell trend.
- Moving Averages: Most moving averages (e.g., EMA 10, SMA 50) also show sell signals.
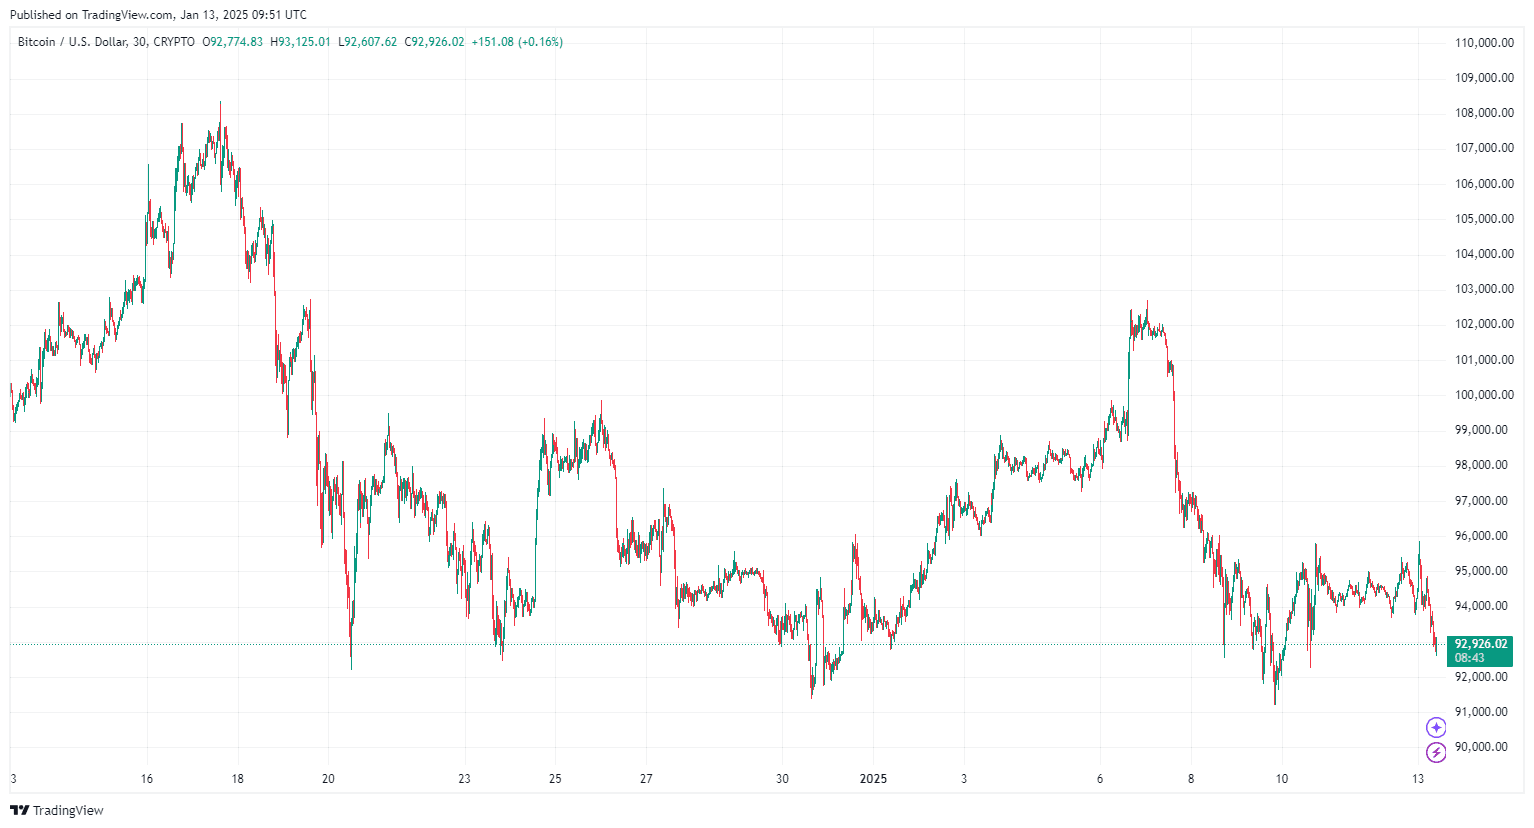
Key support and resistance levels to watch this week:
- Support: $90,000, $87,500
- Resistance: $94,500, $96,000, $97,000
3- Key Insights from Bitcoin Network Activity
Recent posts from crypto analyst Ali Martinez on X highlight concerning metrics for Bitcoin:
Large Transactions Decline:
- Large transactions on the Bitcoin network have dropped by 51.64% in the past month, from 33,450 to 16,180. This signals a significant reduction in whale activity.
Falling Active Addresses:
- Bitcoin network activity is at its lowest since November 2024, with only 667,100 active addresses.
Reduced Capital Inflows:
- Capital inflows into the cryptocurrency market have plummeted by 56.70%, from $134 billion to $58 billion. This indicates a sharp decline in investment interest.
Critical Resistance Zone:
- Bitcoin faces a key resistance zone between $97,000 and $99,500, where 1.26 million addresses previously accumulated 1.22 million $BTC. Breaking this level could be pivotal for a bullish reversal.
4- Bitcoin Price Prediction for This Week
Bitcoin’s performance this week will depend heavily on its ability to hold the $90,000 support level and break through immediate resistance zones. Here are the scenarios:
Bitcoin Bearish Scenario:
- If $BTC fails to hold $90,000, it could test lower levels around $87,500. Weak network activity and reduced investment inflows could exacerbate the decline.
Bitcoin Bullish Scenario:
- A rebound above $94,500 may drive $BTC toward $96,000–$97,000. Breaking through the $97,000–$99,500 resistance zone would require strong buying momentum, currently absent.
Bitcoin Likely Range:
- $BTC is expected to trade between $91,000 and $94,000, reflecting a range-bound movement driven by cautious market sentiment.
Will $BTC Price crash below $90,000 this Week?
Bitcoin price action remains under pressure as bearish factors weigh on market dynamics. While the long-term outlook for Bitcoin in 2025 remains bullish, short-term indicators suggest a cautious approach for traders. The $90,000 support level will be critical this week, with any breach potentially leading to significant downside.